DURING the execution phase of your project, your resources are working on their tasks, and you’re tracking their progress by entering actuals into your project plan. Those actuals, combined with your baseline information, give you the means to compare your current progress against your original plan. As part of your project control responsibilities, you use this information to analyze project performance, see how you’re doing, and take any corrective action that you might deem necessary.
In your monitoring and control, you might find that one task finishes a few days early, and this affects its successors and their assigned resources. Maybe another task took longer than expected and went over budget. Possibly various changes in the schedule caused a resource to become overallocated and another one to be underutilized for several weeks.
You might need to adjust your project plan to account for such variances. Sometimes the differences work in your favor, as when a task finishes early. Other times the differences point to a potential problem, which you can prevent if you catch it soon enough.
The nature of the changes you make to your project plan depends on your project priorities. Remember the one fixed side of your project triangle (finish date, budget/resources, or scope) and adjust your project accordingly.
Note
For more information about the project triangle, see the introduction to Chapter 10.
In addition to the day-to-day monitoring and adjusting of a project in progress, sometimes large-scale modifications are needed because of external changes imposed on the project. For example, your customers might announce that you must move the finish date up six weeks. Or an unexpected corporate edict might cut $8,000 from your budget or reduce your staff by 10 percent.
Wholesale project modifications can also be indicated because the scheduled finish date, overall cost, or resource allocation has somehow gotten way off track. In this case, radical measures might be needed to bring the project into conformance again.
Whether it’s a huge change imposed on you or a project that derails from within, you might need to replan or reschedule the project. The techniques for rescheduling are similar to those you used to hit your targets when you created the project in the first place. In your project plan, you make adjustments to the schedule, costs, resources, or scope, and Microsoft Project 2010 recalculates your schedule so that you can quickly see the results of your replanning. Then you can get back on track.
Whether you make large adjustments to respond to big problems or small adjustments to keep a healthy project well on its way, you can always keep a close eye on progress. You can analyze the current status of the project and decide on any necessary corrective actions.
If you’re managing a time-constrained project, you’ll want to keep a close eye on a few key bits of project information, such as the following:
Project finish date
Critical path
Start and finish dates of critical tasks
Current progress of critical tasks
Look at these items after you enter actuals. If actuals change task scheduling to the point where your target project finish date is projected to be late, you’ll need to adjust the schedule to bring that finish date back in line.
Use one or more of the following techniques to help you monitor progress and make adjustments to achieve your finish date:
Review finish dates and the critical path to see whether you’re still on track, or whether the project is slipping behind.
Check and adjust task constraints, dependencies, and durations as necessary to have the project still finish on time.
Add resources to tasks to shorten the duration of tasks.
Note
For more strategies about monitoring and adjusting the schedule to achieve a specific finish date, see Bringing in the Project Finish Date.
Another method for monitoring schedule progress is to set a baseline and then compare it against the current schedule. For example, you can see baseline finish dates for tasks next to their scheduled finish dates, based on actuals you entered. Then, you can look at the variances between the baseline and scheduled finish. The finish date variance, for example, is calculated as follows:
(Scheduled/Current) Finish – Baseline Finish = Finish Variance
Note
You can use earned value calculations such as the Schedule Performance Index (SPI) and Schedule Variance (SV) earned value fields to analyze your project performance so far.
Note
For more information on examining project performance, see Chapter 14.
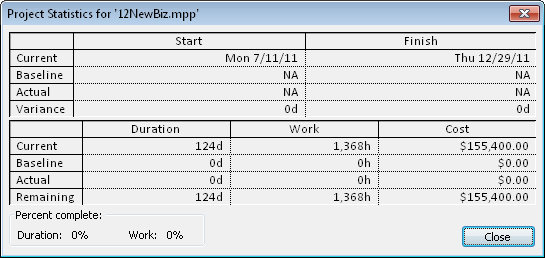
Review your project statistics to get a broad view of how your project status compares with your baseline. Project statistics show your currently scheduled start and finish dates, along with their baseline, actual, and remaining values. To review your project statistics, follow these steps:
On the Project tab, in the Properties group, click Project Information.
The Project Information dialog box appears.
Click the Statistics button.
The Project Statistics dialog box appears. The current (scheduled) finish date appears in the Finish column, as shown in Figure 12-1.
An easy way to keep your eye at all times on the project finish date (along with other key information) is to add the project summary task row, as follows:
Display the Gantt Chart or other task sheet.
On the Format tab, in the Show/Hide group, select the Project Summary Task check box.
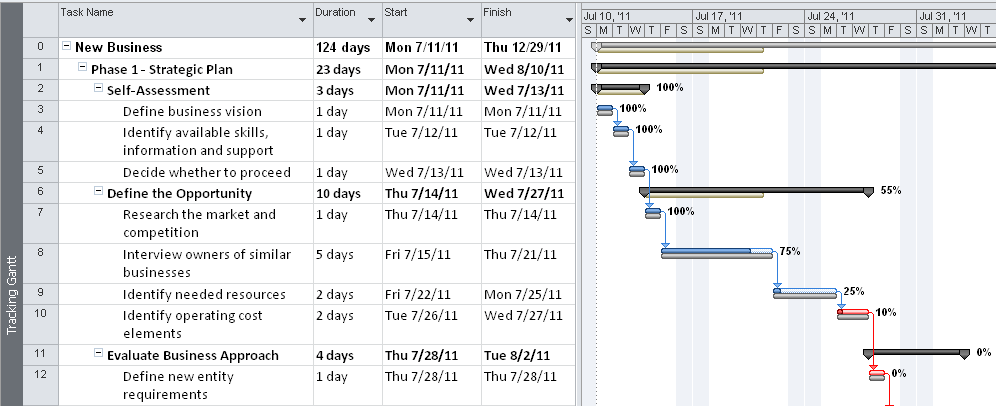
The project summary task appears at the top of any task sheet view, including the Gantt Chart. The Project Summary Task row shows rolled-up task information to display totals for the entire project, as shown in Figure 12-2. Specifically, the Finish field in the project summary row shows the latest finish date in the project. If you add additional fields or apply different tables, information is also rolled up for those fields, as appropriate.
By default, the regular Gantt Chart shows progress as a thin black line through the Gantt bar. To also see percentage complete next to the Gantt bars, apply the Tracking Gantt, as shown in Figure 12-2. On the View tab, in the Task Views group, click the arrow next to Gantt Chart, and then click Tracking Gantt. (If Tracking Gantt is not listed, click More Views, and then click Tracking Gantt.)
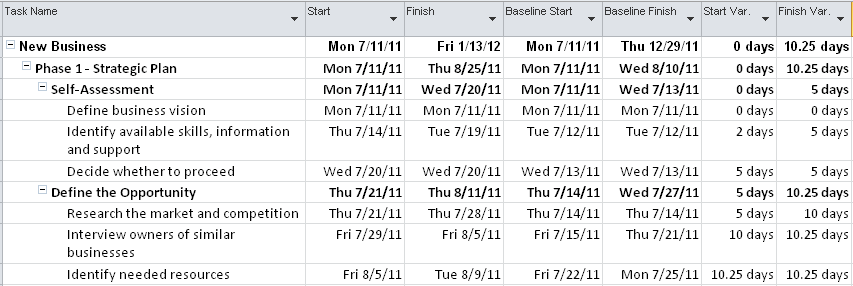
To review the differences between your original baseline plan values and your currently scheduled values, apply the Variance table, as follows:
Display the Gantt Chart or other task sheet.
On the View tab, in the Data group, click Tables, and then click Variance.
As shown in Figure 12-3, the Variance table is applied to the current view.
Note
To quickly change to a different table, right-click the Select All box in the upper-left corner of the table in a sheet view. The list of tables appears.
To quickly see the name of the current view and table, rest your mouse pointer over the Select All box. A ScreenTip lists the name of the current view and table.
By viewing the finish date or the critical path, you can easily see whether you’re still scheduled to hit your target finish date, given the actuals you’ve entered. To see the critical path, apply the Tracking Gantt or Detail Gantt. Both of these views show the critical path in red by default.
Or, in the Gantt Chart or other Gantt view, on the Format tab, in the Bar Styles group, select the Critical Tasks check box. The critical path turns red.
If you need to bring in the finish date, it’s best to start by focusing on those critical tasks.
You can filter your task sheet to show only critical tasks. On the View tab, in the Data group, click the arrow in the Filter box, and then click Critical. To show all tasks again, on the View tab, in the Data group, click the arrow in the Filter box, and then click No Filter.
Note
After a critical task is completed, it becomes noncritical because it can no longer affect the completion of future tasks.
Note
For more information about viewing the critical path, see Viewing the Critical Path.
Reviewing the progress of critical tasks is the most effective means of quickly learning whether your project is staying in line to meet its target finish date.
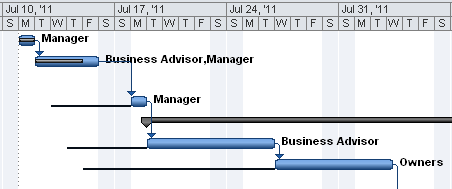
The easiest place to start is to apply a Gantt view that includes the most progress information.
The Tracking Gantt stacks the currently scheduled Gantt bars on top of the baseline Gantt bars, so you can quickly see where tasks are shifting away from your original plan. The Tracking Gantt also includes percent complete labels next to each Gantt bar.
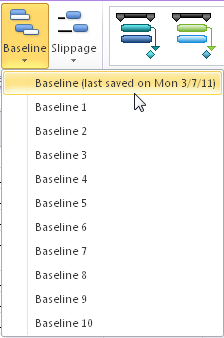
In any Gantt view, you can quickly add a baseline bar. On the Format tab, in the Bar Styles group, click Baseline, and then click the baseline whose bars you want to show, typically the first one. Any baseline you have saved shows a date saved next to its name.
To remove the baseline bars, click Format, Bar Styles, Baselines, and then click the name of the baseline.
Another way to look at whether tasks are slipping from the original plan is to show slippage lines, which are also created from baseline information. On the Format tab, in the Bar Styles group, click Slippage, and then click the baseline from which you want to show slipped tasks. It’s difficult to see slippage bars in a Gantt view that already has baseline bars applied, so choose one or the other.
To remove the slippage bars, click Format, Bar Styles, Slippage, and then click the name of the baseline.
You can highlight any late tasks in a Gantt view. On the Format tab, in the Bar Styles group, select the Late Tasks check box. The Gantt bars for any late tasks are highlighted in black.
If you’re working in a very large project, you might prefer to apply a filter to help you focus on potential problem tasks. Choose one of the following filters to highlight task progress:
Late/Overbudget Tasks Assigned To
Should Start By
Should Start/Finish By
Slipped/Late Progress
Slipping Tasks (see Figure 12-4)
Tasks With Deadlines
Tasks With Fixed Dates
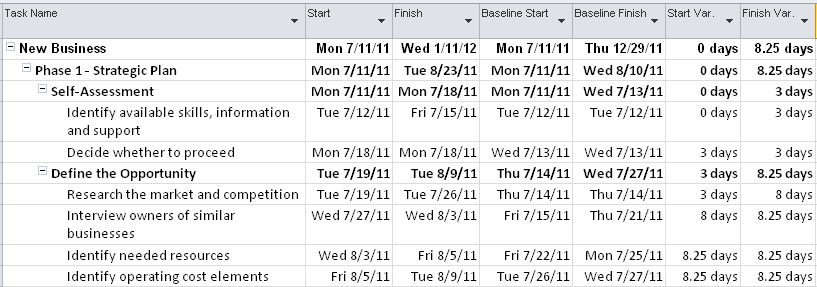
Figure 12-4. Apply the Slipping Tasks filter to quickly see which tasks are in jeopardy (the summary tasks provide context for the tasks).
To apply one of these filters, follow these steps:
Display the Gantt Chart or other task sheet you want to filter.
On the View tab, in the Data group, click the arrow in the Filter box, and then click the name of the filter.
If you don’t see the name of the filter you want, click More Filters, and then choose the filter from the More Filters dialog box.
When you want to show all tasks again, in the Filter list, click All Tasks.
You can also run text-based and visual reports that provide information about the progress of tasks, such as the following:
Unstarted Tasks
Tasks Starting Soon
Tasks In Progress
Completed Tasks
Should Have Started Tasks
Slipping Tasks
Critical Tasks Status Report (visual report in Microsoft Visio 2010)
Task Status Report (visual report in Visio 2010)
To run a text-based report, follow these steps:
On the Project tab, in the Reports group, click Reports.
Double-click the report you want.
If a dialog box asks for more information, enter the information, and then click OK.
The report appears in the Print Backstage view. You can then print the report for a closer look.
To run a visual report, follow these steps:
On the Project tab, in the Reports group, click Visual Reports.
On the All tab, double-click the name of the report you want.
The report is generated from Project 2010 data and displayed in a Visio PivotDiagram.
Note
For more information about reports, see Chapter 13.
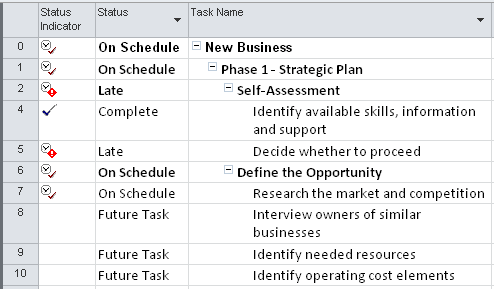
Display Status Icons
You can add the Status Indicator field to any task sheet. This field displays icons that indicate whether a task is completed, on schedule, or behind schedule.
Select the column heading next to where you want to add the Status Indicator column. On the Format tab, in the Columns group, click Insert Column. Type st in the new column that appears, and then click Status Indicator from the drop-down list.
If you prefer to show current task status as text rather than as an icon, insert the Status column instead. For every task, the status of “Future Task,” “On Schedule,” “Late,” or “Complete” appears, as shown in Figure 12-5.
You can add progress lines to your Gantt Chart that provide a graphical means of seeing whether tasks are ahead of schedule, behind schedule, or exactly on time. Progress lines are shown for tasks that have been completed, are in progress, or are currently due. They are not shown for tasks in the future.
For any given progress date, which you can set as the status date, you can have Project 2010 draw a progress line connecting in-progress tasks and tasks that should have started. (See Figure 12-6.) You can set the progress date to be the current date, the project status date, or any other date you select. You can also set multiple progress dates at recurring intervals—for example, on the first Monday of every month.
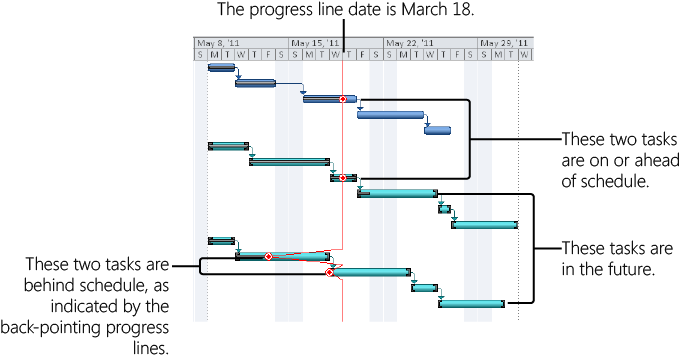
Figure 12-6. The left-pointing peaks indicate a negative schedule variance, whereas straight lines show tasks that are on or ahead of schedule as of the progress line date.
Progress lines create a graph on the Gantt Chart that provides valuable progress information, as follows:
A progress line angled to the left indicates work that’s behind schedule as of the progress line date.
A straight progress line indicates a task on schedule as of the progress line date.
Tasks untouched by the progress line are tasks scheduled to start in the future from the progress line date.
To add a progress line to a Gantt chart:
Display the Gantt Chart, Tracking Gantt, or any other Gantt view.
On the Format tab, in the Format group, click Gridlines, and then click Progress Lines.
The Progress Lines dialog box appears, as shown in Figure 12-7.
On the Dates And Intervals tab, under Current Progress Line, select the Display check box. Then select whether you want the progress line to be displayed at the project status date or the current date.
The project status date, as well as the current date, is set in the Project Information dialog box (click Project, Properties, Project Information). If no status date is set there, the current date (today) is used instead.
If you want progress lines to be drawn at regular intervals—for example, once every month—specify this under the Recurring Intervals section.
If you want progress lines to be drawn on dates that you specify, enter those dates under Selected Progress Lines.
Under Display Progress Lines In Relation To, specify whether you want progress lines to reflect the actual plan or your baseline.
Click the Line Styles tab, and then set your preferences for how you want the progress lines to appear in the Gantt Chart.
As shown in Figure 12-8, you can specify the line type and color, and the progress point shape and color for the current progress line and other progress lines.
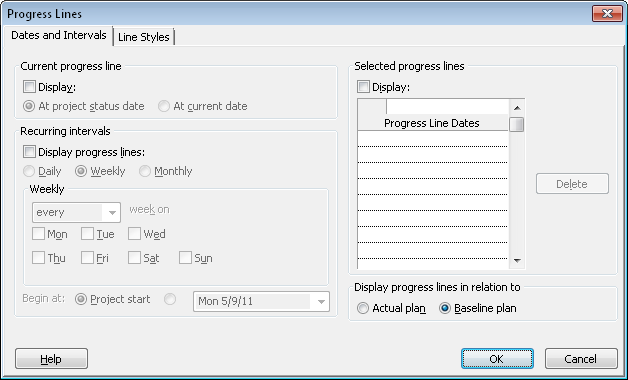
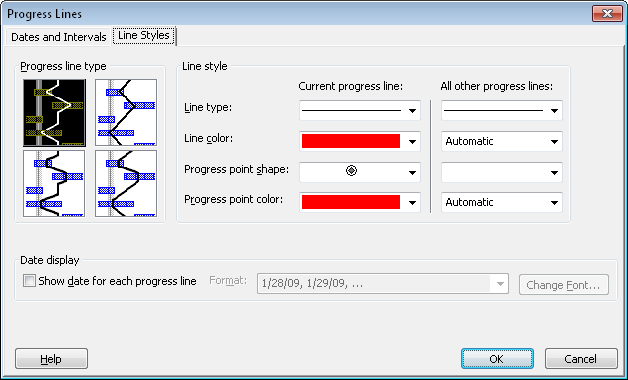
Figure 12-8. Use the Line Styles tab in the Progress Lines dialog box to customize how progress lines appear in your Gantt Chart.
If you defined progress line dates in addition to the status date or current date, you can choose to show them only when you want. For example, you might want to show progress lines in a printed view for a status meeting but hide them while updating progress. To temporarily hide progress lines:
On the Format tab, in the Format group, click Gridlines, and then click Progress Lines.
On the Dates And Intervals tab, under Current Progress Line, clear the Display check box.
The defined progress lines are removed from your Gantt Chart, but the dates remain in the Progress Lines dialog box for when you want to show them again.
You can remove one or more of your defined progress lines. To delete a progress line:
On the Format tab, in the Format group, click Gridlines, and then click Progress Lines.
Be sure the Dates And Intervals tab is showing.
Under Selected Progress Lines, select the progress line you want to remove from the Gantt Chart, and then click the Delete button.
To hide the current progress line reflecting the project status date or the current date:
On the Format tab, in the Format group, click Gridlines, and then click Progress Lines.
On the Dates And Intervals tab, under Current Progress Line, clear the Display check box.
Let’s say you reviewed your schedule details and found that your project isn’t going as quickly as planned and the finish date is in jeopardy. Or perhaps upper management has imposed a schedule change, and you need to work toward a different finish date.
If you need to take corrective actions in your project plan to bring in the scheduled finish date, you can do the following:
Check schedule assumptions—such as duration, constraints, and task dependencies—to see whether any adjustments can be made.
Add resources to recover a slipping schedule (this will likely add costs).
Cut scope to recover a slipping schedule (this will probably require stakeholder approval).
Note
For more information about using any of these techniques to adjust the schedule to meet the current or new finish date, see Bringing in the Project Finish Date.
Create a What-If Project
Suppose that an external change is being proposed or you just want to see the effect of a potential change to your project plan. You can save another version of your project plan and make the necessary adjustments to reflect the potential change. You can then examine specifically what the imposed changes will do to your project plan in terms of schedule, cost, and resource allocation.
To save a separate what-if project, first save the project to capture any recent changes. Then click File, Save As. In the File Name box, enter a name for the what-if project, and then click OK.
You can change the what-if project as much as you like because you saved it under a different file name. Your working version of the project plan remains intact, but you gain valuable information about the impact of potential changes. If you or other stakeholders decide to go ahead with the change, you can adopt the what-if project as your new working project.
With Project 2010, you can compare two projects side by side. This means you can compare your original project against your what-if project and determine what changes you might want to make. On the Project tab, in the Reports group, click Compare Projects.
Note
For more information, see Comparing Project Plans Side by Side.
New in Project 2010 is the ability to deactivate (and reactivate) tasks. Inactive tasks are removed from the schedule, but a dimmed image of their information, including their Gantt bars, remains in place. With deactivated tasks, in many cases you can have a what-if scenario within your working project. Select the task(s) you want to make inactive, and then click Task, Schedule, Inactivate. To reactivate an inactive task, select it and click Inactivate again.
When you adjust your project plan to achieve your finish date, be sure to check costs, resource allocation, and scope. You need to know how your changes affect other areas of the project plan.
You might also need to set a new baseline, especially if there have been major schedule changes.
Note
For more information on new baselines, see Need a New Baseline?.
Suppose that you and your team started executing a project a few months ago. Some tasks were completed and some were in progress when your team’s efforts were redirected to a different, urgent priority. Now you’ve all returned to the first project, ready to pick up where you left off.
What do you do with your project plan? The scheduled dates of tasks you need to work on now are two months old. Do you have to readjust all the tasks to align them with the current calendar?
No, you just need to do some rescheduling. Depending on the scale, you can:
Reschedule one or more tasks by a day, a week, a month, or whatever you want.
Reschedule any uncompleted work to start after a new project resume date.
Reschedule the entire project, even completed work.
With any of these methods, Project 2010 shifts tasks to the date you specify, and you can continue forward from there.
Note
When rescheduling on a large scale like this, you’ll benefit from setting a new baseline. Keep the old one, but use the new baseline for your everyday variance measurements.
If you just need to reschedule a few tasks, follow these steps:
Select the task(s) you want to reschedule by the same amount of time.
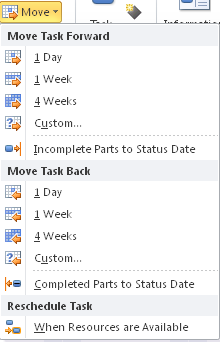
On the Task tab, in the Tasks group, click Move.
A drop-down menu provides all your task rescheduling choices, as shown in Figure 12-9.
You can move the selected tasks forward in the schedule by using one of the choices under Move Task Forward. You can move any incomplete parts of the selected tasks to the status date (or today’s date) by using Incomplete Parts To Status Date.
You can move the selected tasks backward in the schedule, which is useful if you find you need to “crash” the schedule and greatly accelerate the project finish date. This is also useful if you need to move a set of tasks all at once, or if you’re scheduling from the finish date. Use one of the choices under Move Task Back. You can move any completed parts of the selected tasks to the status date (or today’s date) by using Completed Parts To Status Date.
You can move tasks to wherever they need to be to resolve resource overallocations by using the When Resources Are Available command under Reschedule Task. This operation is essentially the same as using Prevent Overallocations in the Team Planner or leveling selected tasks. An amount of leveling delay is added to tasks as necessary to resolve resource overallocations based on task priority, ID, and other factors in the leveling “engine.”
Click the rescheduling choice you want for the selected task(s).
The tasks are rescheduled. If the tasks had any actual progress reported on them, the actuals remain at the dates they took place, and the uncompleted parts of the task are split and moved forward or backward as you specified.
To reschedule uncompleted tasks to resume work after a certain date, follow these steps:
Open a task sheet. If you want to reschedule only certain tasks, select those tasks.
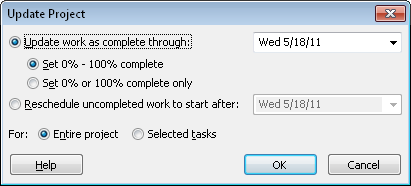
On the Project tab, in the Status group, click Update Project.
The Update Project dialog box appears, as shown in Figure 12-10.
Select the option labeled Reschedule Uncompleted Work To Start After.
In the box, enter the date when you want uncompleted work to start again.
By default, today’s date appears.
If you want to reschedule only selected tasks, click the Selected Tasks option. Otherwise, all uncompleted work is rescheduled to start after your specified date.
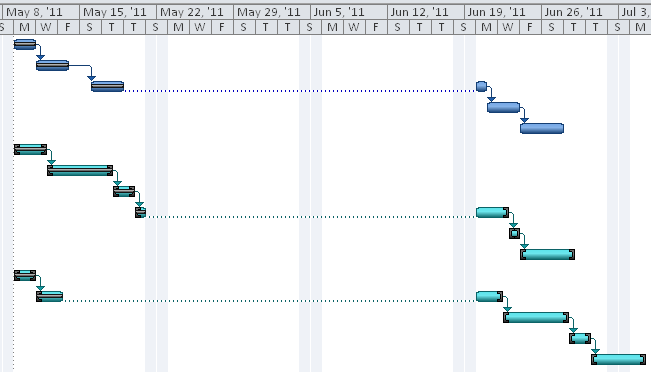
The remaining work on tasks is rescheduled to resume after the new start date you specify, as shown in Figure 12-11.
By default, any tasks that were in progress are split so that remaining work is scheduled after the date you specify. If you don’t want in-progress tasks to be split, click File, Options, and then click Schedule in the left pane. Under Scheduling Options For This Project, clear the check box labeled Split In-Progress Tasks.
Any uncompleted tasks that have a date constraint (such as Must Start On or Finish No Earlier Than) are not rescheduled, which preserves the constraint and gives you the option of deciding how to handle it.
You can enter any date you want for rescheduling, even one in the past. If a task is in progress, the date does need to be after the task’s existing stop date or actual start date.
Manually scheduled placeholder tasks that don’t have any start date information are not affected by the reschedule. That is, if a placeholder task includes only a duration or finish date, or no schedule information at all, it does not change. If it includes a start date, that start date is moved to the reschedule date. This is true even after entering actuals for these placeholders.
To reschedule everything, even completed tasks or other tasks with actuals on them, follow these steps:
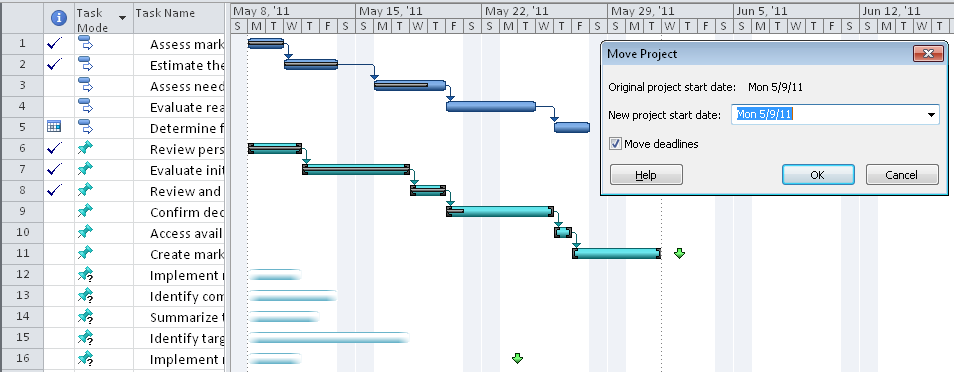
On the Project tab, in the Schedule group, click Move Project.
If any tasks are completed or have other actuals reported on them, an alert message appears. Click Yes to continue with the reschedule operation.
The Move Project dialog box appears showing the original project start date. (See Figure 12-12.)
In the New Project Start Date box, enter the new date, and then click OK.
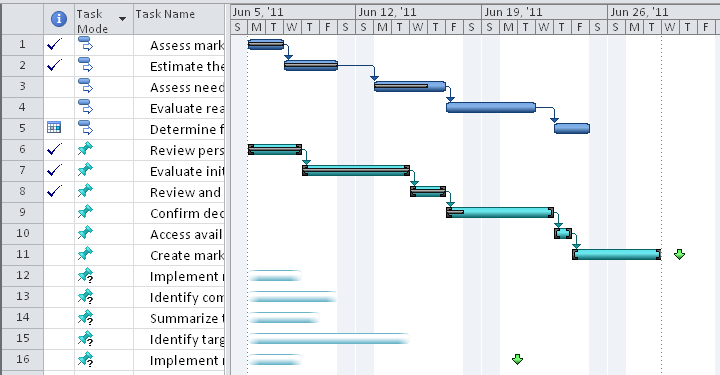
All tasks in the project shift to the new start date, as shown in Figure 12-13.
If there were deadlines in the project, and if the Move Deadlines check box is selected per the default, those deadlines also move in relation to the new start date.