 Building a Custom Report
by Teresa S. Stover, Bonnie Biafore, and Andreea Marinescu
Microsoft® Project 2010 Inside Out
Building a Custom Report
by Teresa S. Stover, Bonnie Biafore, and Andreea Marinescu
Microsoft® Project 2010 Inside Out
- Microsoft® Project 2010 Inside Out
- SPECIAL OFFER: Upgrade this ebook with O’Reilly
- A Note Regarding Supplemental Files
- Introduction
- I. Project Fundamentals
- 1. Introducing Microsoft Project 2010
- 2. Understanding Projects and Project Management
- II. Developing the Project Plan
- 3. Starting a New Project
- Getting from Idea to Proposal to Project
- Focusing the Project Vision
- Creating a New Project Plan
- Entering Tasks
- Sequencing and Organizing Tasks
- Organizing Tasks into an Outline
- Setting Up Your Work Breakdown Structure
- Adding Supplementary Information to Tasks
- 4. Viewing Project Information
- Understanding Project Information Categories
- Accessing Your Project Information
- Switching Between Views
- Using Views
- Scheduling with Gantt Charts
- Highlighting Tasks with the Timeline
- Flowcharting with Network Diagrams
- Visualizing the Project with the Calendar
- Reviewing Assignments with the Team Planner
- Charting Team Availability with the Resource Graph
- Tabling with Sheet Views
- Timesheeting with Usage Views
- Seeing Details with Forms
- Cross-Referencing with Combination Views
- Using Tables
- Using Fields
- Arranging Your Project 2010 Window
- Navigating to a Specific Location in a View
- Rearranging Your Project Information
- 5. Scheduling Tasks Manually or Automatically
- 6. Building Your Schedule
- 7. Setting Up Resources in the Project
- Understanding the Impact of Resources in the Plan
- Adding Resources to the Project
- Removing a Resource from the Project
- Identifying Tentative, Generic, or Budget Resources
- Setting When Resources Are Available for Work
- Adding Detailed Resource Information
- 8. Assigning Resources to Tasks
- Assigning Work Resources to Tasks
- Assigning Material Resources to Tasks
- Assigning Cost Resources to Tasks
- Reviewing Assignment Information
- Changing Resource Assignments
- Contouring Resource Assignments
- 9. Planning Resource and Task Costs
- 10. Checking and Adjusting the Project Plan
- Working with the Critical Path and Critical Tasks
- Controlling Schedule Changes with Task Types
- Bringing in the Project Finish Date
- Reducing Project Costs
- Balancing Resource Workloads
- Changing Project Scope
- Reviewing the Impact of Changes
- Obtaining Buyoff on the Project Plan
- 3. Starting a New Project
- III. Tracking Progress
- 11. Setting a Baseline and Updating Progress
- Saving Original Plan Information Using a Baseline
- Updating Task Progress
- Updating Actual Costs
- 12. Responding to Changes in Your Project
- 11. Setting a Baseline and Updating Progress
- IV. Reporting and Analyzing Project Information
- 13. Reporting Project Information
- Establishing Your Communications Plan
- Using Views to Report Project Information
- Generating Text and Visual Reports
- Generating the Right Reports
- Summarizing with Overview Reports
- Focusing on Tasks with Schedule Progress Reports
- Using the Unstarted Tasks Report
- Using the Tasks Starting Soon Report
- Using the Tasks In Progress Report
- Using the Completed Tasks Report
- Using the Should Have Started Tasks Report
- Using the Slipping Tasks Report
- Using the Baseline Report in Visio
- Using the Baseline Work Report in Excel
- Using the Task Status Report in Visio
- Using the Budget Work Report in Excel
- Analyzing Budget Status with Cost Reports
- Using the Cash Flow Report
- Using the Cash Flow Report in Excel
- Using the Cash Flow Report in Visio
- Using the Baseline Cost Report in Excel
- Using the Budget Report
- Using the Budget Cost Report in Excel
- Using the Resource Cost Summary Report in Excel
- Using the Overbudget Tasks Report
- Using the Overbudget Resources Report
- Using the Earned Value Report
- Using the Earned Value Over Time Report in Excel
- Evaluating Resource Allocation with Assignment Reports
- Using the Who Does What Report
- Using the Who Does What When Report
- Using the To-Do List
- Using the Overallocated Resources Report
- Using the Resource Availability Report in Visio
- Using the Resource Work Availability Report in Excel
- Using the Task Usage Report
- Using the Resource Usage Report
- Using the Resource Work Summary Report in Excel
- Using the Resource Remaining Work Report in Excel
- Using the Resource Status Report in Visio
- Revising a Built-In Report
- Building a Custom Report
- Saving Project Data Fields
- Sharing Project Reports Electronically
- 14. Analyzing Progress Using Earned Value
- 13. Reporting Project Information
- V. Managing Multiple Projects
- 15. Managing Master Projects and Resource Pools
- Structuring Master Projects with Subprojects
- Consolidating Project Information
- Opening Multiple Project Files as a Set
- Sharing Resources by Using a Resource Pool
- 16. Exchanging Information Between Project Plans
- 15. Managing Master Projects and Resource Pools
- VI. Integrating Project 2010 with Other Programs
- 17. Exchanging Information with Other Applications
- 18. Integrating Project 2010 with Excel
- 19. Integrating Project 2010 with Visio
- 20. Integrating Project 2010 with Outlook
- 21. Collaborating as a Team by Using SharePoint
- Creating a Project Tasks List on a SharePoint Site
- Exchanging Project Information with SharePoint
- Synchronizing Changes Between Project and SharePoint
- Opening and Viewing Connected Project Information
- Collaborating with Team Members on Task Updates
- Assigning Tasks to Team Members
- Updating Task Progress
- Updating Task Progress in SharePoint
- Updating Task Progress in Project
- VII. Managing Projects Across Your Enterprise
- 22. Understanding Enterprise Project Management
- 23. Administering Your Enterprise Project Management Solution
- Signing In and Out
- Configuring Project Server Security
- Administering the Enterprise Resource Pool
- Establishing the Enterprise Portfolio
- Setting Up Project Workflows
- Standardizing Enterprise Project Elements
- Setting Up Team Member Work Pages
- Managing Pages, Views, and Reports
- 24. Managing Enterprise Projects and Resources
- Connecting to Your Project Server
- Working with Enterprise Projects
- Following a Project Workflow
- Building Your Enterprise Project Team
- Finding Resources to Meet Your Needs
- Building Your Project Team in Project Professional
- Building Your Project Team in Project Web App
- Identifying Resource Attributes by Using Custom Enterprise Fields
- Using Generic Resources as Placeholders
- Adding a Team Assignment Pool to Your Project Resource List
- Finding Enterprise Resources That Meet Specific Criteria
- Review Resource Assignments and Availability
- Replacing an Existing Project Resource with an Enterprise Resource
- Matching an Existing Project Resource
- Matching and Replacing Generic Resources
- Proposing Tentative Resources
- Assigning Tasks to Enterprise Resources
- Finding Resources to Meet Your Needs
- Collaborating with Your Project Team
- 25. Participating on a Team Using Project Web App
- Getting Started with Project Web App
- Working with Your Assignments
- Submitting Text-Based Status Reports
- Logging Time by Using Timesheets
- Working with Issues and Risks
- Setting Up E-Mail Reminders and Outlook Tasks
- Managing Resources in Project Web App
- 26. Making Executive Decisions Using Project Web App
- 27. Managing and Analyzing Project Portfolios
- VIII. Customizing and Managing Project Files
- 28. Customizing Your View of Project Information
- Customizing Views
- Changing the Content of a View
- Creating a New View
- Saving a View
- Changing Text Formatting in Views
- Formatting a Gantt Chart View
- Modifying the Timescale
- Modifying a Network Diagram
- Modifying the Timeline
- Modifying the Team Planner
- Modifying the Resource Graph
- Modifying the Calendar
- Modifying a Sheet View
- Modifying a Usage View
- Customizing Tables
- Customizing Fields
- Working with Outline Codes
- Customizing Groups
- Customizing Filters
- Sharing Customized Elements Among Projects
- Customizing Views
- 29. Customizing the Project 2010 Interface
- 30. Automating Your Work with Macros
- 31. Standardizing Projects by Using Templates
- 32. Managing Project Files
- Saving Project Files
- Opening Project Files
- Saving and Opening with Different File Formats
- Comparing Project Plans Side by Side
- Safeguarding Your Project Files
- 28. Customizing Your View of Project Information
- IX. Appendixes
- D. Index to Troubleshooting Topics
- E. About the Authors
- Index
- About the Authors
- SPECIAL OFFER: Upgrade this ebook with O’Reilly
You might have a specialized report requirement that none of the built-in text or visual reports fulfills. The following sections describe how to create a new text report and a new visual report from scratch.
When you create a new text report, you start with a report template that gives you the framework within which to build a good report. There are four text report templates, or report types:
Task
Resource
Monthly Calendar
Crosstab
If you’ve edited or copied any existing text reports or just looked at a report’s definition out of curiosity, you might already be familiar with some of these report types, as they form the basis for nearly all the built-in text reports.
To build a custom report, follow these steps:
On the Project tab, in the Reports group, click Reports.
In the Reports dialog box, double-click Custom.
In the Custom Reports dialog box, click New.
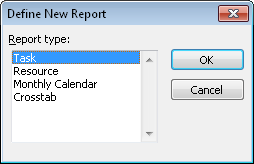
The Define New Report dialog box appears, as shown in Figure 13-28.
In the Report Type box, select the type of report you’re creating, and then click OK.
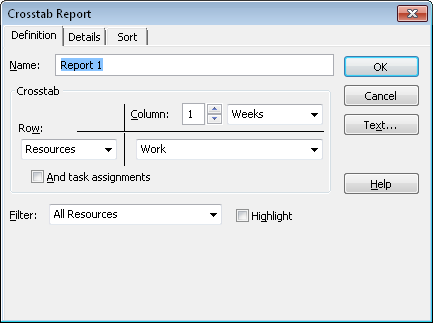
The report definition dialog box appears, as shown in Figure 13-29. The dialog box you see depends on the report type you select.
In the Name box, enter the name of your new custom report.
Be sure that it’s a unique name in the Reports list.
Define your report: Specify any fields, filters, or formatting as the report definition.
If you’re defining a task, resource, or crosstab report, also use the Details tab to specify additional information you want to add to the report. Use the Sort tab to specify which field should dictate the order of information in the report.
Make any changes you want to the report fonts by clicking the Text button.
In the Item To Change box, click the report element whose text you want to format and then specify the changes you want. When you finish, click OK.
When you are finished with your new report’s definition and changes, click OK in the report definition dialog box.
The name of your new report appears in the Reports list in the Custom Reports dialog box.
Click your new report if necessary, and then click Select to generate the report and see what it looks like in the Print Backstage view.
If you want to make further changes, click Project, Reports, Reports. Double-click Custom, click the custom report, and then click Edit.
The report definition dialog box appears again. Make the changes you want.
Your new report is saved with your project file and is available whenever you work in this particular project.
When you create a new visual report, you specify the data type, or OLAP cube, such as Task Usage or Assignment Summary. This provides the basis for the visual report, whether it is generated in Excel or Visio.
To create a visual report template from scratch, do the following:
On the Project tab, in the Reports group, click Visual Reports.
Click New Template.
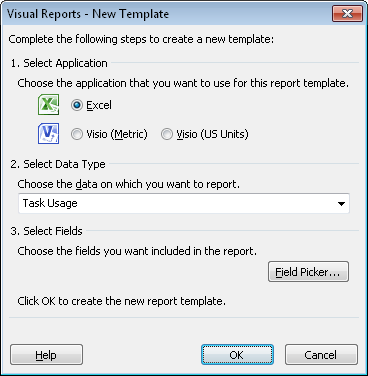
The Visual Reports - New Template dialog box appears, as shown in Figure 13-30.
Under Select Application, select Excel if you want to create an Excel chart based on a PivotTable from Project 2010 data. Select one of the Visio options if you want to create a flow diagram based on a PivotDiagram from Project 2010 data.
Under Select Data Type, choose the type of data you want to use as the basis for your report.
Visual reports are based on six different sets of information: Task Summary, Task Usage, Resource Summary, Resource Usage, Assignment Summary, and Assignment Usage. These data types determine the fields that Project 2010 adds to the OLAP cube, but you can add or remove fields, as well.
To modify the fields to be used in the template, click Field Picker, and then add or remove fields in the Available Fields list.
To add fields to the new visual report’s OLAP cube, select the fields you want from the Available Fields list, and then click Add.
To remove fields from the Selected Fields list, select the fields, and then click Remove.
Click OK in the Visual Reports - Field Picker dialog box, and then click OK in the Visual Reports - New Template dialog box.
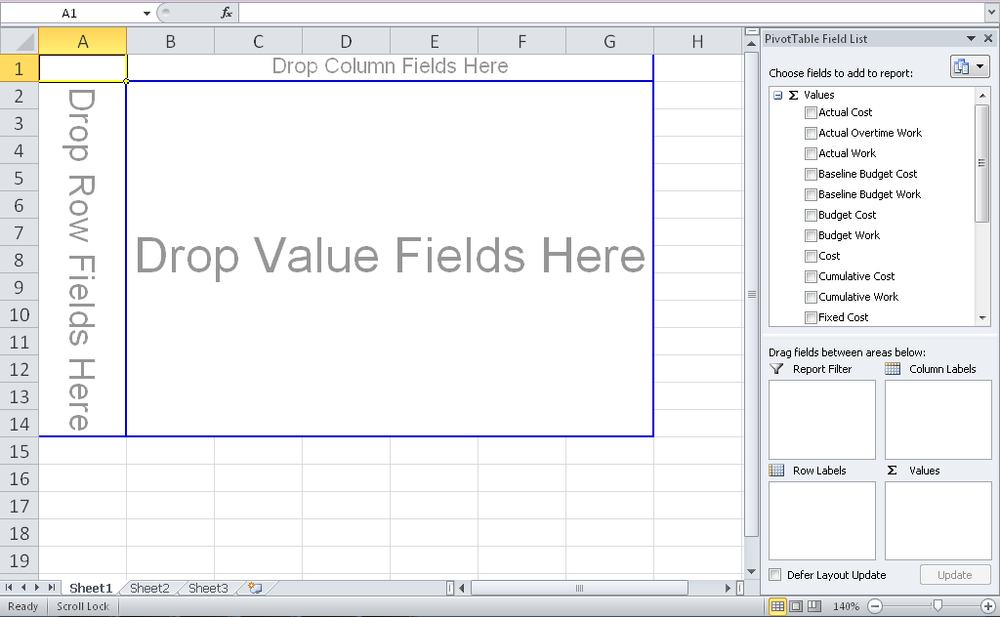
For an Excel template, Excel launches and opens a blank PivotTable, as shown in Figure 13-31.
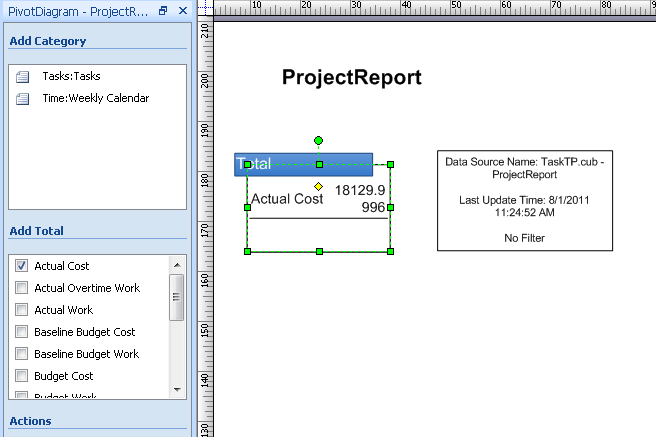
For a Visio template, Visio launches and opens a blank PivotDiagram, as shown in Figure 13-32.
Note
For details on building a new PivotTable in Excel for a Project 2010 visual report, see Creating and Editing Visual Report Templates in Excel. For details on building a new PivotDiagram in Visio for a Project 2010 visual report, see Creating and Editing Visual Report Templates in Visio.
When you have configured the PivotTable or PivotDiagram, save the template. In the Save As dialog box, be sure that the template is being saved to the folder where all the other templates are located, for example the C:Users[username]AppDataRoamingMicrosoftTemplates1033 folder.
Saving the template in this folder ensures that the template appears in the Visual Reports - Create Reports dialog box.
If you save the template in a location other than the default Microsoft templates folder, you can still have it included in the list of visual reports. On the Visual Reports - Create Report dialog box, select the check box labeled Include Report Templates From, click the Modify button, and then browse to the location of your new template. Select the template, and then click OK.
Make New or Changed Reports Available to Other Projects
When you change or create new text reports, they exist only within the current project file. If you want your changed or newly created text reports to be present in all your project files, use the Organizer to copy those reports from your current project to your global.mpt project template.
You can go the other direction as well. If you changed a built-in text report and want to return to the original default report, you can copy it from global.mpt back into the project file.
The Organizer is readily available in the Custom Reports dialog box, as follows:
On the Project tab, in the Reports group, click Reports.
Double-click Custom.
In the Custom Reports dialog box, click Organizer.
The Reports tab in the Organizer dialog box opens.
Note
For more information about copying project elements between an individual project file and the global.mpt project template by using the Organizer, see Sharing Customized Elements Among Projects.
When you change or create a new visual report, its Excel or Visio template is saved as a separate file. These reports are therefore available to any project file without your needing to use the Organizer.
-
No Comment