Chapter 9. Integrating with partners
A SIEM usually aggregates data from multiple data sources, and these data sources are not necessarily part of a single vendor; in fact, these data sources are from different vendors and different solutions that are part of the organization’s IT ecosystem. For this reason, it is imperative for the SIEM solution to be flexible and enable you to ingest data from different vendors. In addition to the native data connectors available for Microsoft solutions in Azure Sentinel, there are also a set of built-in connectors for partner solutions.
In this chapter, you will learn more about integrating Azure Sentinel with Fortinet, Amazon AWS, and Palo Alto.
Connecting with Fortinet
Azure Sentinel has native integration with Fortinet and allows you to connect with Fortinet Fortigate appliances for data ingestion. Before starting the configuration, make sure to review the following prerequisites:
FortiOS 5.6.0 or later (CEF support was added)
Linux OS support for the Log Analytics Agent (https://aka.ms/ASB/LinuxAgent)
Once you meet those prerequisites, you can start the implementation. Follow these steps to connect Azure Sentinel with Fortinet:
Deploy a virtual machine in the cloud or on-premises to host the Linux agent, using one of the supported operating systems. In these steps, we will use an Unbuntu 16.04 server image.
Tip
SYSLOG CEF messages are sent in clear text over UDP 514. Some systems support TCP 514 and even TLS. If you deploy a VM in the cloud with a public IP, ensure that you, at a minimum, use a Network Security Group (NSG) to limit source IP addresses that can send messages to the Linux CEF Collector.
Open the Azure Portal and sign in as a user who has Azure Sentinel Contributor privileges.
In the search pane, type Azure Sentinel and click the Azure Sentinel icon when it appears.
Select the workspace on which Azure Sentinel is enabled.
Click Data Connectors.
Scroll down and select the Fortinet connector. Click Open Connector Page.
Scroll down to step 1.2 and copy the text in the Run the following command to install and apply the CEF collector box. Figure 9-1 shows the data connector screen.
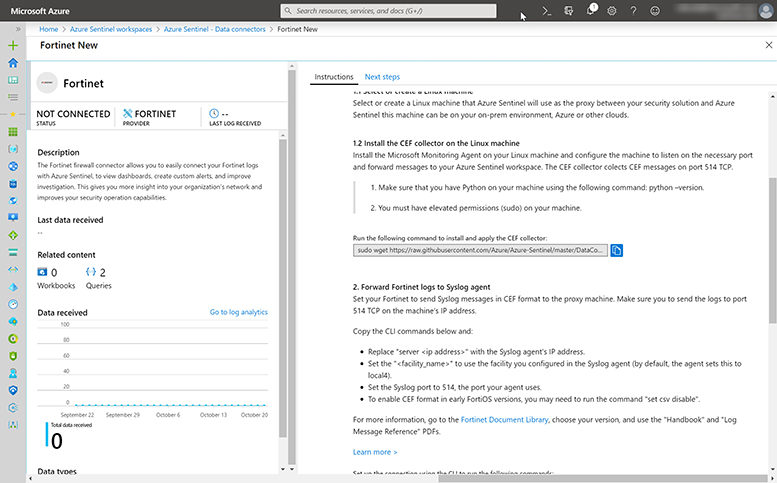
FIGURE 9-1 Azure Sentinel Fortinet connector page Log in to the Linux VM using your preferred terminal tool; for this example, we are using Putty.
Paste the command to install the CEF collector, as shown in Figure 9-2.
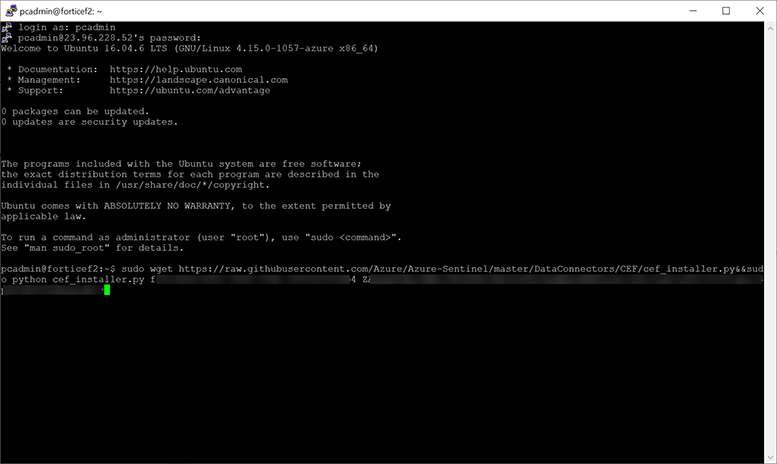
FIGURE 9-2 Pasting the command to install the CEF collector Once the installation finishes, you should see an output similar to Figure 9-3.
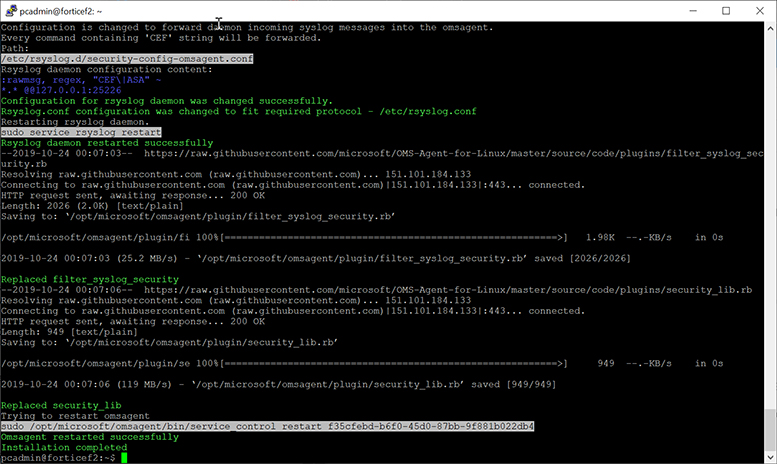
FIGURE 9-3 Post-installation output Now that the agent is installed on the CEF collector, you need to configure Foritgate.
Log in to Fortigate using your preferred terminal tool.
Type the following commands, and see the example shown in Figure 9-4.
config log syslogd setting
set status enable
set format cef
set port 514
set server <ip_address_of_Receiver>
end
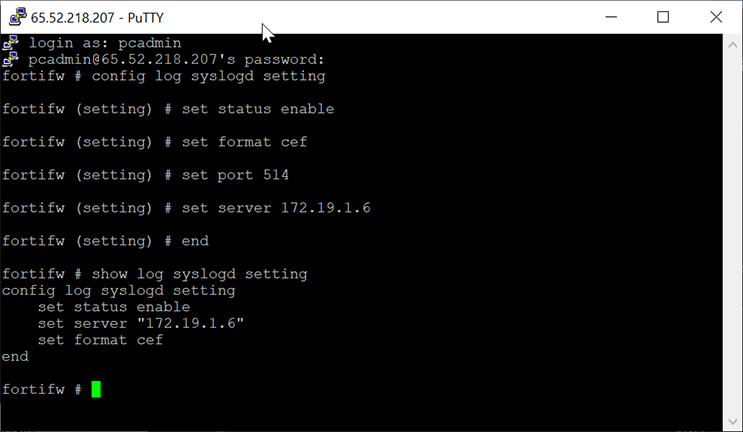
FIGURE 9-4 CEF configuration Fortigate is now configured to send data to the CEF collector.
Validating connectivity
Now that you have configured your connector, the next step is to validate the connectivity and make sure that the flow between your device and Azure Sentinel is working properly. Follow the steps below to validate this configuration:
Open the Azure Portal and sign in as a user who has Azure Sentinel Contributor privileges.
In the search pane, type Azure Sentinel and click the Azure Sentinel icon it when it appears.
Select the workspace on which Azure Sentinel is enabled.
Click Data Connectors.
Scroll down and select the Fortinet connector. In Figure 9-5, you can see several indicators that data is connected.
You can see the Fortinet connector in the list has a green status bar to its left.
You can see the Status is listed as CONNECTED.
You can see when the last log was received.
Lastly, you can see a histogram of data and a total number of data received in the status blade.
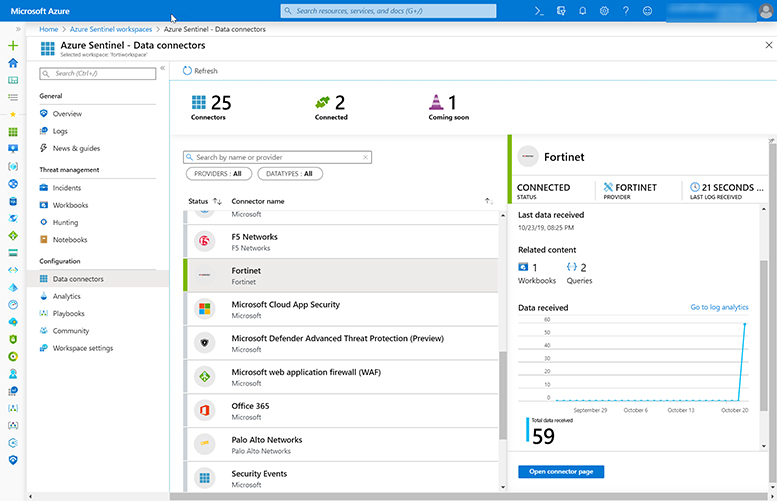
FIGURE 9-5 Azure Sentinel Data connector page Click Logs in the left blade under General.
Enter CommonSecurityLog | where DeviceProduct == “Fortigate” in the query window and select Run. Figure 9-6 shows the results, and you can see the data has been ingested.
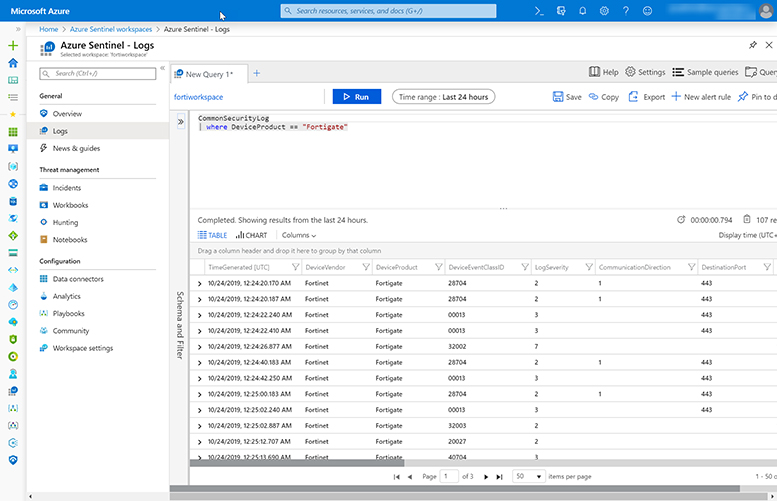
FIGURE 9-6 Querying data generated by the connector If data is not showing up in the data connector or query, you can run a troubleshooting script.
Click Data Connectors.
Scroll down and select the Fortinet connector. Click Open Connector Page.
Scroll down to step 1.2 and copy the text in the Run the following command to validate your connectivity box. Figure 9-7 shows the data connector screen.
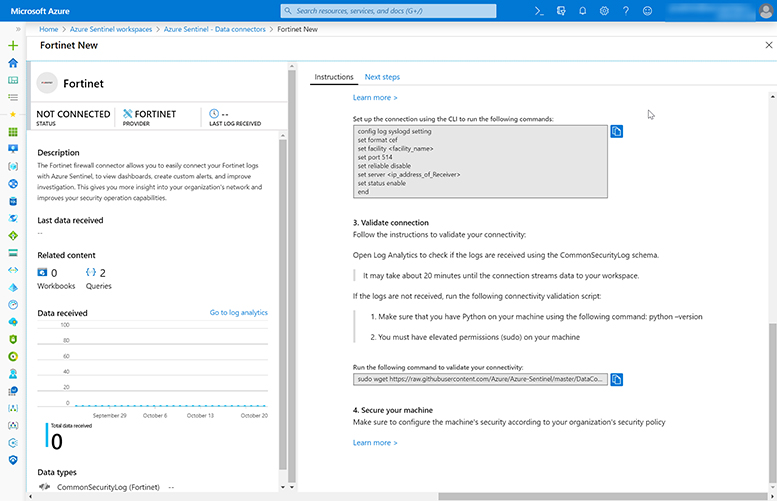
FIGURE 9-7 Command to validate the connectivity Log in to the Linux VM.
Paste the command to run the troubleshooting script, as shown in Figure 9-8.
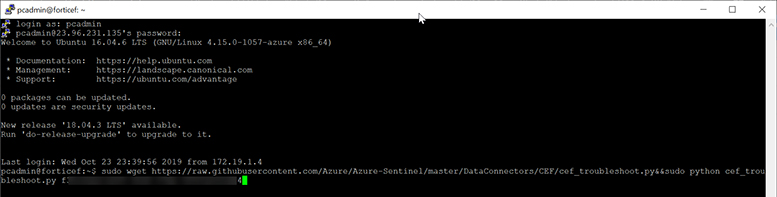
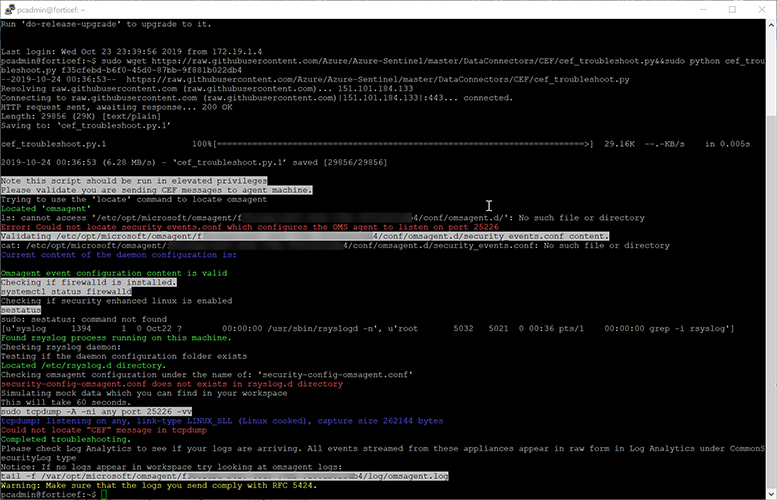
FIGURE 9-8 Validating the connectivity Note, this machine was not configured for CEF collection. Figure 9-9 shows some errors in the validation script because of misconfigurations.
Connecting with Amazon Web Services (AWS)
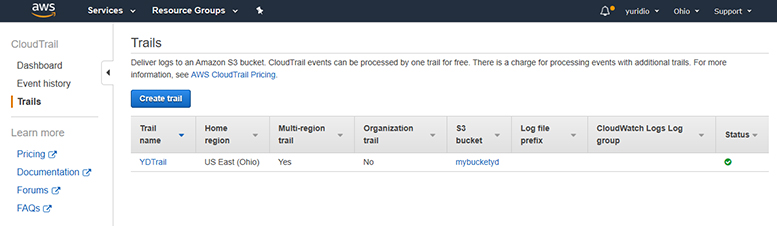
Azure Sentinel has a connector dedicated to AWS; this connector enables you to ingest all AWS CloudTrail events into Azure Sentinel. The AWS CloudTrail enables ongoing delivery of events as log files to an Amazon S3 bucket that you specify during the creation of the cloud trail. If you have a CloudTrail already configured, you should see the trail name and settings in the AWS portal, as shown in Figure 9-10.
The AWS data connector works by establishing a trust relationship between AWS CloudTrail and Azure Sentinel. For this trust to happen, you will need to create a role in AWS that gives permission to Azure Sentinel to access the AWS logs. You will also need the following information:
Workspace ID that is used by Azure Sentinel. This information is available in the AWS connector page in Azure Sentinel.
Microsoft Account ID, which is available on the AWS Connector. This information will be required during the configuration of the AWS Role.
Follow these steps to configure this role in AWS:
Log in to your AWS Portal using an account that has privileges to create new roles.
In the main dashboard, click Services.
Under the Security, Identity & Compliance option, click IAM, as shown in Figure 9-11.
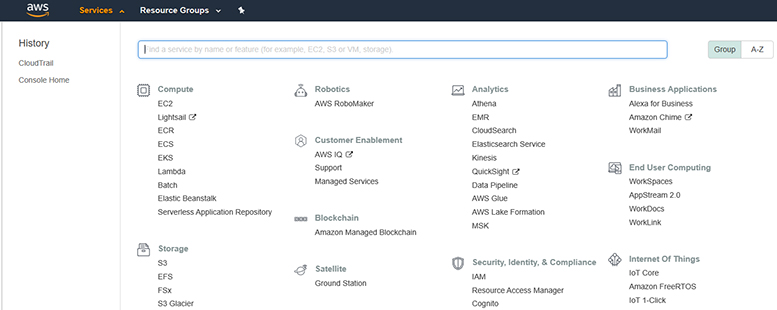
FIGURE 9-11 Accessing the identity and access management to create a role In the left navigation pane, click Roles and click the Create role button, as shown in Figure 9-12.
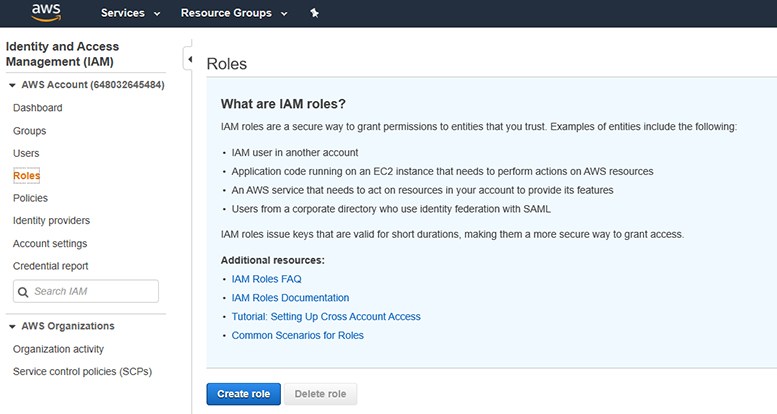
FIGURE 9-12 Creating a new role in AWS In the Create role page, click Another AWS account, as shown in Figure 9-13.
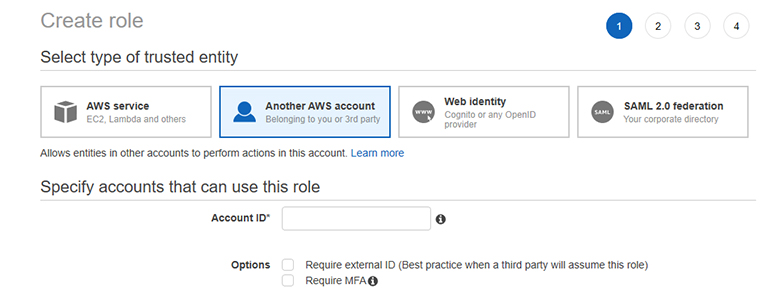
FIGURE 9-13 Creating a role in AWS that is based on another AWS account Notice that the Account ID is the first information it requests. This Account ID is available in your Azure Sentinel AWS Connector. Leave this page open, go to Azure Sentinel, click Data Connectors, open the Amazon Web Services connector, and take note of the Microsoft Account ID under the Configuration section, as shown in Figure 9-14.
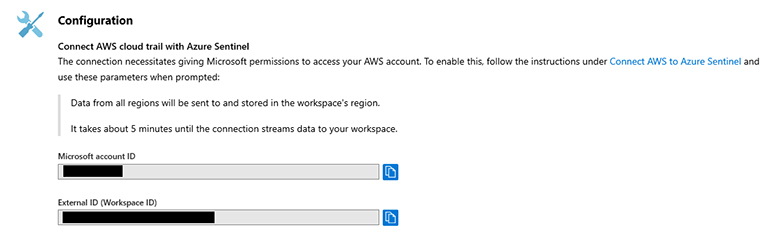
FIGURE 9-14 AWS Connector in Azure Sentinel Copy the Microsoft Account ID, and while you are there, also make a record of the External ID (Workspace ID) number.
Go back to the AWS page in step 5 and paste the Microsoft Account ID in the Account ID field.
Select the option Require External ID (Best Practice When A Third Party Will Assume This Role) and paste the External ID (Workspace ID) that you copied in step 7. Click the Next: Permissions button to proceed.
Under Attach permissions policies, select AWSCloudTrailReadOnlyAccess, as shown in Figure 9-15.
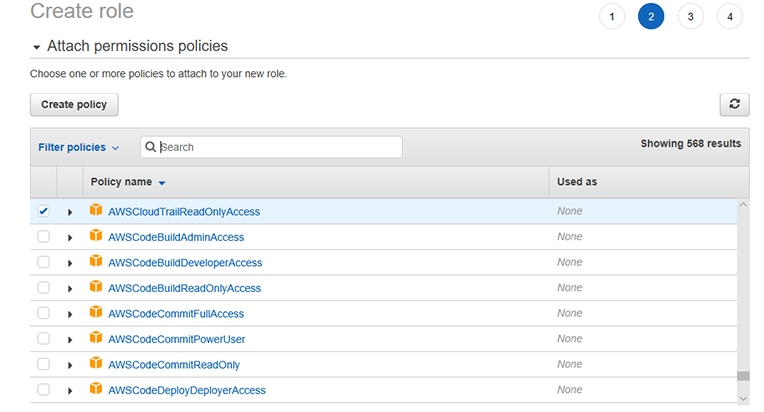
FIGURE 9-15 Selecting the role for this account Click the Next: Tags button and click the Next: Review button; the final Review page appears, as shown in Figure 9-16.
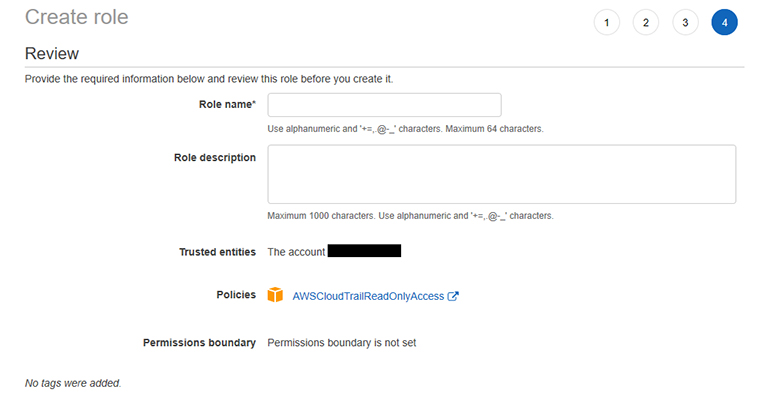
FIGURE 9-16 Final Review page For the Role Name, type AzureSentinelBook and click the Create Role button. At this point, you should see a confirmation page similar to the one shown in Figure 9-17.
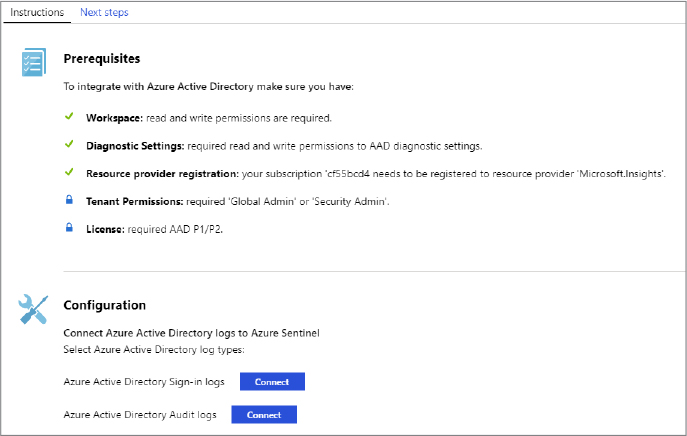
FIGURE 9-17 Confirmation of the role creation in AWS In the Role Name table, click the role you created—AzureSentinelBook—and the summary of the role appears, as shown in Figure 9-18.
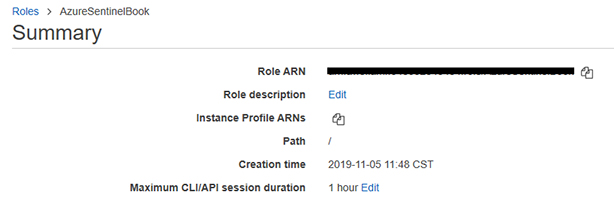
FIGURE 9-18 Properties of the role you created Copy the Role ARN.
Open Azure Sentinel, click Data Connectors, and click Amazon Web Services.
Under Configuration, paste the Role ARN in the Role to add field, and click the Add button, as shown in Figure 9-19.
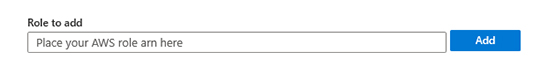
FIGURE 9-19 Adding the Amazon Resource Name Once you add, you should see the ROLE ARN included in the table; the date for the last received event will be populated once it starts to sync. Also, your AWS connector should turn green to reflect that the connector is configured, as shown in Figure 9-20.
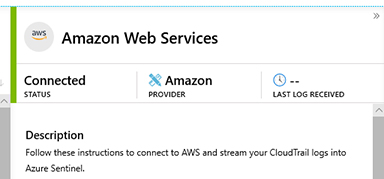
FIGURE 9-20 AWS connector page showing the status of the connection
Validating connectivity
Now that you configured your connector, the next step is to validate the connectivity and make sure that the flow between AWS CloudTrail and Azure Sentinel is working properly. You might notice that the main Azure Sentinel dashboard automatically creates an entry for AWS CloudTrial once it starts to receive data via the connector, as shown in Figure 9-21.
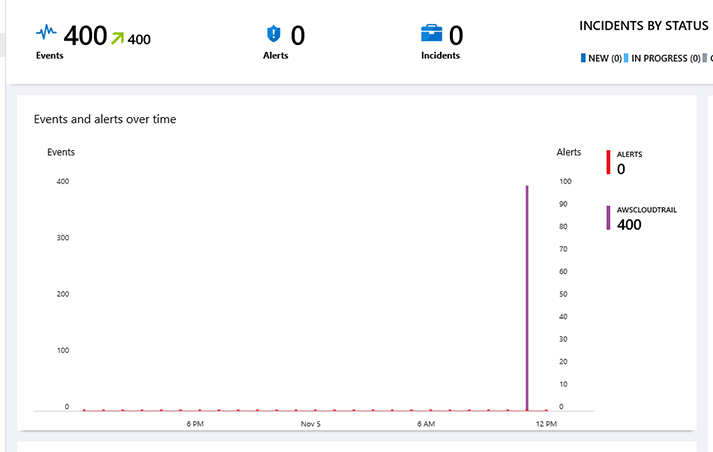
You can access the data that was sent from AWS CloudTrail to Azure Sentinel by simply clicking the AWSCLOUDTRAIL option shown in Figure 9-21. When you do this, Azure Sentinel will open the Log Analytics workspace, with the AWSCloudTrail query, as shown in Figure 9-22.
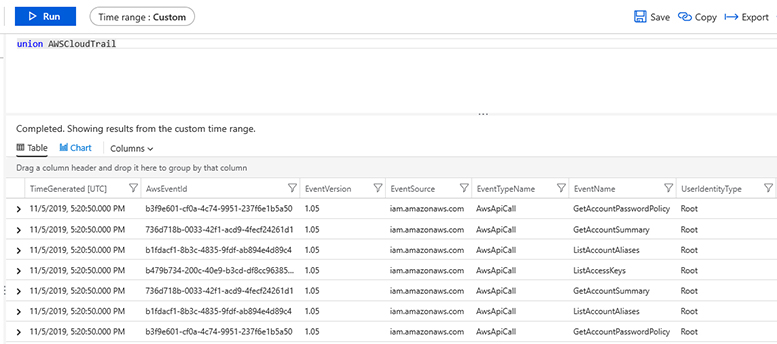
This test is validating the data flow from your AWS Cloud Trail to Azure Sentinel.
Connecting with Palo Alto
Azure Sentinel comes with a pre-built connector for Palo Alto Networks firewalls. The connector works for both on-premises firewalls and those hosted in the cloud. At a high level, you will need to complete two primary steps to make the connection work. The first step is to set-up a Syslog collector. To do this, you will run a Microsoft-provided script that installs the Log Analytics agent and configures it to listen for Syslog messages on port 514 and sends the CEF messages to your Azure Sentinel workspace. The second step is to configure the Palo Alto Networks firewall to forward the CEF-formatted Syslog messages to the proxy machine. To use TLS communication between the firewall and the proxy machine, you will need to configure the Syslog daemon (rsyslog or syslog-ng) to communicate in TLS.
Figure 9-23 shows the high-level architecture for connecting an on-premises Palo Alto Networks firewall to Azure Sentinel.
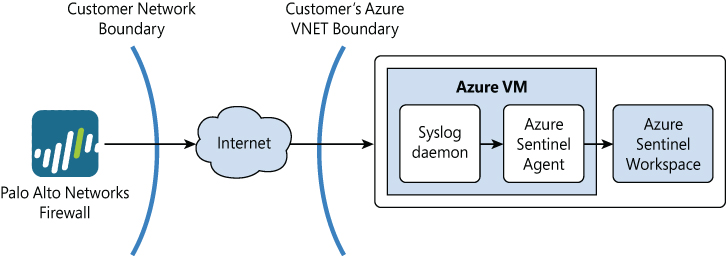
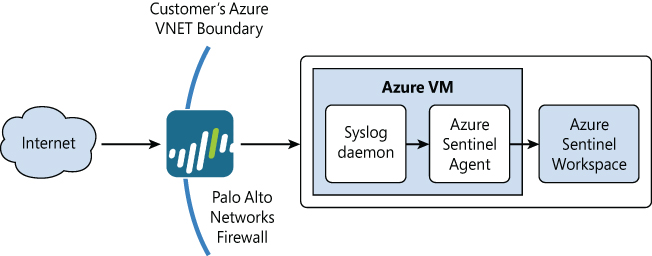
Figure 9-24 shows the architecture for connecting a Palo Alto Networks firewall hosted in Azure to Azure Sentinel.
To connect a Palo Alto Networks firewall, you will need to make sure the following pre-requisites are met:
Access to an Azure Sentinel account with read and write permissions to the supporting workspace
Administrative access to a Linux machine from one of the options below:
64-bit operating systems
CentOS 6 and 7
Amazon Linux 2019.09
Oracle Linux 6 and 7
Debian GNU/Linux 8 and 9
Ubuntu Linux 14.04 LTS, 16.04 LTS and 18.04 LTS
SUSE Linux Enterprise Server 12
32-bit operating systems
CentOS 6
Oracle Linux 6
Red Hat Enterprise Linux Server 6
Debian GNU/Linux 8 and 9
Ubuntu Linux 14.04 LTS and 16.04 LTS
The Linux machine chosen must also include one of the following syslog daemon versions:
Syslog-ng: 2.1-3.22.1
Rsyslog: v8
Syslog RFCs supported
Syslog RFC 3164
Syslog RFC 5424
Once you meet the prerequisites above, you can start the implementation. For the following steps, we will be connecting a Palo Alto Networks firewall hosted in Azure with Azure Sentinel; reference the architecture shown in Figure 9-24. Complete the following steps:
Deploy a Virtual Machine in Azure as your syslog collector. The virtual machine will host the Log Analytics agent. In the following steps, we will also use an Unbuntu 16.04 server image for our proxy machine.
Tip
SYSLOG CEF messages are sent in clear text over UDP 514. Some systems support TCP 514, and TLS and should be leveraged for a more secure and reliable connection. If you deploy a VM in the cloud with a public IP, make sure you a use a Network Security Group (NSG) to limit the source IP addresses that can send to the Linux CEF Collector.
Open the Azure Portal and sign in as a user who has Azure Sentinel Contributor privileges.
In the search pane, type Azure Sentinel and click on the Azure Sentinel logo when it appears.
Select the workspace on which Azure Sentinel has been enabled.
Click Data Connectors.
Scroll down and select the Palo Alto Networks connector. Click Open Connector Page.
Scroll down to step 1.2 and copy the text in the Run the following command to install and apply the CEF collector box. Microsoft also provides a button next to the script that when clicked will automatically copy the script to your clipboard. Figure 9-25 shows step 1.2 for the Palo Alto Networks connector:
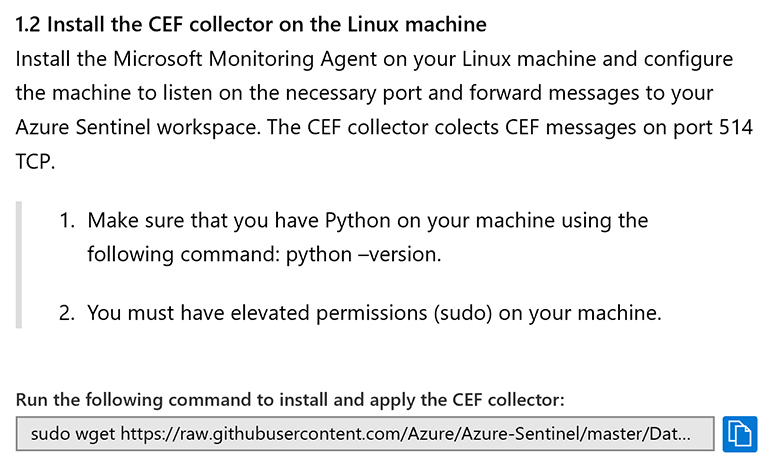
FIGURE 9-25 A step from the Azure Sentinel Palo Alto Networks firewall data connector page Log in to the Linux VM using your preferred terminal tool.
Paste the command to install the Log Analytics agent that you previously copied to your clipboard. Ensure you are running the script with administrator privileges.
Now that the agent is installed on the proxy machine, you need to configure the Palo Alto Networks firewall to forward the logs to the proxy machine in CEF format. You can do that by following Step 2 on the Azure Sentinel documentation page for the connector at https://docs.microsoft.com/en-us/azure/sentinel/connect-paloalto.
Log in to the Palo Alto Networks firewall and complete all of the instructions found at https://docs.paloaltonetworks.com/resources/cef.
Next, go to https://docs.paloaltonetworks.com/pan-os/8-1/pan-os-admin/monitoring/use-syslog-for-monitoring/configure-syslog-monitoring and complete steps 2 and 3. Be sure to set the Syslog server format to BSD, which is the default setting.
Validating connectivity
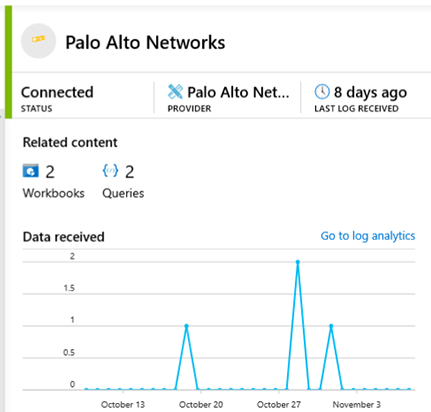
One of the easiest ways to validate the connectivity of your Palo Alto Networks firewall is via the Data connectors blade. Select the Palo Alto Networks data connector and you will get a detailed tile that includes the status of the connection, provider, and date of the last logs received. The tile also includes a time series chart showing data ingestion volumes by date. In the Figure 9-26 below, you can see that the status is listed as Connected and that the last log was received eight days ago.
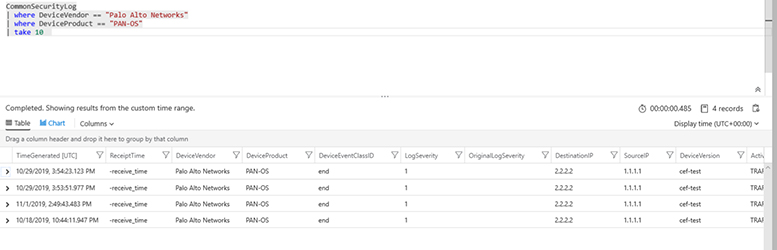
You can also validate the connection by navigating to query page and running the following KQL query:
CommonSecurityLog
| where DeviceVendor == “Palo Alto Networks”
| where DeviceProduct == “PAN-OS”
| take 10
This query will return 10 log records from the Palo Alto Networks firewall. My results are shown in Figure 9-27. Note that it can take up to 20 minutes for logs to appear in Azure Sentinel after the Palo Alto Networks firewall is first connected.