Chapter 4. Incident management
Microsoft’s approach to security incident management is based on National Institute of Standards and Technology (NIST) Special Publication (SP) 800-61. Microsoft has several teams that work together to prevent, monitor, detect, and respond to security incidents. Azure Sentinel leverages Microsoft’s knowledge of incident management to incorporate built-in capabilities that will assist Security Operation Centers (SOCs) to manage their incidents in a seamless way from the same dashboard.
In this chapter, you will learn more about incident management in Azure Sentinel and how to leverage this capability to quickly address new security incidents.
Introduction to incident management
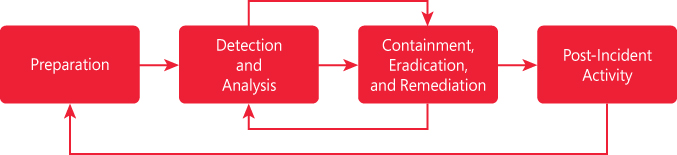
Before we dive into incident management in Azure Sentinel, it is important to ensure you understand the incident management lifecycle. An incident lifecycle based on a Microsoft approach is comprised of the phases shown in Figure 4-1.
Tip
For more information on how Microsoft investigates, manages, and responds to security incidents within Azure, read this paper: http://aka.ms/asbook/iminthecloud.
The first phase in the diagram shown in Figure 4-1 refers to the organizational preparation; in other words, this is what tools, processes, competencies, and readiness need to be in place even before an incident happens. The second phase (Detection and Analysis) refers to the activity to detect a security incident and start analyzing the data to confirm the authenticity and severity of the incident. The third phase (Containment, Eradication, and Remediation) focuses on the appropriate actions that should be taken to contain the security incident based on the analysis that was performed in the previous phase. As you can see in Figure 4-1, there is a cycle between Detection and Analysis and Containment, Eradication, and Remediation; this happens because sometimes additional analysis may need to be done to fully remediate the security incident. The last phase (Post-Incident Activity) focuses on post-mortem analyses that are performed after the remediation of a security incident. The lessons learned from this phase should drive changes to phase one (Preparation).
When using Azure Sentinel for incident management, you can cover tasks from phases two and three of the lifecycle shown in Figure 4-1. The list below shows some examples of built-in capabilities that can assist SOC analysts in these phases:
Detection and Analysis: You can use Analytics in Azure Sentinel to create custom alerts that will create an incident once it detects a malicious activity. Once an incident is opened, you can investigate an incident to obtain more details about the malicious activity.
Containment, Eradication, and Remediation: After investigating an incident, you can create playbooks to run and automate your remediation steps. This can also be useful for containment; for example, this would be useful for isolating a VM that has been compromised.
Security incident in Azure Sentinel
In Azure Sentinel, an incident can include one or multiple alerts. An incident contains a combination of the relevant evidences that can be used for further investigation. An incident is created based on alerts you defined on the Analytics page, which can be the ones you customized, or they can be based on first-party analytics from Microsoft Cloud App Security, Azure Security Center, Azure Advanced Threat Protection, or Azure Active Directory Identity Protection. In Chapter 3, “Analytics,” you learned how to create custom alerts, and by now, you should already have an incident that was triggered based on the actions taken in Chapter 3. While creating an analytic, you established some properties that directly affect how the alert will be surfaced in the incident dashboard.
Follow these steps to access the Incident dashboard and familiarize yourself with the options available there:
Open Azure Portal and sign in with a user who has contributor privileges in the subscription on which the Azure Sentinel workspace resides.
Click All Services, type Sentinel, and click the Azure Sentinel icon when it appears, as shown in Figure 4-2.
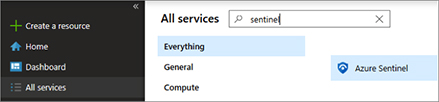
FIGURE 4-2 Accessing Azure Sentinel in Azure Portal In the left navigation pane, click Incidents in the Threat Management section; the Incidents dashboard appears, as shown in Figure 4-3.
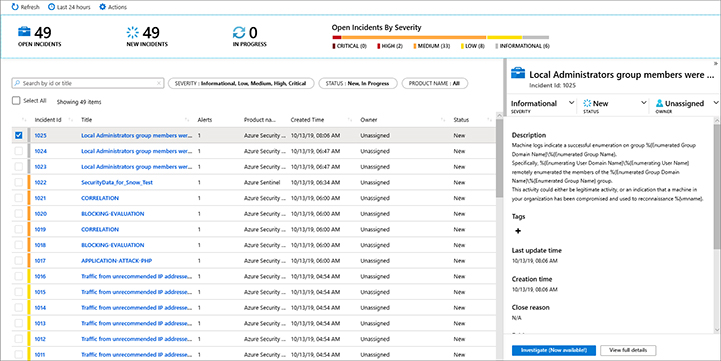
FIGURE 4-3 Azure Sentinel incidents page
By default, the list of incidents shown in this dashboard are based on the last 24 hours, but if you need to see a different range, you can click in the Last 24 Hours button and customize the time range. At the top of the dashboard, you can see the number of incidents that were opened, the number of new incidents, and the incidents that are in progress. Further right, a graph that represents the open incidents organized by severity level (Critical, High, Medium, Low, and Informational) appears. Under this status bar, the filtering bar enables you to search by Incident Identification (ID) or Title. In the same bar, you also have the capability to filter by Incident Severity or Status (New, In Progress, or Closed).
The lower part of the dashboard contains a list of incidents that were created, with the main fields that you can use to organize the incident order. As you select the incident on the left, the preview details of the incident are shown at the right. From there, you can initiate the incident’s investigation, or you can click the View Full Details button to see more information about the incident, as shown in Figure 4-4.
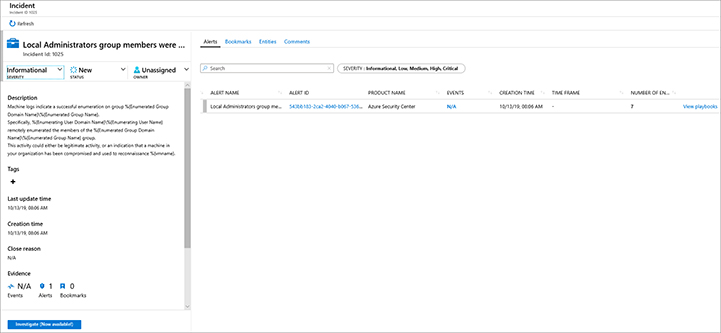
While the left pane of this dashboard shows the same incident summary as the previous dashboard, the right pane allows you to see the alerts that are part of the incident. The example shown in Figure 4-4 has only one alert, but in some cases, more than one alert will be shown. Azure Sentinel has a built-in feature called Fusion, which uses machine learning algorithms to correlate activities from different products, such as Azure Security Center, Azure AD Identity Protection, and Microsoft Cloud App Security. Later in this chapter, we will explore this dashboard further.
Managing an incident
When a new alert is triggered and an incident is created, the status of that incident is set to New. At that point, the Security Operations Center (SOC) Analyst who is triaging the incident can perform the initial assessment to determine whether the severity of the incident needs to change, whether the status of the incident needs to change, and whether the incident should be assigned to another analyst. To change these properties of the incident, follow these steps:
Open Azure Sentinel dashboard and click the Incidents option under Threat Management.
Select the incident you want to manage, and in the right pane, you will see the Incident Summary, as shown in Figure 4-5.
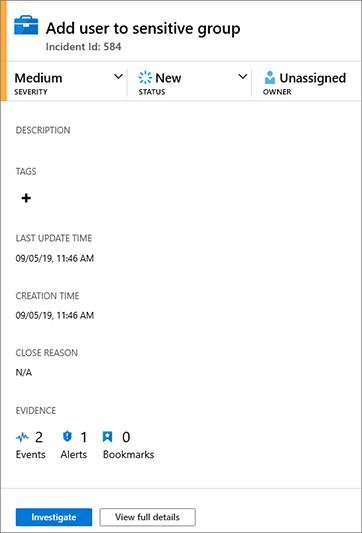
FIGURE 4-5 Accessing Azure Sentinel in Azure Portal To change the incident status, click the Severity button, as shown in Figure 4-6, and change the incident’s severity for the one that is most appropriate; for this example, the current status is Medium, and you will change it to Low.
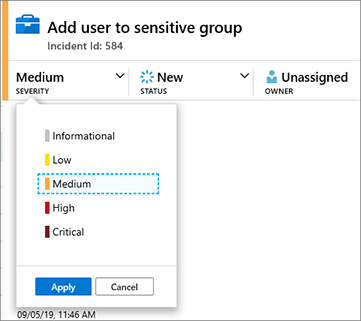
FIGURE 4-6 Changing the incident severity Once you select the new severity, click the Apply button to commit the changes.
To change the status of the incident, click the Status button, Figure 4-7 shows the current status (New), and you should change it to In Progress.
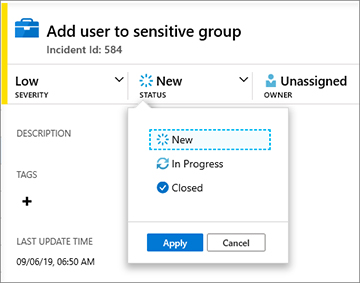
FIGURE 4-7 Changing the incident status Once you select the new status, click the Apply button to commit the changes.
The last option is to assign the incident to another SOC Analyst. Click the Owner button, select the new owner in the list, and click the Apply button to commit the changes.
Now that the incident has been properly triaged, it is time to start a deeper investigation of the incident.
Investigating an incident
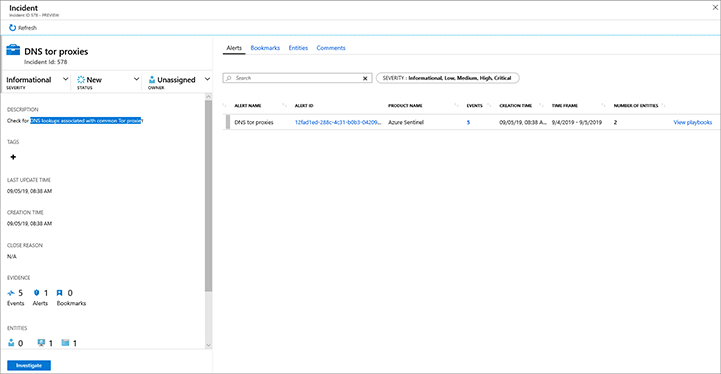
Azure Sentinel provides a rich investigation dashboard that allows you to understand how the attack took place. The investigation usually starts from the full visualization of the incident, which is the dashboard first introduced in Figure 4-4. For this example, let’s use the incident DNS Proxies, which has analytics to check DNS lookups associated with common TOR proxies. The full details of this incident are shown in Figure 4-8.
Tip
The analytic for this alert was created using the DNS_TorProxies.yaml. which is available at Azure Sentinel GitHub repository, https://github.com/Azure/Azure-Sentinel/tree/master/Detections/DnsEvents.
Because you already know the options available in the incident summary (left pane), you want to start exploring the options available in the right pane. At the top of the dashboard are four tabs:
Alerts Alerts that are correlated to the current incident are listed in the dashboard.
Bookmarks Bookmarks help you during an investigation because you will be able to add contextual observations and reference your findings by adding notes and tags. In Chapter 5, “Hunting threats,” you will learn more about bookmarks.
Entities This is a list of entities that are correlated with this incident. Entities can be the host name, IP addresses, or the username. These are important artifacts that can be helpful during the investigation.
Comments This is a field that you can use to type observations regarding your findings.
Now that you understand the different tabs, go back to the Alerts tab to continue the investigation. In Figure 4-8, there is only one alert, but there are five events related to this alert. Notice that the number 5 is hyperlinked, which means when you click this hyperlink, the Log Analytics dashboard appears with the query result for the last five occurrences of this alert, as shown in Figure 4-9.
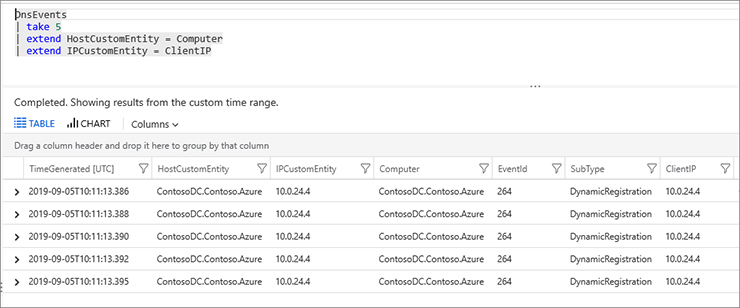
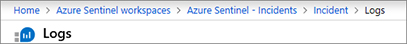
From this dashboard, you can expand each item in the query result to learn more about the details of the event. After you obtain the information that you need, you can click Incident, in the upper navigation bar (see Figure 4-10) to return to the full incident details dashboard.
To view more information about this single instance of the alert, you can click the Alert ID, which is also a hyperlink, and you will see the Log Analytics query result.
Investigation graph
For incidents that have multiple alerts and multiple entities, you can access a better visualization by using the investigation graph. This graph helps you understand the scope and identify the root cause of a potential security threat by correlating relevant data with any involved entity.
Azure Sentinel builds this graph by analyzing your data to find additional insights and connections to the entities extracted from your alerts. It creates the graph based on those connections, which enables you to interact with the graph by pivoting information across the different entities. To access the investigation graph, click the Investigate button on the investigation dashboard. An example of this graph is shown in Figure 4-11.
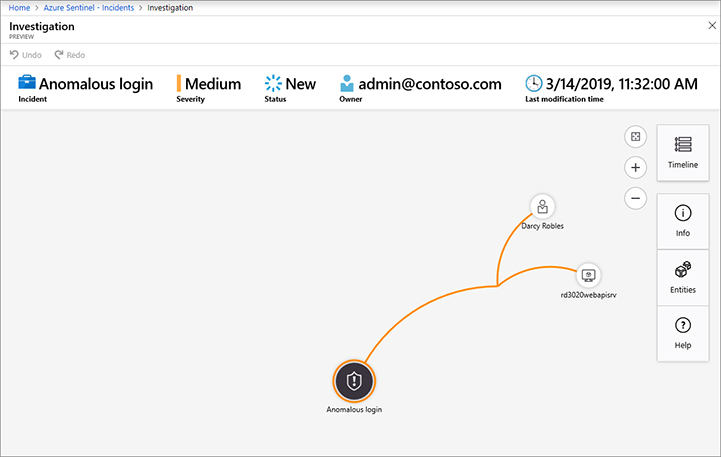
The top part of the investigation graph has important information about the alert’s name, the Severity, Status, Owner (incident’s ownership), and Last modification time (the last time the graph was modified). This graph is very dynamic, and you can click any of those entities to obtain more information. During an investigation, you can start by clicking the alert entity to expand the details about the alert, as shown in Figure 4-12.
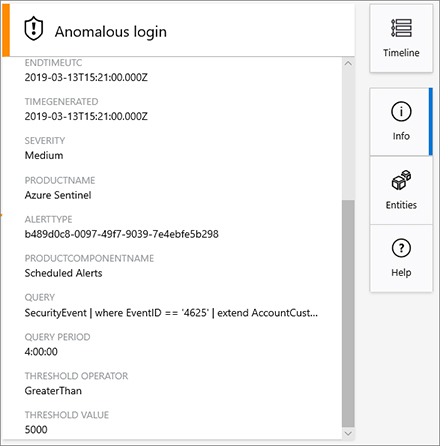
By default, when you select the alert, the information about the alert appears and the Info button is highlighted, as shown in Figure 4-12. The details of the alert may vary according to the alert’s type. For the example shown in Figure 4-12, you can see some important fields, such as Query. An alert showing this field means the alert was generated based on an Azure Sentinel analytic that was created, and this query was used as a parameter.
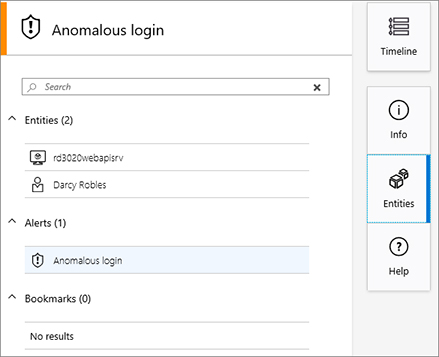
Entities that are correlated to an alert are the next set of information that can be extracted. This information will be available when you click the Entities button on the right pane, as shown in Figure 4-13.
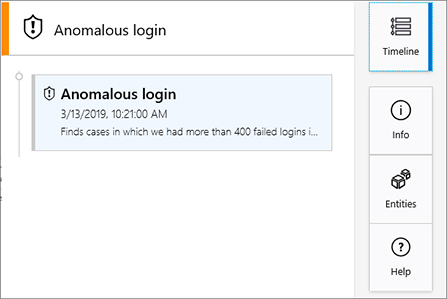
The last option contains a summary of the time and date of the alert. To view this information, click the Timeline button, as shown in Figure 4-14.
To collapse this pane, click the Timeline (the current selection) button again. At this point, you will see the full investigation graph again. Now that you are back to the graph, you can start expanding other entities. Some entities, such as username may have other connections (created based on Azure Sentinel fusion capability) associated to it. To access these connections, you can hover your mouse over the entity; you will see a floating menu, as shown in Figure 4-15.
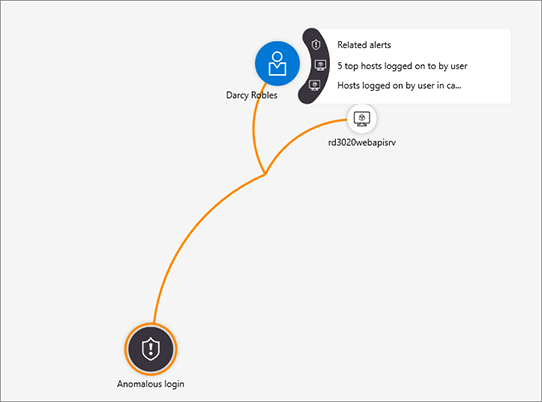
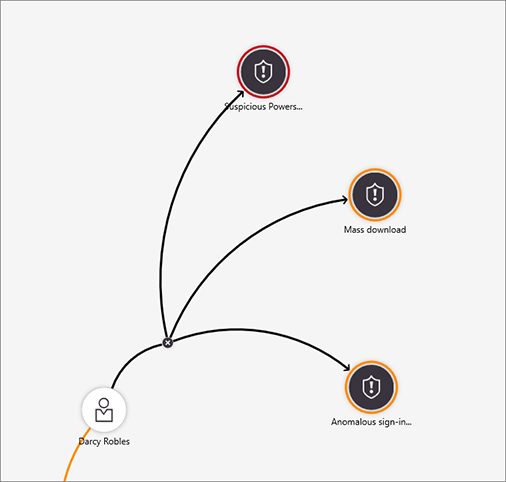
This floating menu allows you to see the other alerts that are related to this entity, the five top hosts where this user logged on, and the hosts logged on to by this user. From the investigation perspective, you can start exploring whether there are other alerts correlated to this user. This will provide more evidence about this user’s suspicious activities. In the floating menu, click Related alerts to see the correlated alerts. An example of the alert correlation is shown in Figure 4-16.
Every alert ingested by Azure Sentinel is saved with a connection to its entities in a graph database. When you click Investigate, it enters the visualization, which pulls the alert and its connections form the graph database. When you expand a node, one of two things happens:
If you chose Related Alerts in the floating menu, this query goes directly to the graph database and returns any related alerts for an entity.
If you chose any other expansion query in the floating menu, a query is run on Log Analytics workspace by Azure Sentinel, which automatically pushes the entities returned to the Graph database and presents them in the graph.
Tip
You can see all the exploration queries we use in the GitHub under exploration queries: https://github.com/Azure/Azure-Sentinel.
Figure 4-16 shows an example of data correlation based on data coming from multiple providers.
The first alert (Suspicious PowerShell Activity) was triggered by Azure Security Center.
The second alert (Mass download) was triggered by Microsoft Cloud App Security.
The third alert (Anomalous sign-in to multiple computers) was triggered by a custom analytic in Azure Sentinel. When multiple alerts are expanded, the user’s timeline will change to show all the relevant alerts, as shown in Figure 4-17.
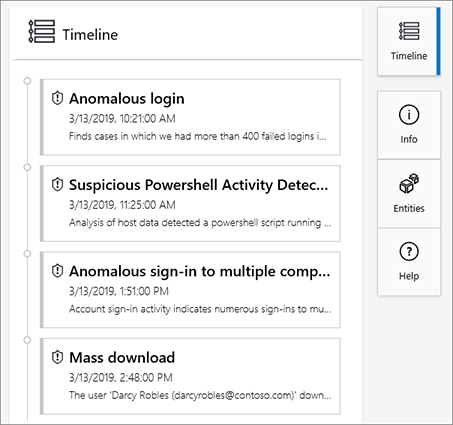
You can use this timeline to better understand how the attack took place, the artifacts related to each part of the attack, and whether there are other entities that are also correlated to these different alerts.