
Chapter at a glance
Add
Insert
Inserting and formatting charts

Create
Creating and formatting SmartArt diagrams

Reuse
Reusing slides and keeping their source formatting
IN THIS CHAPTER, YOU WILL LEARN HOW TO
Choose a slide layout and add text in placeholders.
Add manual check boxes.
Add and format tables.
Insert and format charts using chart styles and layouts.
Create and format SmartArt diagrams.
Reuse slides and keep their source formatting.
You can add many different types of content to a presentation. Some of it, like text and SmartArt graphics, is created directly within Microsoft PowerPoint. Other types, such as pictures or video, are developed elsewhere and simply added to PowerPoint. Either way, there are multiple methods of adding or constructing content and then modifying it once it’s on the slide.
In this chapter, you’ll learn to leverage slide layouts to quickly create and position content. You’ll also learn more about formatting text as well as creating SmartArt, charts, and tables.
Practice Files
To complete the exercises in this chapter, you need the practice files contained in the Chapter13 practice file folder. For more information, see Download the practice files in this book’s Introduction.
When you begin a new presentation, PowerPoint provides you with a title slide to help you get started. The title slide has two text placeholders: one for the title of the presentation, and the other for a subtitle. If you insert another slide, you’ll typically get a title and content layout. This layout also provides you with two placeholders: one for the slide title and another that can hold a variety of content, such as text, tables, charts, SmartArt diagrams, video, or pictures from either your computer or online sources.
These placeholders are preformatted containers just waiting for your content. They provide consistency throughout your presentation and eliminate repetitive formatting tasks. Remember how we formatted the graphic and placeholders on the slide master in the previous chapter? As you know, that formatting (including colors, fonts, effects, and graphics from the theme or template) trickles down to all the slide layouts. Taking it a step further, the actual slides inherit their formatting from the layout they’re based on.
To experience this in action, click the bottom of the New Slide button on the Home tab. Choosing the layout that most closely matches your intended content can save you a lot of time.
Tip
If you don’t find a layout that works with your content, you may want to create your own custom layout, which might save you time in the long run.
See Also
For more about placeholders and creating custom layouts, see Chapter 12.
In this exercise, you’ll insert a slide and add text in a placeholder. You’ll also change text from first-level bulleted text to second-level and vice versa.
Set Up
You need the SampleContentA_start presentation located in the Chapter13 practice file folder to complete this exercise. Open the SampleContentA_start presentation, and save it as SampleContentA. Then follow the steps.
On the first slide, click in the title placeholder, which prompts you with Click to add title, and enter Quarterly Report.
Click in the subtitle placeholder, which reads Click to add subtitle, and enter Robin Wakefield.
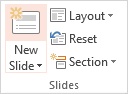
On the Home tab, in the Slides group, click the top of the New Slide button to add a new slide based on the title and content layout.
Tip
When you click the top of the New Slide button, PowerPoint inserts a new slide based on the layout of the selected slide. The exception is when you’ve selected a slide that uses the title slide layout. In such a case, PowerPoint always inserts a slide based on the title and content layout. If you want to choose a different type of layout, click the bottom of the New Slide button.
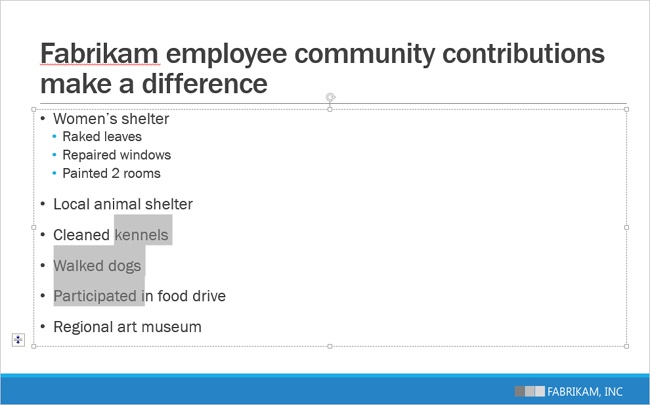
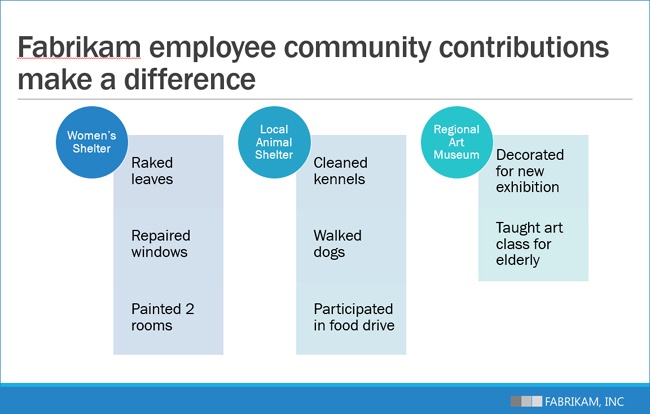
Click in the title placeholder of the slide you just created and enter Fabrikam employee community contributions make a difference.
(Don’t enter the period. Punctuation at the end of bullet points can add a lot of clutter to a slide, so it’s a common practice to omit it.)
Click in the content placeholder and enter Women’s shelter. Press the Enter key and then press Tab to create a second-level bullet point, then enter Raked leaves. Press Enter to create another second-level bullet and enter Repaired windows. Press Enter and enter Painted 2 rooms.
Press Enter to create the next line, then press Shift+Tab to change the text to first-level bulleted text. Enter Local animal shelter.
Keyboard Shortcut
Press Tab or Alt+Shift+Right Arrow to demote text. Press Shift+Tab or Alt+Shift+Left Arrow to promote text.
Tip
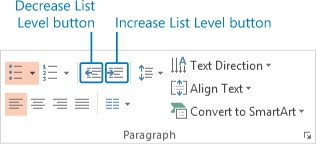
You can also use the Decrease List Level and Increase List Level buttons to promote or demote the text to different levels.
Troubleshooting
Many templates don’t have a bullet point on the first level of text. This looks great, but it can cause problems if you’re used to using the Tab key to create lower levels of bulleted text. If your first-level text doesn’t have a bullet point and you press Tab to create second-level bulleted text, the bullet character won’t appear as expected on the second level. Instead, enter the first-level text, then press Enter and use the Increase List Level button on the ribbon or the keyboard shortcut Alt+Shift+Right Arrow to create second-level text with a bullet character. Alternatively, click View, then Outline, and enter your text in the Outline pane, where Tab and Shift+Tab create levels of text as expected.
Press Enter and enter Cleaned kennels. Press Enter and enter Walked dogs. Press Enter and enter Participated in food drive. Press Enter and enter Regional art museum.
Click anywhere in the Cleaned kennels text. Press and hold the left mouse button and drag until you’ve selected at least part of the Participated in food drive text.
Click the Increase List Level button on the ribbon to change the three primary bullet points into second-level bulleted text.
Place the cursor at the end of the word museum and press Enter, then press Shift+Alt+Right Arrow on the keyboard to create second-level bulleted text. Enter Decorated for new exhibition. Press Enter, then enter Taught art class for elderly.
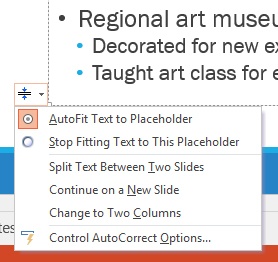
Click the Autofit Options button that appears near the bottom of the placeholder and select Stop Fitting Text to This Placeholder to prevent PowerPoint from shrinking the text and line spacing to force it to fit within the placeholder.

PowerPoint automatically formats and positions any text you add to placeholders. This saves a tremendous amount of time, but it’s not always what you want. For example, sometimes you might need to label a diagram or graphic, or maybe you want to add a reference to the slide. For this, you’ll use a manual text box.
In this exercise, you’ll create and format text in manual text boxes.
Tip
These ad hoc, manual text boxes are designed for small bits of text, so they’re not very robust when it comes to things like multiple levels of bullets.
Set Up
You need the SampleContentB_start presentation located in the Chapter13 practice file folder to complete this exercise. Open the SampleContentB_start presentation, and save it as SampleContentB. Then follow the steps.
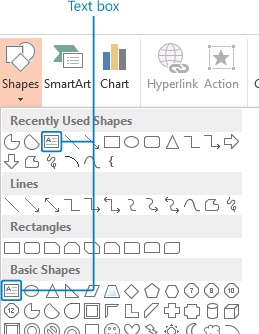
On either the Home tab or the Insert tab, click the Shapes gallery.
Troubleshooting
Depending on the size of your screen and your PowerPoint window, the Shapes gallery may appear as a lot of shapes or it may appear as a big icon. (See Chapter 1, for more information about how screen resolution and window size affect your display.) In the gallery with a lot of shapes, click the arrows or the More button (see Chapter 11) to display all the shapes. If your Shapes gallery is a large icon, just click it to display the entire set of shapes.
Click the Text Box shape. It will be in Basic Shapes if it’s not already at the top in the Recently Used Shapes section.
Click anywhere on the slide and begin entering text to create a text box that expands as you enter the text. Enter the words Conference Area.
Click the edge of the text box to select it.
Tip
When your cursor is inside the text box, the text box edge will display a dotted line, which indicates that you’re working with the text and not the entire text box. Press Esc or the F2 key on your keyboard or click the edge of the text box to select the text box itself. Then format all of the text in it at once. You’ll know you’ve selected the text box when its edge is a solid line.
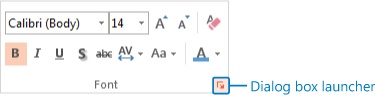
On the Home tab, in the Font group, click Bold to make the text bold.
Click the Decrease Font Size button twice to change the font size to 14 points like the rest of the labels in the diagram.
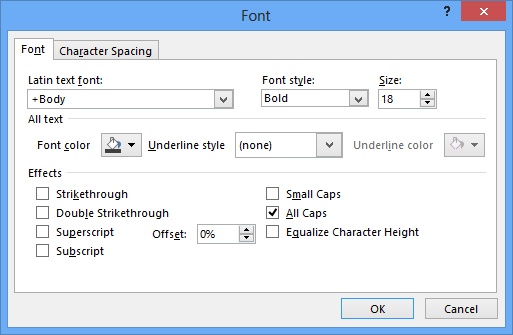
Click the dialog box launcher in the Font group to open the Font dialog box.
Select the All Caps check box to change the text to uppercase, and then click OK to close the dialog box.
Select the text box by clicking its edge, and then drag it into place in the upper-left corner of the diagram. Smart Guides will appear to help you align the label with the others in the diagram.
See Also
For more information about SmartGuides, see Chapter 14.
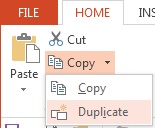
With the Conference Area text box selected, click the arrow next to the Copy button on the Home tab and select Duplicate to create a duplicate text box. Drag the duplicate away from the original text box so it’s easier to work with.
Click in front of the C and drag until you’ve selected all the text. Enter the words Break Area. The selected text will be replaced with the new text as you enter it.
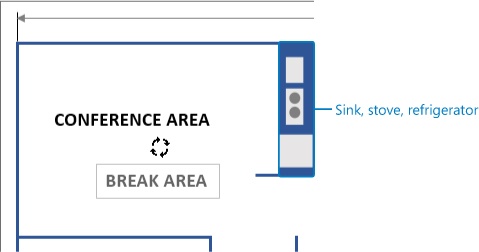
Select the Break Area text box and click the rotation arrow at the top. When the pointer turns into a circular arrow, click and drag to the right to rotate the text box 90 degrees.
Drag the Break Area label into place next to the icons for the sink, stove, and refrigerator at the right end of the Conference Area text.
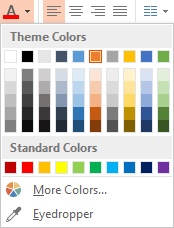
Change the color of the Break Area text by selecting the text box (the edge will display a solid line) and, on the Home tab, in the Font group, clicking the arrow next to the font color icon. In the Theme Colors gallery, click the Accent 2 (orange) color swatch.
Tip
All the formatting you’re doing with manual text can be done to text in placeholders as well. If you need to apply a lot of manual formatting (for example, making all top-level text a different color or size), you should probably make that change on the slide master or on one of the slide layouts.
Create another duplicate of the Conference Area text box, replace the text with the word Storage, and place it in the small square at the upper-right of the diagram.

There are a number of ways to add a table to a slide. You can click the table icon in the content placeholder, or you can use the Table tool on the Insert tab, which gives you three additional options! If you use the icon in the placeholder, the inserted table will fill the width of the placeholder. If you use the table tool on the Insert tab, the table will be inserted into the center of the slide.
Regardless of how you add the table, after it’s on the slide, you can easily format the table by using the Table tools.
In this exercise, you’ll add and quickly format a table.
Set Up
You need the SampleContentC_start presentation located in the Chapter13 practice file folder to complete this exercise. Open the SampleContentC_start presentation, and save it as SampleContentC. Then follow the steps.
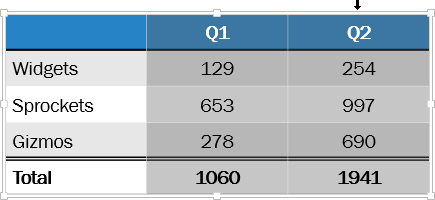
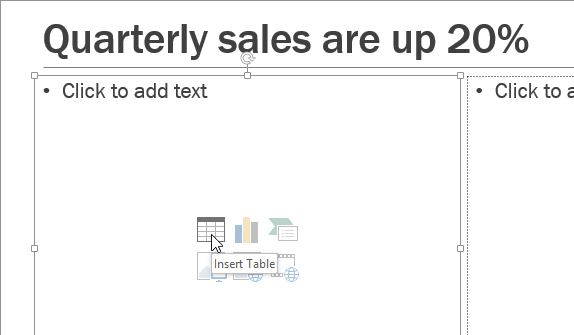
Select slide 2. In the content placeholder on the left, click the Table icon to open the Insert Table dialog box. Enter 3 in the Number of Columns field and 4 for the number of rows. Then click OK to close the dialog box and insert the table.
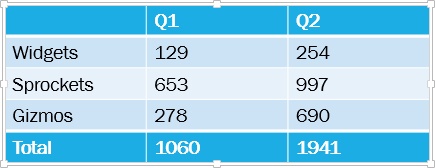
Place your cursor in the first cell of the table, then press the Tab key to move to the second cell of the top row. Enter Q1. Press Tab again and enter Q2 in the last cell of the top row.
In the first cell of the second row, enter Widgets. Press Tab to move to the next cell and enter $129. Press Tab to move to the third cell and enter $254. Press Tab again to move to the first cell in the third row.
Enter Sprockets in the first cell of the third row. Press Tab and enter $653. Press Tab again and enter $997. Press Tab again to move to the first cell in the fourth row.
Enter Gizmos and press Tab to move to the next cell. Enter $278, press Tab again, and enter $690.
Press Tab to create another row. Enter Total in the first cell. Press Tab and enter $1060. Press Tab again and enter $1941.
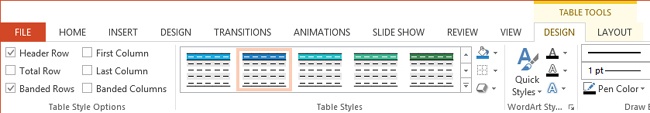
On the Table Tools Design tab, in the Table Style Options group, click Total Row to apply special formatting to the last row in the table.
With the cursor in the table, on the Table Tools Design tab, in the Table Styles gallery, click the style labeled Medium Style 3 - Accent 2.
Tip
As with all the other galleries, you can click the single arrows to scroll through the gallery line by line, or you can click the More button to expand the gallery completely.
Select the table and drag the bottom edge to increase the height of the table and give the text a bit of breathing room.
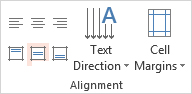
With the table still selected, click the Table Tools Layout tab, then in the Alignment group, click the Center Vertically button to center the text vertically within the cells. (This small task makes your table look 100 percent better!)
Move your mouse pointer above the middle column until the pointer changes to a downward-pointing arrow. Click and drag to the right to select the Q1 and Q2 columns.
On the Table Tools Layout tab, in the Alignment group, click the Center alignment button to horizontally center the text in those two columns.

As with tables, there are multiple ways to add a chart to a slide. The most straightforward ways are to click the chart icon in a content placeholder or to use the Chart tool on the Insert tab. Either way, the Insert Chart dialog box will appear; in it you can choose the type of chart you want to add. You can format charts with just a few clicks.
In this exercise, you’ll insert a chart, add your own data, and apply formatting with just a few clicks.
See Also
For more about creating and formatting charts, see Chapter 23.
Set Up
You need the SampleContentD_start presentation located in the Chapter13 practice file folder to complete this exercise. Open the SampleContentD_start presentation, and save it as SampleContentD. Then follow the steps.
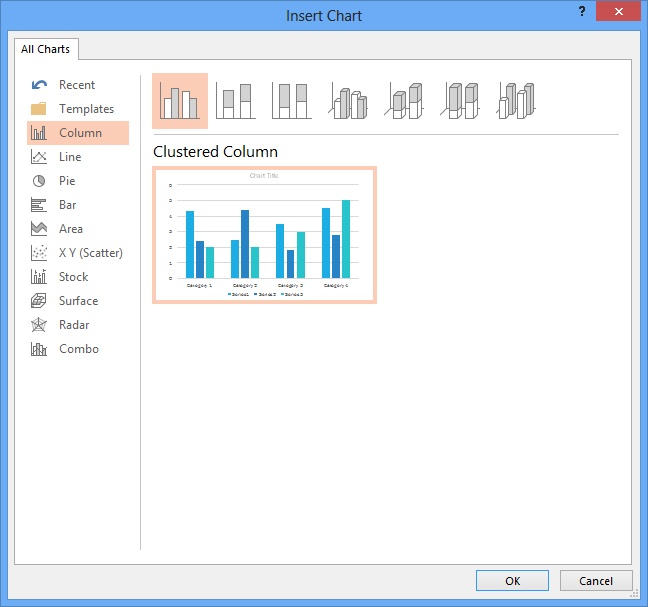
Click the chart icon in the empty placeholder on slide 3.
Click OK to insert the default Clustered Column chart.
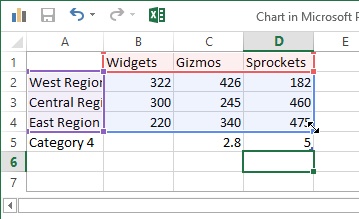
In the chart sheet that appears above the chart on your slide, replace the sample data with your own. As you enter your own data over the sample data, the chart will update.
Click and drag the lower-right corner of the blue line that indicates the data range to eliminate any cells that shouldn’t be included in the chart. Again, the chart’s information will update.
When you’ve finished entering your data, click the X in the upper-right corner of the chart sheet to close it.
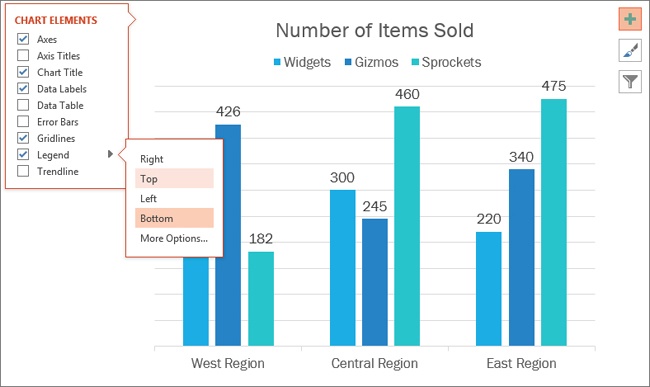
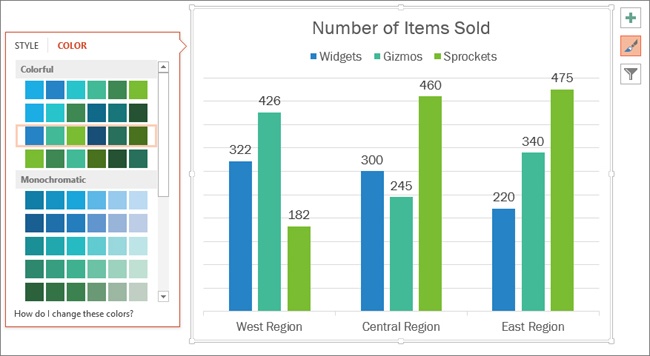
Select the Chart Title text and change it by entering these words: Number of Items Sold.
Click the + icon next to the chart to open the Chart Elements list.
Click the arrow next to Axes and uncheck Primary Vertical to turn off the vertical axis.
Select the check box next to Data Labels to add those to the chart.
Click the arrow to the right of Legend and then click Top to reposition the legend.
Click the paintbrush icon next to the chart and then click Color. Select the third color set so the data is easier to discern.
SmartArt is a diagramming tool that helps you create visual representations of information. SmartArt graphics match the look and feel of your presentation and can be used to create process flows, cycle diagrams, pyramids, organization charts, and more.
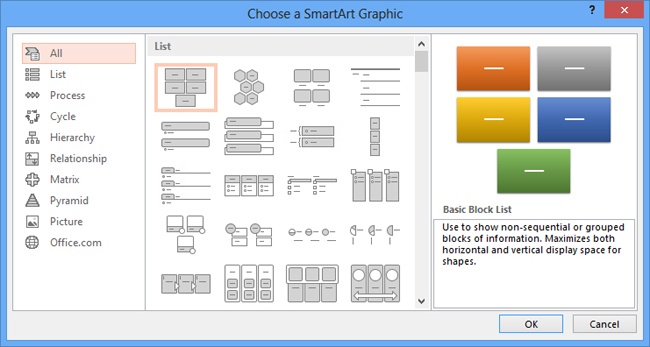
There are several ways to add SmartArt diagrams to your presentation. As you might guess, you can always click the icon in a content placeholder to open a dialog box where you can choose from any number of SmartArt graphics.
You can, of course, use the SmartArt icon on the Insert tab as well, and it will open the same dialog box. But PowerPoint also lets you turn bulleted text into SmartArt graphics with just a few clicks! It’s a quick and easy way to make a boring bulleted slide into a more visual presentation.
In this exercise, you’ll change bulleted list text into a SmartArt graphic and format it.
Set Up
You need the SampleContentE_start presentation located in the Chapter13 practice file folder to complete this exercise. Open the SampleContentE_start presentation, and save it as SampleContentE. Then follow the steps.
Select slide 2 in the thumbnail pane on the left of the workspace. Right-click and choose Duplicate Slide to create a copy of the slide.
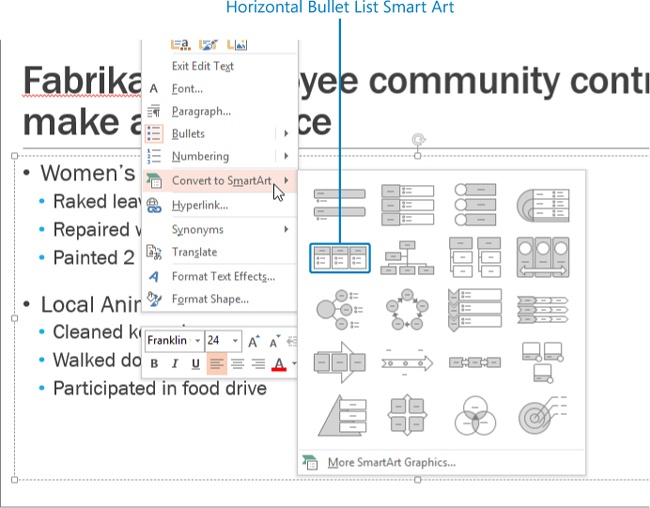
With your cursor inside the body text on slide 2, right-click and select Convert to SmartArt. Point to the SmartArt graphic options in the gallery to determine if any are appropriate for your text. Click the one labeled Horizontal Bullet List to apply it.
Click at the end of the text in the Text pane, then press Enter and type Regional Art Museum, which adds the text both in the pane and in the diagram. Press Enter again and type Decorated for new exhibition. Press Enter again and type Taught art class for elderly.
Click the Up Arrow key on your keyboard until your cursor is in the line of text reading Regional Art Museum, and then press Shift+Tab to promote that text in the pane and create a new shape in the diagram at the same time.
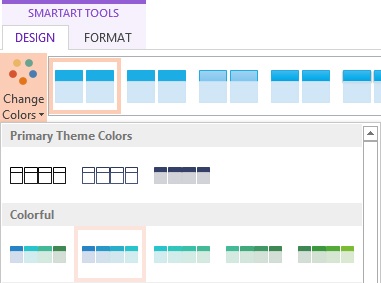
Click the Change Colors button on the SmartArt Tools Design tab and select Colorful Range - Accent Colors 2 to 3 to change the colors of the diagram.
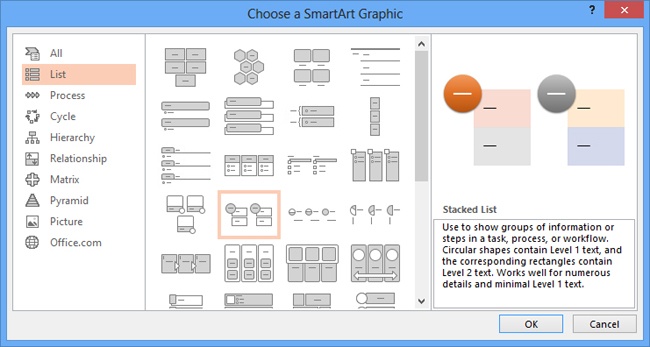
Click the More button in the SmartArt Layouts gallery to expand the gallery. Click More Layouts to display the entire dialog box.
Click List on the left and choose Stacked List.
Click OK to change the diagram.
Troubleshooting
Sometimes the text in a diagram doesn’t size like you think it should. You can use any of the text tools on the Home tab to change the text size, but then your diagram won’t resize the font if you later add or remove text.
Tip
Because SmartArt diagrams are essentially Office graphics, you can apply manual formatting to any elements in tables, charts or SmartArt diagrams just like you can with any shape. See Chapter 14 for more information.

Creating content directly in your presentation is great, but often that content will already exist in another presentation. Those are the times you just need to reuse the slide, not reinvent the wheel!
By default, slides automatically take on the formatting attributes of any presentation you paste them into. Sometimes this is a good thing, but other times you might want the slides to retain their original look. It’s okay either way, because PowerPoint lets you do both!
In this exercise, you’ll insert slides from the Reuse Slides gallery and move them around in the presentation. You’ll also copy and paste slides into a presentation and keep the original formatting.
Set Up
You need the SampleContentF_start and SampleContentG_Start presentations located in the Chapter13 practice file folder to complete this exercise. Open the SampleContentF_start presentation, and save it as SampleContentF. You will open SampleContentG_Start as part of the exercise.
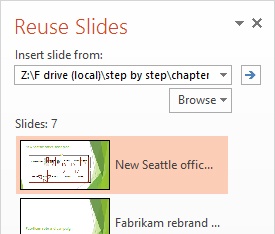
Select slide 3. On the Home tab, click the bottom of the New Slide button and select Reuse Slides to open the Reuse Slides pane.
In the Reuse Slides pane, click the Browse button and then Browse File to insert slides from a file on your hard drive. Alternatively, click the Open a PowerPoint File link just below the Browse button. The link will take you to the same Browse dialog box so you can find the file on your computer.
In the Browse dialog box, navigate to the SampleContentG_Start file and click Open.
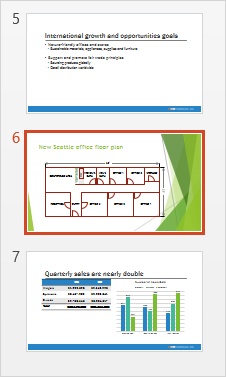
In the Reuse Slides pane, click the sixth thumbnail, titled International growth plan, to add it to the presentation. Then click the last thumbnail to add it. Note that the formatting of the inserted slides is updated to match the template used in the SampleContentF file.
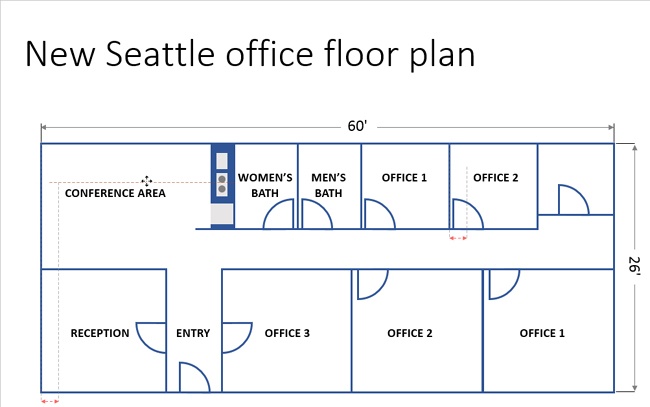
Select the Keep Source Formatting check box at the bottom of the Reuse Slides pane, and then click the first thumbnail (New Seattle office floor plan) to insert it into the presentation.
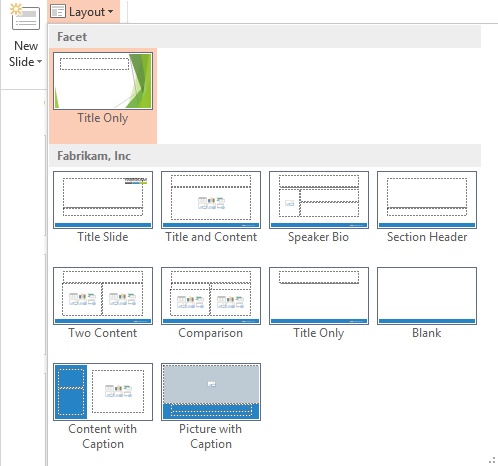
Because Keep Source Formatting was selected, this slide doesn’t pick up the formatting of the SampleContentF presentation when it’s inserted. To change this slide to the blue Fabrikam template so it matches the rest of the presentation, select it and on the Home tab, click the Layout button. Select the Title Only layout from the Fabrikam, Inc set of layouts.
Tip
When your slide has a title, but your content doesn’t lend itself to including it in a placeholder, at least choose the Title Only slide layout. This ensures that your slide titles are all located in the same place and won’t jump around as you move from slide to slide in your presentation. Jumping titles, logos, and other repeated graphics are telltale signs of an amateur-designed presentation.
Click the X in the upper-right corner of the Reuse Slides pane to close it.
Click the File tab, then Open, Computer, and then Browse. Navigate to the SampleContentG_Start file and click Open to open it.
Click the View tab, and in the Window group, click Arrange All to position the presentations side by side.
In the SampleContentG_Start file, click slide 2, press and hold the Shift key, and click slide 5 to select slides 2, 3, 4, and 5.
Right-click and choose Copy, or press Ctrl+C to copy the four slides.
In the SampleContentF file, right-click slide 6 and choose the Use Destination Theme paste option (the first paste icon).
Slides 7 through 10 should still be selected following the paste procedure. If they are not, then select them by pressing Shift and clicking slide 7 and then slide 10. Drag them into position immediately following the first slide.
Click the Slide Sorter button on the status bar to switch to Slide Sorter View.
Select slide 6, the text version of the Fabrikam employee community contributions, and press Delete on your keyboard to delete it.
After you delete slide 6, the Employee Contributions SmartArt graphic slide will become the new slide 6. Select it and drag it to the end of the slides.
Click the Normal button on the status bar to return to Normal (editing) view.


Slide layouts can save you time and effort by providing consistency throughout your presentation.
Placeholders can also save you time and effort by providing formatting for your text and positioning for your other content.
Quickly format charts, tables, and SmartArt graphics by choosing styles and color combinations from the galleries on the Chart, Table, and SmartArt tool tabs.
Chart, Table, and SmartArt styles are all based on the colors in the Color Theme.
You can reuse slides by copying and pasting them into your presentation or by inserting them through the Reuse Slides pane.
By default, old slides inserted into your new presentation will use the new formatting.
If you want inserted slides to maintain their original formatting, select Keep Source Formatting in Paste Options or in the Reuse Slides pane.