6: Inserting Charts and Related Material
What You’ll Do
Use the Text Pane with SmartArt Graphics
Modify, Resize and Format a SmartArt Graphic
Format a Shape in a SmartArt Graphic
Create and Modify an Organization Chart
Insert a Chart and Import Data
Select, Enter and Edit Chart Data
Select a Chart Type, Layout and Style
Change the Chart Layout Objects
Insert, Modify and Format a Table
Add a Quick Style and Effects to a Table
Share Information Among Documents
Insert a Microsoft Excel Chart, Word Document and Organization Chart
Introduction
An effective presentation draws on information from many sources. Microsoft PowerPoint helps you seamlessly integrate information into your presentations using shared data from Office programs.
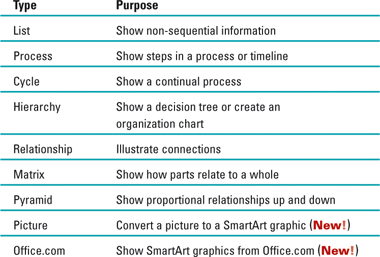
In PowerPoint and other Microsoft Office programs, you can insert SmartArt graphics to create diagrams that convey processes or relationships. PowerPoint offers a wide-variety of built-in SmartArt graphic types from which to choose, including graphical lists, process, cycle, hierarchy, relationship, matrix, pyramid, picture, and Office.com. Using built-in SmartArt graphics makes it easy to create and modify charts without having to create them from scratch. If you already have text on a slide, you can quickly convert your text to a SmartArt graphic.
Instead of adding a table of dry numbers, insert a chart. Charts add visual interest and useful information represented by lines, bars, pie slices, or other markers. Office uses Microsoft Excel to embed and display the information in a chart.
In PowerPoint, you can insert an object created in another program into a presentation using technology known as object linking and embedding (OLE). OLE is a critical feature for many PowerPoint users because it lets you share objects among compatible programs when you create presentations. When you want to make any changes or enhancements to the objects, you can edit the inserted object without having to leave PowerPoint. OLE makes it easy to add graph and organization charts to present information visually. If you have information in other programs, such as Microsoft Word or Microsoft Excel, you can insert it in to your presentation with the help of OLE.
Creating SmartArt Graphics
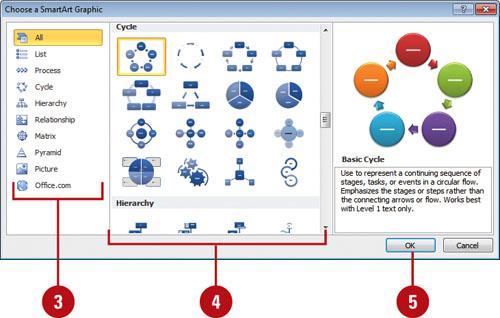
SmartArt graphics allow you to create diagrams that convey processes or relationships. PowerPoint provides a wide variety of built-in SmartArt graphic types, including graphical lists, process, cycle, hierarchy, relationship, matrix, pyramid, picture (New!), and Office.com (New!). Using built-in SmartArt graphics makes it easy to create and modify charts without having to create them from scratch. If you already have text on a slide, you can quickly convert your text to a SmartArt graphic. To quickly see if you like a SmartArt graphic layout, point to a thumbnail in the gallery to display a live preview of it in the selected shape. If you like it, you can apply it.
Create a SmartArt Graphic
![]() Click the Insert tab.
Click the Insert tab.
![]() Click the SmartArt button.
Click the SmartArt button.
TIMESAVER In a content placeholder, you can click the SmartArt icon to start.
![]() In the left pane, click a category, such as All, List, Process, Cycle, Hierarchy, Relationship, Matrix, Pyramid, Picture, or Office.com.
In the left pane, click a category, such as All, List, Process, Cycle, Hierarchy, Relationship, Matrix, Pyramid, Picture, or Office.com.
![]() In the right pane, click a SmartArt graphic style type.
In the right pane, click a SmartArt graphic style type.
![]() Click OK.
Click OK.
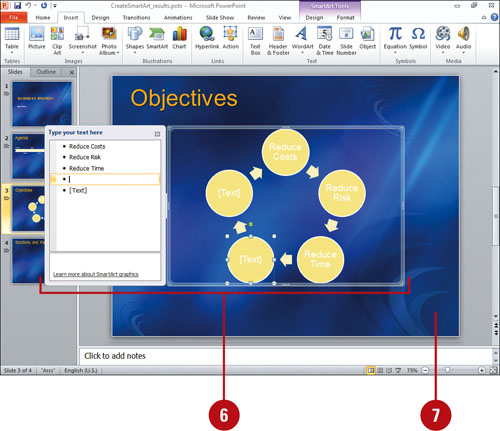
The SmartArt graphic appears with a Text pane to insert text.
![]() Label the shapes by doing one of the following:
Label the shapes by doing one of the following:
![]() Type text in the [Text] box.
Type text in the [Text] box.
You can use the arrow keys to move around the Text pane.
![]() Click a shape, and then type text directly into the shape.
Click a shape, and then type text directly into the shape.
![]() When you’re done, click outside of the SmartArt graphic.
When you’re done, click outside of the SmartArt graphic.
Convert Text to a SmartArt Graphic
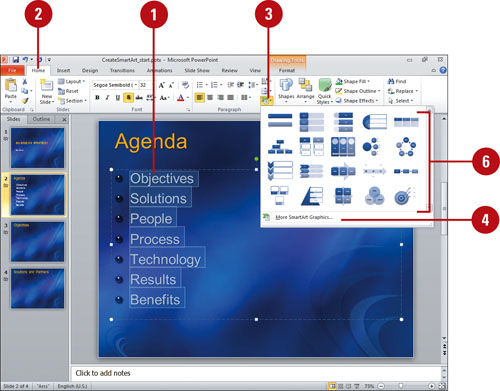
![]() Select the text box with the text you want to convert to a SmartArt graphic.
Select the text box with the text you want to convert to a SmartArt graphic.
![]() Click the Home tab.
Click the Home tab.
![]() Click the Convert to SmartArt Graphic button.
Click the Convert to SmartArt Graphic button.
The gallery displays layouts designed for bulleted lists.
![]() To view the entire list of layout, click More SmartArt Graphics.
To view the entire list of layout, click More SmartArt Graphics.
![]() Point to a layout.
Point to a layout.
A live preview of the style appears in the current shape.
![]() Click the layout for the SmartArt graphic you want from the gallery to apply it to the selected shape.
Click the layout for the SmartArt graphic you want from the gallery to apply it to the selected shape.
SmartArt Graphic Purposes
Did You Know?
You cannot drag text into the Text pane. Although you can’t drag text into the Text pane, you can copy and paste text.
You can create a blank SmartArt graphic. In the Text pane, press Ctrl+A to select all the placeholder text, and then press Delete.
Shorter amounts of text work best for SmartArt graphics. Most of the layouts for SmartArt graphics work the best with smaller amounts of text. However, if you have larger amounts, layouts in the List category work better than others.
Placeholder text doesn’t print or show during a slide show. Placeholder text in the SmartArt graphic doesn’t print or show during a slide show.
Using the Text Pane with SmartArt Graphics
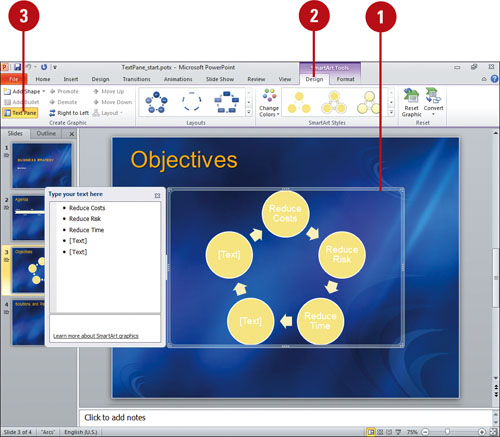
After you create a layout for a SmartArt graphic, a Text pane appears next to your selected SmartArt graphic. The bottom of the Text pane displays a description of the SmartArt graphic. The Text pane and SmartArt graphic contain placeholder text. You can change the placeholder text in the Text pane or directly in the SmartArt graphic. The Text pane works like an outline or a bulleted list and the text corresponds directly with the shape text in the SmartArt graphic. As you add and edit content, the SmartArt graphic automatically updates, adding or removing shapes as needed while maintaining the design. If you see a red “x” in the Text pane, it means that the SmartArt graphic contains a fixed number of shapes, such as Counterbalance Arrows (only two).
Show or Hide the Text Pane
![]() Click the SmartArt graphic you want to modify.
Click the SmartArt graphic you want to modify.
![]() Click the Design tab under SmartArt Tools.
Click the Design tab under SmartArt Tools.
![]() Do any of the following:
Do any of the following:
![]() Show. Click the Text Pane button, or click the control with two arrows along the left side of the SmartArt graphic selection to show the Text pane.
Show. Click the Text Pane button, or click the control with two arrows along the left side of the SmartArt graphic selection to show the Text pane.
![]() Hide. Click the Text Pane button, click the Close button on the Text pane, deselect the SmartArt graphic.
Hide. Click the Text Pane button, click the Close button on the Text pane, deselect the SmartArt graphic.
The Text Pane button toggles to show or hide the Text pane.
Did You Know?
You can resize the Text pane. To resize the Text pane, point to any edge (pointer changes to double-headed arrow), and then drag to resize it.
You can move the Text pane. To move the Text pane, drag the top of the pane. The Text pane location resets when you exit PowerPoint.
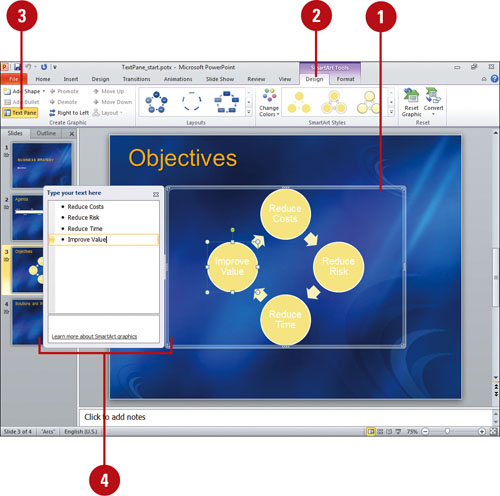
Work with Text in the Text Pane
![]() Click the SmartArt graphic you want to modify.
Click the SmartArt graphic you want to modify.
![]() Click the Design tab under SmartArt Tools.
Click the Design tab under SmartArt Tools.
![]() If necessary, click the Text Pane button to show the Text pane.
If necessary, click the Text Pane button to show the Text pane.
![]() Do any of the following tasks:
Do any of the following tasks:
![]() New line. At the end of a line, press Enter.
New line. At the end of a line, press Enter.
![]() Indent line right. Press Tab, or click the Promote button.
Indent line right. Press Tab, or click the Promote button.
![]() Indent line left. Press Shift+Tab, or click the Demote button.
Indent line left. Press Shift+Tab, or click the Demote button.
![]() Delete line. Select the line text, and then press Delete.
Delete line. Select the line text, and then press Delete.
Did You Know?
You can format text in the Text pane. When you apply formatting to text in the Text pane, it doesn’t display in the Text pane, but it does display in the SmartArt graphic.
You can remove a shape from a SmartArt graphic. Select the SmartArt graphic, click the shape you want to remove, and then press Delete.
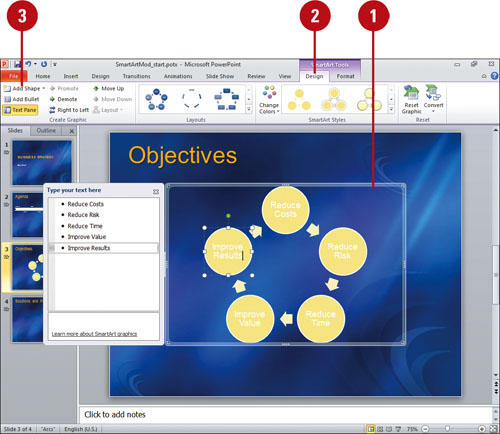
Modifying a SmartArt Graphic
After you create a SmartArt graphic, you can add, remove, change, or rearrange shapes to create a custom look. For shapes within a SmartArt graphic, you can change the shape from the Shape gallery or use familiar commands, such as Bring to Front, Send to Back, Align, Group, and Rotate, to create your own custom SmartArt graphic. If you no longer want a shape you’ve added, simply select it, and then press Delete to remove it.
Add a Shape to a SmartArt Graphic
![]() Select the shape in the SmartArt graphic you want to modify.
Select the shape in the SmartArt graphic you want to modify.
![]() Click the Design tab under SmartArt Tools.
Click the Design tab under SmartArt Tools.
![]() Click the Add Shape button to insert a shape at the end, or click the Add Shape button arrow, and then select the position where you want to insert a shape.
Click the Add Shape button to insert a shape at the end, or click the Add Shape button arrow, and then select the position where you want to insert a shape.
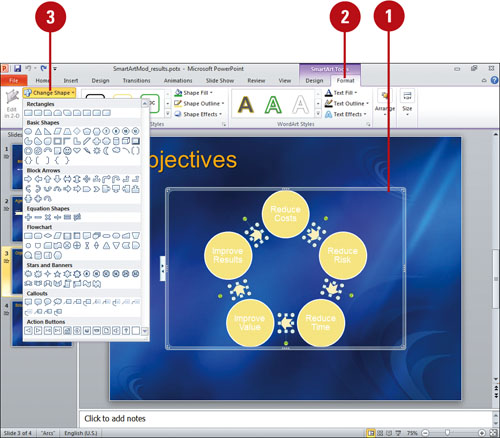
Change Shapes in a SmartArt Graphic
![]() Select the shapes in the SmartArt graphic you want to modify.
Select the shapes in the SmartArt graphic you want to modify.
![]() Click the Format tab under SmartArt Tools.
Click the Format tab under SmartArt Tools.
![]() Click the Change Shape button, and then click a shape.
Click the Change Shape button, and then click a shape.
Did You Know?
You can reset a SmartArt graphic back to its original state. Select the SmartArt graphic, click the Design tab under SmartArt Tools, and then click the Reset Graphic button.
Resizing a SmartArt Graphic
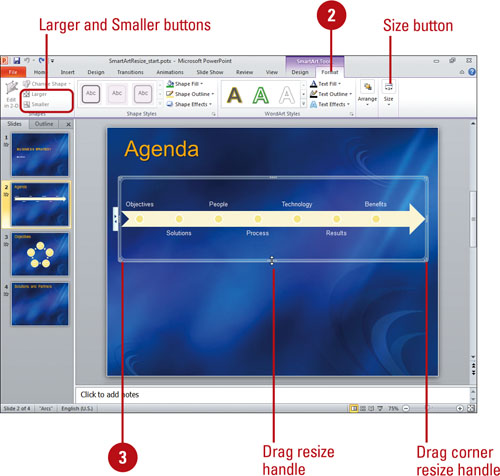
You can change the size of individual shapes within a SmartArt graphic or of an entire SmartArt graphic. If the size of an individual shape within a SmartArt graphic changes, the other shapes in the graphic may also change based on the type of layout. When you resize a shape with text or increase or decrease text size, the text may automatically resize to fit the shape depending on the space available in the SmartArt graphic. When you resize an entire SmartArt graphic, shapes within it scale proportionally or adjust to create the best look.
Resize a SmartArt Graphic
![]() Select the shapes in the SmartArt graphic or the entire SmartArt graphic you want to modify.
Select the shapes in the SmartArt graphic or the entire SmartArt graphic you want to modify.
![]() Click the Format tab under SmartArt Tools.
Click the Format tab under SmartArt Tools.
![]() Use one of the following methods:
Use one of the following methods:
![]() Drag a middle handle to resize the object up, down, left, or right.
Drag a middle handle to resize the object up, down, left, or right.
![]() Drag a corner handle to resize the object proportionally.
Drag a corner handle to resize the object proportionally.
![]() Click the Size button, and then specify the size you want.
Click the Size button, and then specify the size you want.
![]() Click the Larger or Smaller button to increase or decrease the object in standard increments.
Click the Larger or Smaller button to increase or decrease the object in standard increments.
Did You Know?
You can arrange shapes in a SmartArt graphic. Select the shape in the SmartArt graphic, click the Format tab under SmartArt Tools, click the Arrange button, and then use any of the arrange button options: Bring To Front, Send To Back, Align, Group, or Rotate.
You can edit a SmartArt graphic shape in 2-D. Select the SmartArt graphic with the 3-D style, click the Format tab under SmartArt Tools, and then click the Edit In 2-D button.
Formatting a SmartArt Graphic
If your current SmartArt graphics don’t quite convey the message or look you want, you can use live preview to quickly preview layouts in the Quick Styles and Layout Styles groups and select the one you want. If you only want to change the color, you can choose different color schemes using theme colors by using the Change Color button. If the flow of a SmartArt graphic is not the direction you want, you can change the orientation.
Apply a Quick Style to a SmartArt Graphic
![]() Click the SmartArt graphic you want to modify.
Click the SmartArt graphic you want to modify.
![]() Click the Design tab under SmartArt Tools.
Click the Design tab under SmartArt Tools.
![]() Click the scroll up or down arrow, or click the More list arrow in the Quick Styles group to see additional styles.
Click the scroll up or down arrow, or click the More list arrow in the Quick Styles group to see additional styles.
The gallery displays the current layout with different theme colors.
![]() Point to a style.
Point to a style.
A live preview of the style appears in the current shape.
![]() Click the layout for the SmartArt graphic you want from the gallery.
Click the layout for the SmartArt graphic you want from the gallery.
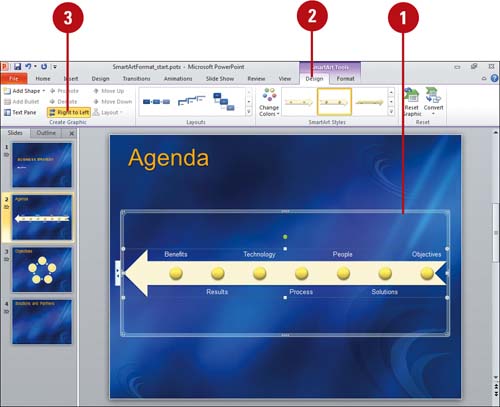
Change a SmartArt Graphic Orientation
![]() Click the SmartArt graphic you want to modify.
Click the SmartArt graphic you want to modify.
![]() Click the Design tab under SmartArt Tools.
Click the Design tab under SmartArt Tools.
![]() Click the Right to Left button.
Click the Right to Left button.
The button toggles, so you can click it again to switch back.
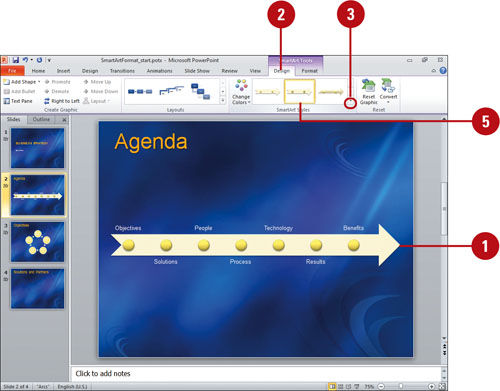
Change a SmartArt Graphic Layout
![]() Click the SmartArt graphic you want to modify.
Click the SmartArt graphic you want to modify.
![]() Click the Design tab under SmartArt Tools.
Click the Design tab under SmartArt Tools.
![]() Click the scroll up or down arrow, or click the More list arrow in the Layout Styles group to see additional styles.
Click the scroll up or down arrow, or click the More list arrow in the Layout Styles group to see additional styles.
The gallery displays layouts designed for bulleted lists.
![]() To view the entire list of diagram layouts, click More Layouts.
To view the entire list of diagram layouts, click More Layouts.
![]() Point to a layout.
Point to a layout.
A live preview of the style appears in the current shape.
![]() Click the layout for the SmartArt graphic you want from the gallery.
Click the layout for the SmartArt graphic you want from the gallery.
![]() If you opened the entire list of layouts, click OK.
If you opened the entire list of layouts, click OK.
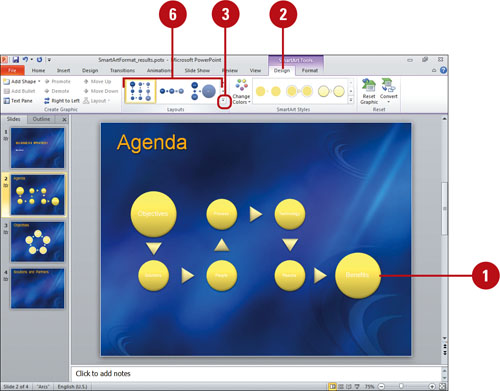
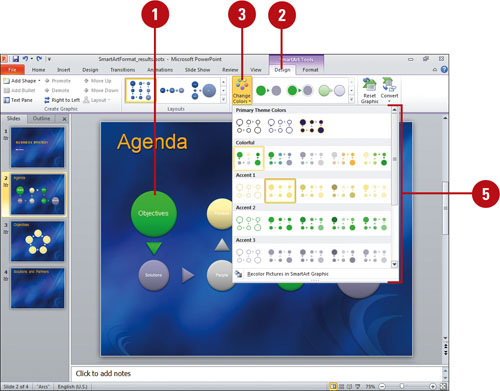
Change a SmartArt Graphic Colors
![]() Click the SmartArt graphic you want to modify.
Click the SmartArt graphic you want to modify.
![]() Click the Design tab under SmartArt Tools.
Click the Design tab under SmartArt Tools.
![]() Click the Change Colors button.
Click the Change Colors button.
The gallery displays the current layout with different theme colors.
![]() Point to a style.
Point to a style.
A live preview of the style appears in the current shape.
![]() Click the layout for the SmartArt graphic you want from the gallery.
Click the layout for the SmartArt graphic you want from the gallery.
Formatting a Shape in a SmartArt Graphic
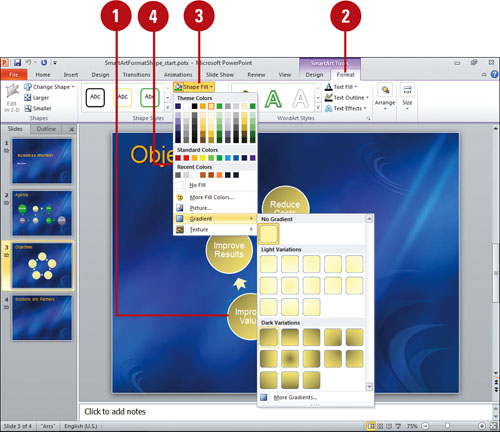
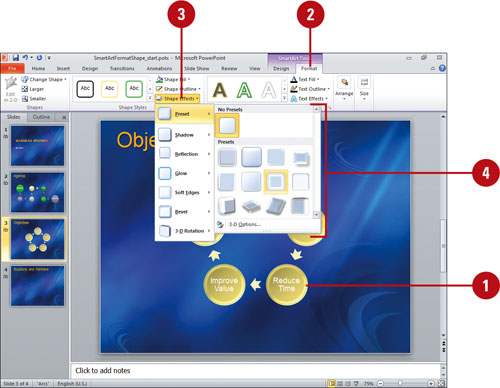
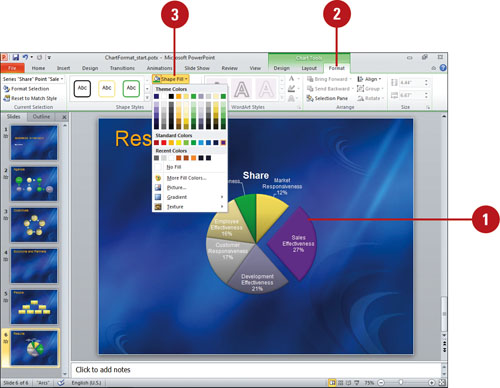
In the same way you can apply shape fills, outlines, and effects to a shape, you can also apply them to shapes in a SmartArt graphic. You can modify all or part of the SmartArt graphic by using the Shape Fill, Shape Outline, and Shape Effects buttons. Shape Fill can be set to be a solid, gradient, texture or picture, or set the Shape Outline to be a solid or gradient. In addition, you can change the look of a SmartArt graphic by applying effects (New!), such as glow and soft edges. If a shape in a SmartArt graphic contains text, you can use WordArt style galleries to modify shape text.
Apply a Shape Fill to a SmartArt Graphic
![]() Select the shapes in the SmartArt graphic you want to modify.
Select the shapes in the SmartArt graphic you want to modify.
TIMESAVER You can hold Ctrl while you click to select multiple shapes, or press Ctrl+A to select all the shapes.
![]() Click the Format tab under SmartArt Tools.
Click the Format tab under SmartArt Tools.
![]() Click the Shape Fill button.
Click the Shape Fill button.
![]() Click a color, No Fill, or Picture to select an image, or point to Gradient, or Texture, and then select a style.
Click a color, No Fill, or Picture to select an image, or point to Gradient, or Texture, and then select a style.
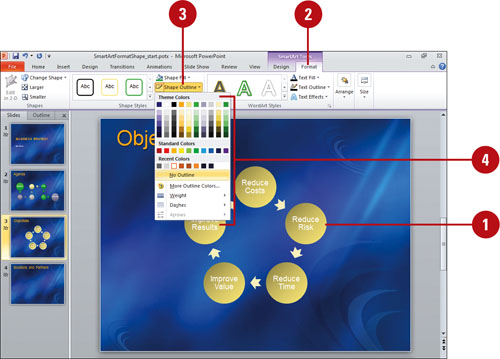
Apply a Shape Outline to a SmartArt Graphic
![]() Select the shapes in the SmartArt graphic you want to modify.
Select the shapes in the SmartArt graphic you want to modify.
![]() Click the Format tab under SmartArt Tools.
Click the Format tab under SmartArt Tools.
![]() Click the Shape Outline button.
Click the Shape Outline button.
![]() Click a color or No Outline, or point to Weight or Dashes, and then select a style.
Click a color or No Outline, or point to Weight or Dashes, and then select a style.
Apply a Shape Effect to a SmartArt Graphic
![]() Select the shapes in the SmartArt graphic you want to modify.
Select the shapes in the SmartArt graphic you want to modify.
![]() Click the Format tab under SmartArt Tools.
Click the Format tab under SmartArt Tools.
![]() Click the Shape Effects button, and then point to one of the following:
Click the Shape Effects button, and then point to one of the following:
![]() Preset to select No 3-D, one of the preset types, or 3-D Options.
Preset to select No 3-D, one of the preset types, or 3-D Options.
![]() Shadow to select No Shadow, one of the shadow types, or Shadow Options.
Shadow to select No Shadow, one of the shadow types, or Shadow Options.
![]() Reflection to select No Reflection, one of the Reflection Variations, or Reflection Options (New!).
Reflection to select No Reflection, one of the Reflection Variations, or Reflection Options (New!).
![]() Glow to select No Glow, one of the Glow Variations, More Glow Colors, or Glow Options (New!).
Glow to select No Glow, one of the Glow Variations, More Glow Colors, or Glow Options (New!).
![]() Soft Edges to select No Soft Edges, a point size to determine the soft edge amount, or Soft Edge Options (New!).
Soft Edges to select No Soft Edges, a point size to determine the soft edge amount, or Soft Edge Options (New!).
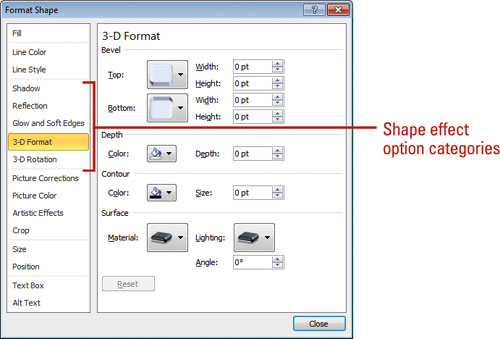
![]() Bevel to select No Bevel, one of the bevel types, or 3-D Options.
Bevel to select No Bevel, one of the bevel types, or 3-D Options.
![]() 3-D Rotation to select No Rotation, one of the rotation types, or 3-D Rotation Options (New!).
3-D Rotation to select No Rotation, one of the rotation types, or 3-D Rotation Options (New!).
When you point to an effect, a live preview of the style appears in the current shape.
![]() Click the effect you want from the gallery to apply it to the selected shape.
Click the effect you want from the gallery to apply it to the selected shape.
Adding Pictures to a SmartArt Graphic
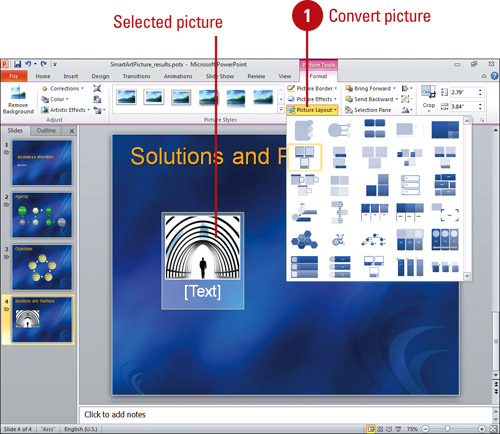
With SmartArt graphic layouts (New!), you can insert pictures in the SmartArt shapes. In addition to the pictures, you can also add descriptive text using the Text pane or shape itself. The process is very simple. Insert a SmartArt picture layout, insert pictures, and then add descriptive text. If you already have pictures in your document, you can convert them to a SmartArt graphic.
Add a SmartArt Graphic to a Picture
![]() Use either of the following to add pictures to a SmartArt graphic:
Use either of the following to add pictures to a SmartArt graphic:
![]() Create New. Click the Insert tab, click the SmartArt button, click Picture, click a layout, and then click OK.
Create New. Click the Insert tab, click the SmartArt button, click Picture, click a layout, and then click OK.
![]() Convert Picture. Select a picture, click the Format tab under Picture Tools, click the Picture Layout button, and then select a layout.
Convert Picture. Select a picture, click the Format tab under Picture Tools, click the Picture Layout button, and then select a layout.
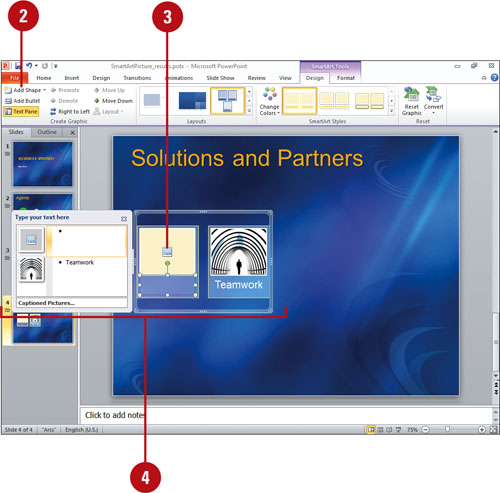
![]() To add a shape, click the Design tab under SmartArt Tools, click the Add Shape button arrow, and then select the type of shape you want to add.
To add a shape, click the Design tab under SmartArt Tools, click the Add Shape button arrow, and then select the type of shape you want to add.
![]() To add a picture, double-click a graphic placeholder, select a picture file, and then click Insert.
To add a picture, double-click a graphic placeholder, select a picture file, and then click Insert.
![]() Label the shapes by doing one of the following:
Label the shapes by doing one of the following:
![]() Type text in the [Text] box.
Type text in the [Text] box.
![]() Click a shape, and then type text directly into the shape.
Click a shape, and then type text directly into the shape.
Converting a SmartArt Graphic to Shapes
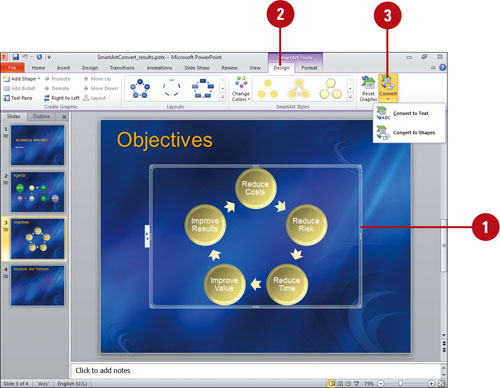
A SmartArt graphic is an easy and powerful way to visually convey text and graphics. However, it’s only supported in PowerPoint 2007 and 2010. If you wanted to share a PowerPoint 2010 presentation with someone who still uses PowerPoint 2003 or earlier, you would need to convert your SmartArt graphics to shapes, and then save your presentation in the PowerPoint 97-2003 (.ppt) file format. You can quickly convert a SmartArt graphic to a group of individual shapes or text by using the Convert button (New!) on the Design tab under SmartArt Tools.
Convert a SmartArt Graphic to Shapes
![]() Select the SmartArt graphic you want to modify.
Select the SmartArt graphic you want to modify.
![]() Click the Design tab under SmartArt Tools.
Click the Design tab under SmartArt Tools.
![]() Click the Convert button, and then click Convert to Shapes or Convert to Text.
Click the Convert button, and then click Convert to Shapes or Convert to Text.
The Convert to Shapes command creates a group of individual shapes, while the Convert to Text command creates a text box.
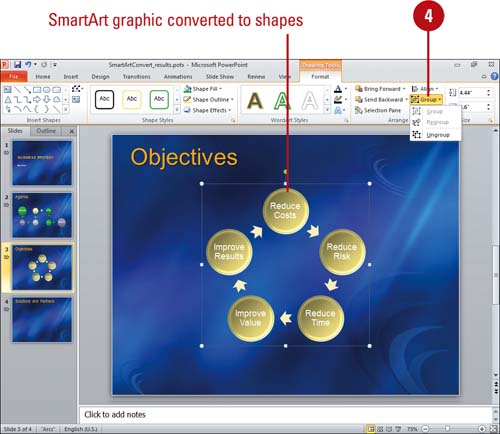
![]() To ungroup the converted SmartArt graphic to shapes, click the Format tab under Drawing Tools, click the Group button, and then click Ungroup.
To ungroup the converted SmartArt graphic to shapes, click the Format tab under Drawing Tools, click the Group button, and then click Ungroup.
Creating an Organization Chart
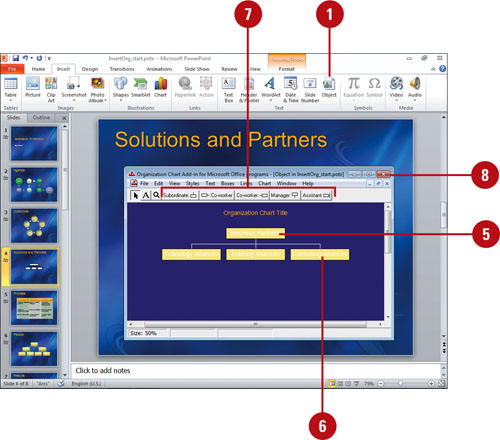
An organization chart shows the reporting relationships between individuals in an organization. For example, you can show the relationship between a manager and employees within a company. You can create an organization chart using a SmartArt graphic or using Microsoft Organization Chart. If you’re creating a new organization chart, a SmartArt graphic is your best choice. If you need to match an existing organization chart from a previous version of PowerPoint, Microsoft Organization Chart is your best choice. A SmartArt graphic organization chart makes it easy to add shapes using the graphic portion or the Text pane.
Create an Organization Chart Using a SmartArt Graphic
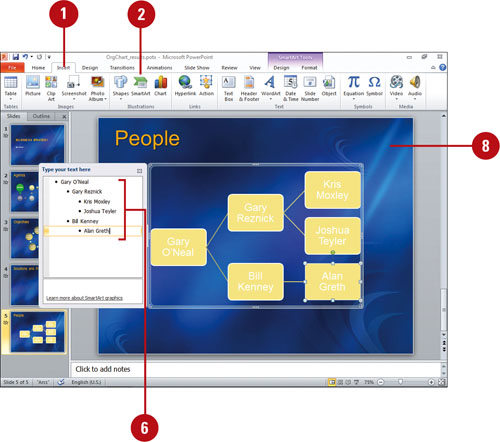
![]() Click the Insert tab.
Click the Insert tab.
![]() Click the SmartArt button.
Click the SmartArt button.
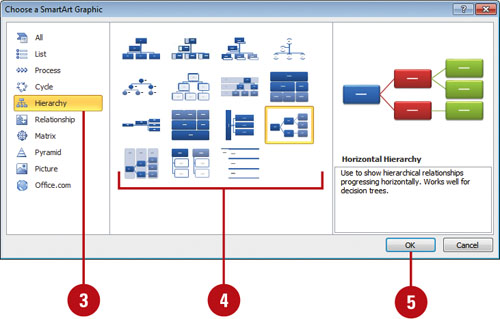
![]() In the left pane, click Hierarchy.
In the left pane, click Hierarchy.
![]() In the right pane, click a SmartArt organization chart type.
In the right pane, click a SmartArt organization chart type.
![]() Click OK.
Click OK.
The SmartArt graphic appears with a Text pane to insert text.
![]() Label the shapes by doing one of the following:
Label the shapes by doing one of the following:
![]() Type text in the [Text] box.
Type text in the [Text] box.
You can use the arrow keys to move around the Text pane.
![]() Click a shape, and then type text directly into the shape.
Click a shape, and then type text directly into the shape.
![]() To add shapes from the Text pane, place the insertion point at the beginning of the text where you want to add a shape, type the text you want, press Enter, and then to indent the new shape, press Tab or to de-indent, press Shift+Tab.
To add shapes from the Text pane, place the insertion point at the beginning of the text where you want to add a shape, type the text you want, press Enter, and then to indent the new shape, press Tab or to de-indent, press Shift+Tab.
![]() When you’re done, click outside of the SmartArt graphic.
When you’re done, click outside of the SmartArt graphic.
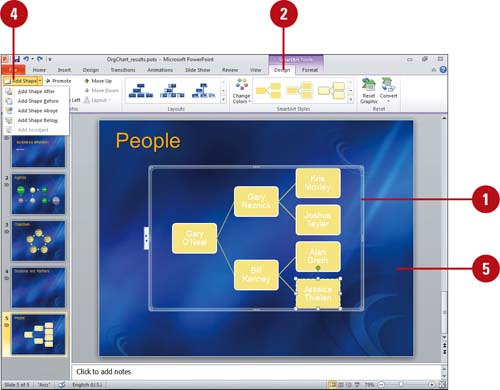
Add a Shape to an Organization Chart
![]() Select the shapes in the SmartArt graphic you want to modify.
Select the shapes in the SmartArt graphic you want to modify.
![]() Click the Design tab under SmartArt Tools.
Click the Design tab under SmartArt Tools.
![]() Click the shape with the layout you want to change.
Click the shape with the layout you want to change.
![]() Click the Add Shape button arrow, and then select the option you want:
Click the Add Shape button arrow, and then select the option you want:
![]() Add Shape After or Add Shape Before. Inserts a shape at the same level.
Add Shape After or Add Shape Before. Inserts a shape at the same level.
![]() Add Shape Above or Add Shape Below. Inserts a shape one level above or below.
Add Shape Above or Add Shape Below. Inserts a shape one level above or below.
![]() Add Assistant. Inserts a shape above, but it’s displayed at the same level at the end in the Text pane.
Add Assistant. Inserts a shape above, but it’s displayed at the same level at the end in the Text pane.
![]() When you’re done, click outside of the SmartArt graphic.
When you’re done, click outside of the SmartArt graphic.
Modifying an Organization Chart
Like any SmartArt graphic, you can add special effects—such as soft edges, glows, or 3-D effects, and animation—to an organization chart. If your organization chart doesn’t quite look the way you want, live preview can help you preview layouts in the Quick Styles and Layout Styles groups and select the one you want. If you only want to change the color, you can choose different color schemes using theme colors by using the Change Color button.
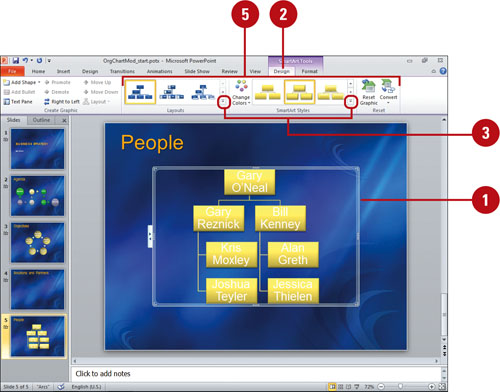
Change the Layout or Apply a Quick Style to an Organization Chart
![]() Click the SmartArt graphic you want to modify.
Click the SmartArt graphic you want to modify.
![]() Click the Design tab under SmartArt Tools.
Click the Design tab under SmartArt Tools.
![]() Click the scroll up or down arrow, or click the More list arrow in the Layouts group or Quick Styles group to see additional styles.
Click the scroll up or down arrow, or click the More list arrow in the Layouts group or Quick Styles group to see additional styles.
The gallery displays different layouts or the current layout with different theme colors.
![]() Point to a style.
Point to a style.
A live preview of the style appears in the current shape.
![]() Click the layout or style for the SmartArt graphic you want from the gallery.
Click the layout or style for the SmartArt graphic you want from the gallery.
Did You Know?
You can change organization chart lines to dotted lines. Right-click the line you want to modify, click Format Shape, click Line Style, click Dash type, click a style, and then click Close.
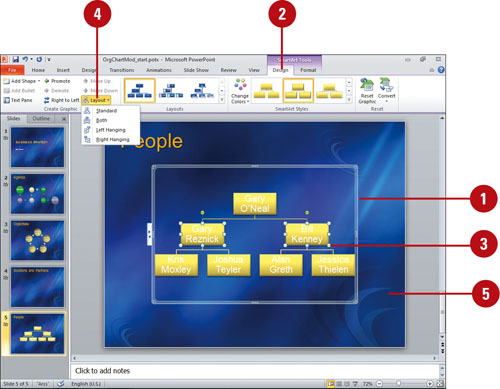
Modify an Organization Chart Layout Using a SmartArt Graphic
![]() Select the shapes in the SmartArt graphic you want to modify.
Select the shapes in the SmartArt graphic you want to modify.
![]() Click the Design tab under SmartArt Tools.
Click the Design tab under SmartArt Tools.
![]() Click the shape with the layout you want to change.
Click the shape with the layout you want to change.
![]() Click the Organization Chart Layout button, and then select the option you want:
Click the Organization Chart Layout button, and then select the option you want:
![]() Standard. Traditional top down chart.
Standard. Traditional top down chart.
![]() Both. Relational left and right chart.
Both. Relational left and right chart.
![]() Left Hanging or Right Hanging. Left or right hanging down chart.
Left Hanging or Right Hanging. Left or right hanging down chart.
![]() When you’re done, click outside of the SmartArt graphic.
When you’re done, click outside of the SmartArt graphic.
Did You Know?
You can change the colors of an organization chart. Click the SmartArt graphic you want to modify, click the Design tab under SmartArt Tools, click the Change Colors button, and then click the color theme you want.
Inserting a Chart
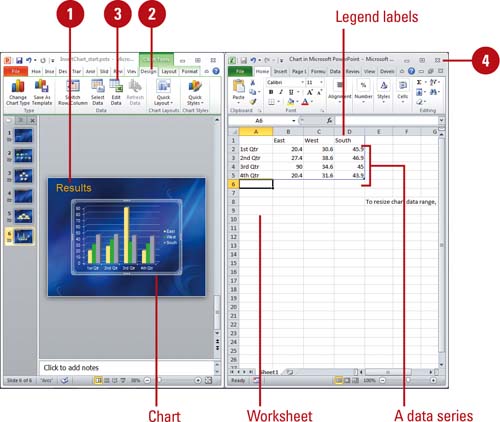
Instead of adding a table of dry numbers, insert a chart. Charts add visual interest and useful information represented by lines, bars, pie slices, or other markers. PowerPoint uses Microsoft Excel to embed and display the information in a chart: the worksheet, a spreadsheet-like grid of rows and columns that contains your data; and the chart, the graphical representation of the data. A worksheet contains cells to hold your data. A cell is the intersection of a row and column. A group of data values from a row or column of data makes up a data series. Each data series has a unique color or pattern on the chart.
Insert and Create a Chart
![]() Click the Insert tab.
Click the Insert tab.
![]() Click the Chart button.
Click the Chart button.
TIMESAVER In a content placeholder, you can click the Chart icon to start.
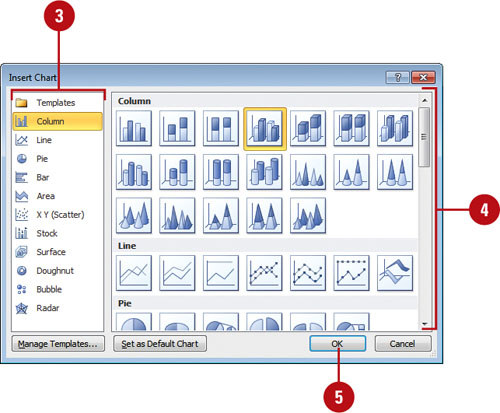
![]() In the left pane, click a category, such as Column, Line, Pie, Bar, Area, X Y (Scatter), Stock, Surface, Doughnut, Bubble, and Radar.
In the left pane, click a category, such as Column, Line, Pie, Bar, Area, X Y (Scatter), Stock, Surface, Doughnut, Bubble, and Radar.
![]() In the right pane, click a chart style type.
In the right pane, click a chart style type.
![]() Click OK.
Click OK.
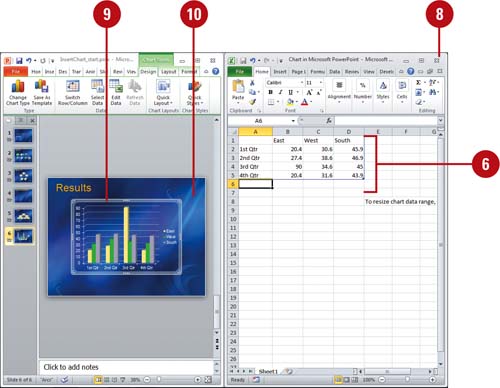
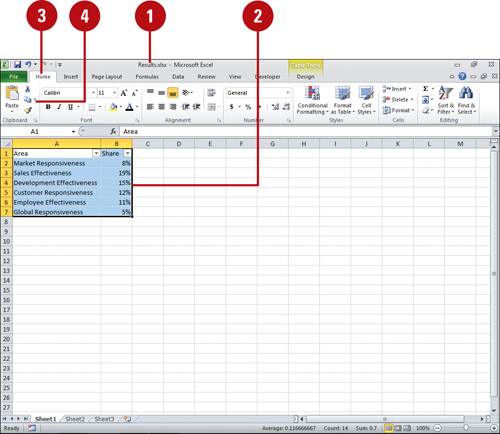
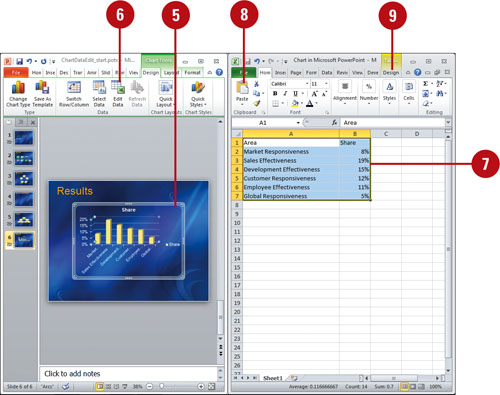
A Microsoft Excel worksheet opens and tiles next to your PowerPoint presentation. The worksheet contains sample data, and the presentation contain a chart.
![]() Replace the sample data in the datasheet with your own data.
Replace the sample data in the datasheet with your own data.
![]() Edit and format the data in the datasheet as appropriate.
Edit and format the data in the datasheet as appropriate.
![]() Click the Close button on the Excel worksheet to close it and view the chart in PowerPoint.
Click the Close button on the Excel worksheet to close it and view the chart in PowerPoint.
![]() If necessary, change the chart type, and format the chart.
If necessary, change the chart type, and format the chart.
![]() When you’re done, click outside of the chart.
When you’re done, click outside of the chart.
![]() Click the chart you want to modify.
Click the chart you want to modify.
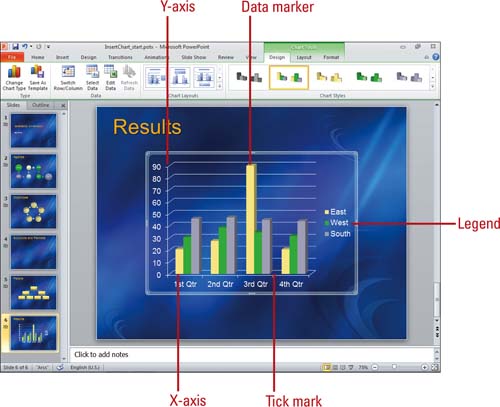
A chart consists of the following elements.
![]() Data markers. A graphical representation of a data point in a single cell in the datasheet. Typical data markers include bars, dots, or pie slices. Related data markers constitute a data series.
Data markers. A graphical representation of a data point in a single cell in the datasheet. Typical data markers include bars, dots, or pie slices. Related data markers constitute a data series.
![]() Legend. A pattern or color that identifies each data series.
Legend. A pattern or color that identifies each data series.
![]() X-axis. A reference line for the horizontal data values.
X-axis. A reference line for the horizontal data values.
![]() Y-axis. A reference line for the vertical data values.
Y-axis. A reference line for the vertical data values.
![]() Tick marks. Marks that identify data increments.
Tick marks. Marks that identify data increments.
![]() Click the Design tab under Chart Tools.
Click the Design tab under Chart Tools.
![]() Click the Edit Data button.
Click the Edit Data button.
A Microsoft Excel worksheet opens and tiles next to your PowerPoint presentation.
![]() To close the worksheet and view the chart, click the Close button on the Excel worksheet and return to PowerPoint.
To close the worksheet and view the chart, click the Close button on the Excel worksheet and return to PowerPoint.
Did You Know?
You can create a chart from a slide layout. To create a chart on a new slide, click the New Slide button on the Home tab, choose a slide layout with the content or chart option from the gallery, and then click the chart icon in the placeholder to add the chart and worksheet.
Selecting Chart Data
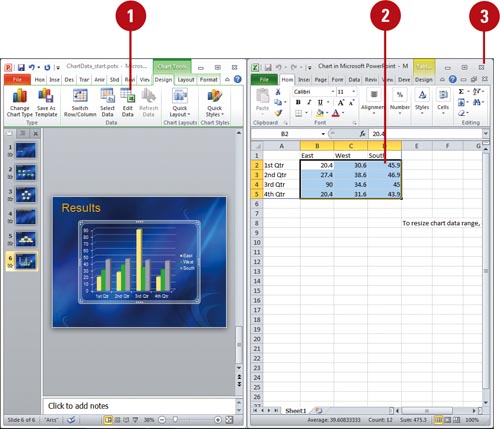
Use Microsoft Excel worksheet to edit your data. Select the data first in the worksheet. If you click a cell to select it, anything you type replaces the contents of the cell. If you double-click the cell, however, anything you type is inserted at the location of the cursor. You can select one cell at a time, or you can manipulate blocks of adjacent data called ranges. For example, the sample data below is a range.
Select Data in the Worksheet
![]() Click the chart you want to modify, and then click the Edit Data button on the Design tab under Chart Tools.
Click the chart you want to modify, and then click the Edit Data button on the Design tab under Chart Tools.
![]() Use one of the following to select a cell, row, column, or datasheet.
Use one of the following to select a cell, row, column, or datasheet.
![]() To select a cell, click it.
To select a cell, click it.
![]() To select an entire row or column, click the row heading or column heading button.
To select an entire row or column, click the row heading or column heading button.
![]() To select a range of cells, drag the pointer over the cells you want to select, or click the upper-left cell of the range, press and hold Shift, and then click the lower-right cell. When you select a range of cells, the active cell is white, and all other selected cells are outlined in black.
To select a range of cells, drag the pointer over the cells you want to select, or click the upper-left cell of the range, press and hold Shift, and then click the lower-right cell. When you select a range of cells, the active cell is white, and all other selected cells are outlined in black.
![]() To close the worksheet and view the chart, click the Close button on the Excel worksheet and return to PowerPoint.
To close the worksheet and view the chart, click the Close button on the Excel worksheet and return to PowerPoint.

Did You Know?
You can get help with Microsoft Excel. Get help specific to Microsoft Excel by clicking the Help button on the Ribbon or by pressing F1 when you are in Excel.
Entering Chart Data
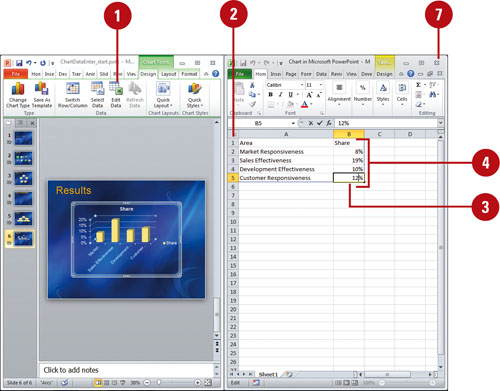
You can enter chart data in the worksheet either by typing it or by inserting it from a different source. The worksheet is designed to make data entry easy, so direct typing is best when you’re entering brief, simple data. For more complex or longer data, and when you’re concerned about accuracy, insert and link your data to the chart. When you first insert a chart, the worksheet contains sample labels and numbers. If you’re entering data by typing, click a cell to make it the active cell, and then select the sample information and replace it with your own.
Enter Data in the Worksheet
![]() Click the chart you want to modify, and then click the Edit Data button on the Design tab under Chart Tools.
Click the chart you want to modify, and then click the Edit Data button on the Design tab under Chart Tools.
![]() To delete the sample data, click the upper-left heading button to select all the cells, and then press Delete.
To delete the sample data, click the upper-left heading button to select all the cells, and then press Delete.
![]() Click the cell to make it active.
Click the cell to make it active.
![]() Type the data you want to enter in the cell.
Type the data you want to enter in the cell.
![]() Press Enter to move the insertion point down one row or press Tab to move the insertion point right to the next cell.
Press Enter to move the insertion point down one row or press Tab to move the insertion point right to the next cell.
![]() If necessary, select the data you want for the chart, click the Design tab, click the Resize Table button, and then click OK.
If necessary, select the data you want for the chart, click the Design tab, click the Resize Table button, and then click OK.
![]() To close the worksheet and view the chart, click the Close button on the Excel worksheet and return to PowerPoint.
To close the worksheet and view the chart, click the Close button on the Excel worksheet and return to PowerPoint.
Did You Know?
You can turn automatic completion of cell entries on or off. Excel completes text entries that you start to type. Click the File tab, click Options, click Advanced in the left pane, select or clear Enable AutoComplete For Cell Values check box, and then click OK.
Editing Chart Data
You can edit chart data in an Excel worksheet one cell at a time, or you can manipulate a range of data. If you’re not sure what data to change to get the results you want, use the Edit Data Source dialog box to help you. In previous versions, you were limited to 32,000 data points in a data series for 2-D charts. Now you can have as much as your memory to store (New!). You can work with data ranges by series, either Legend or Horizontal. The Legend series is the data range displayed on the axis with the legend, while the Horizontal series is the data range displayed on the other axis. Use the Collapse Dialog button to temporarily minimize the dialog to select the data range you want. After you select your data, click the Expand Dialog button to return back to the dialog box.
Edit Data in the Worksheet
![]() Click the chart you want to modify, and then click the Edit Data button on the Design tab under Chart Tools.
Click the chart you want to modify, and then click the Edit Data button on the Design tab under Chart Tools.
![]() To delete the sample data, click the upper-left heading button to select all the cells, and then press Delete.
To delete the sample data, click the upper-left heading button to select all the cells, and then press Delete.
![]() In the worksheet, use any of the following methods to edit cell contents:
In the worksheet, use any of the following methods to edit cell contents:
![]() To replace the cell contents, click the cell, type the data you want to enter in the cell. It replaces the previous entry.
To replace the cell contents, click the cell, type the data you want to enter in the cell. It replaces the previous entry.
![]() To edit the cell content, double-click the selected cell where you want to edit.
To edit the cell content, double-click the selected cell where you want to edit.
Press Delete or Backspace to delete one character at a time, and then type the new data.
![]() Press Enter to move the insertion point down one row or press Tab to move the insertion point right to the next cell.
Press Enter to move the insertion point down one row or press Tab to move the insertion point right to the next cell.
![]() To close the worksheet and view the chart, click the Close button on the Excel worksheet and return to PowerPoint.
To close the worksheet and view the chart, click the Close button on the Excel worksheet and return to PowerPoint.
![]() Click the chart you want to modify, and then click the Select Data button on the Design tab under Chart Tools.
Click the chart you want to modify, and then click the Select Data button on the Design tab under Chart Tools.
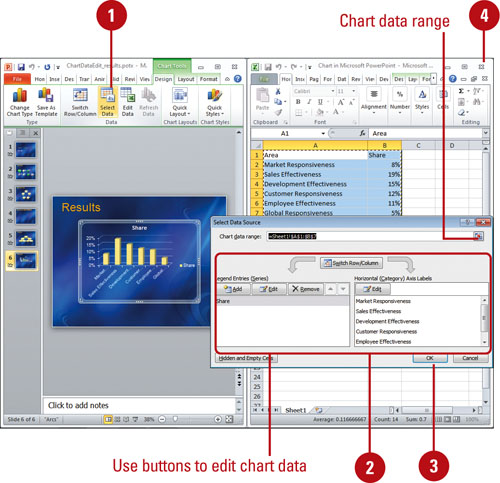
![]() In the Select Data Source dialog box, use any of the following:
In the Select Data Source dialog box, use any of the following:
IMPORTANT Click the Collapse Dialog button to minimize the dialog, so you can select a range in the worksheet. Click the Expand Dialog button to maximize it again.
![]() Chart data range. Displays the data range in the worksheet of the plotted chart.
Chart data range. Displays the data range in the worksheet of the plotted chart.
![]() Switch Row/Column. Click to switch plotting the data series in the chart from rows or columns.
Switch Row/Column. Click to switch plotting the data series in the chart from rows or columns.
![]() Add. Click to add a new Legend data series to the chart.
Add. Click to add a new Legend data series to the chart.
![]() Edit. Click to make changes to a Legend or Horizontal series.
Edit. Click to make changes to a Legend or Horizontal series.
![]() Remove. Click to remove the selected Legend data series.
Remove. Click to remove the selected Legend data series.
![]() Move Up and Move Down. Click to move a Legend data series up or down in the list.
Move Up and Move Down. Click to move a Legend data series up or down in the list.
![]() Hidden and Empty Cells. Click to plot hidden worksheet data in the chart and determine what to do with empty cells.
Hidden and Empty Cells. Click to plot hidden worksheet data in the chart and determine what to do with empty cells.
![]() Click OK.
Click OK.
![]() To close the worksheet and view the chart, click the Close button on the Excel worksheet and return to PowerPoint.
To close the worksheet and view the chart, click the Close button on the Excel worksheet and return to PowerPoint.
Importing Data
PowerPoint makes it easy to insert data from other sources, such as a plain text file, Microsoft Access database, or a Microsoft Excel work-sheet. You have control over how much of the data in a file you want to insert, and, in the case of an imported text file, you can indicate how Excel should arrange your data once it is imported.
Import Data into the Worksheet
![]() Click the chart you want to modify, and then click the Edit Data button on the Design tab under Chart Tools.
Click the chart you want to modify, and then click the Edit Data button on the Design tab under Chart Tools.
![]() In Excel, click the cell where you want the data to begin. You cannot select cells already used in a PowerPoint chart. If you want, delete them first.
In Excel, click the cell where you want the data to begin. You cannot select cells already used in a PowerPoint chart. If you want, delete them first.
![]() Click the Data tab.
Click the Data tab.
![]() Click the Get External Data button arrow, and then click the button with the type of data you want to import.
Click the Get External Data button arrow, and then click the button with the type of data you want to import.
![]() Double-click the file that contains the data you want to import.
Double-click the file that contains the data you want to import.
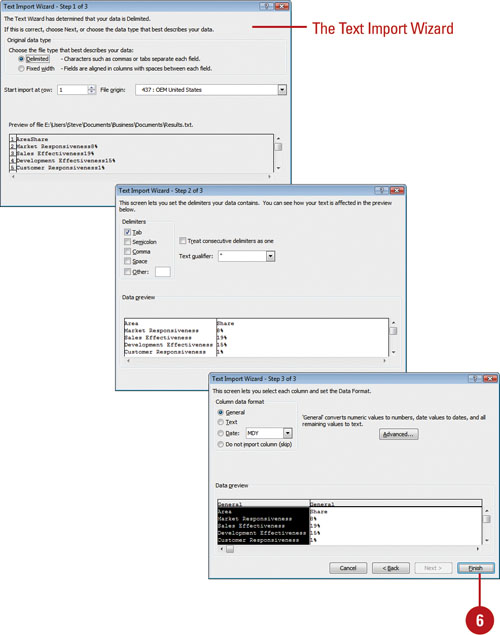
![]() If you are importing a text file, follow the Text Import Wizard steps, and then click Finish.
If you are importing a text file, follow the Text Import Wizard steps, and then click Finish.
![]() If you are importing Excel data, select the sheet that contains the data you want to import in the Import Data dialog box.
If you are importing Excel data, select the sheet that contains the data you want to import in the Import Data dialog box.
![]() Select the option how you want to view this data in your workbook: Table, PivotTable Report, PivotChart and PivotTable Report, or Only Create Connection.
Select the option how you want to view this data in your workbook: Table, PivotTable Report, PivotChart and PivotTable Report, or Only Create Connection.
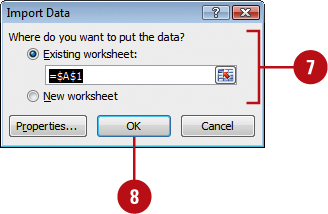
![]() Select where you want to put the data. Click the New worksheet option or click the Existing worksheet option, and then specify a cell or range of data.
Select where you want to put the data. Click the New worksheet option or click the Existing worksheet option, and then specify a cell or range of data.
![]() Click OK.
Click OK.
![]() In the source program, open the file that contains the data you want to paste.
In the source program, open the file that contains the data you want to paste.
![]() Select the data you want to paste.
Select the data you want to paste.
![]() Click the Home tab.
Click the Home tab.
![]() Click the Copy button.
Click the Copy button.
![]() Switch to PowerPoint, and then click the Microsoft Excel chart.
Switch to PowerPoint, and then click the Microsoft Excel chart.
![]() Click the Edit Data button on the Design tab under Chart Tools.
Click the Edit Data button on the Design tab under Chart Tools.
![]() If necessary, switch to the datasheet and clear its contents.
If necessary, switch to the datasheet and clear its contents.
![]() Paste the data into the datasheet using one of the following methods.
Paste the data into the datasheet using one of the following methods.
![]() To paste the data without linking it, click the Home tab, and then click the Paste button.
To paste the data without linking it, click the Home tab, and then click the Paste button.
![]() To link the data, click the Home tab, click the Paste button arrow, click Paste Link, and then click OK.
To link the data, click the Home tab, click the Paste button arrow, click Paste Link, and then click OK.
![]() If necessary, select the data you want for the chart, click the Design tab, click the Resize Table button, and then click OK.
If necessary, select the data you want for the chart, click the Design tab, click the Resize Table button, and then click OK.
Did You Know?
You can switch the data series around. In PowerPoint, click the chart, click the Design tab under Chart Tools, and then click the Switch Row/Column button.
Office pastes charts from PowerPoint as a picture. If you paste a chart from PowerPoint into a program other than PowerPoint, Word, or Excel, the chart is pasted as a picture. A workaround is to copy the chart from Excel.
Modifying the Data Worksheet
After you enter or edit data in the worksheet, you might need to change the column widths to fit the data. If you see ##### in a cell, it means there is not enough room in the column to display the data. You need to increase the column width to display the data. If you need to change one column, you can use the mouse to quickly change the column width. To uniformly change several columns to the same column width, you can use the Column Width command on the Format menu. You may need to reformat the datasheet itself—its size and how it displays the data—to make it easier to read. For example, you can format numbers in currency, accounting, percentage, and scientific formats. You can also change the fonts used in the graph.
Change the Width of a Column
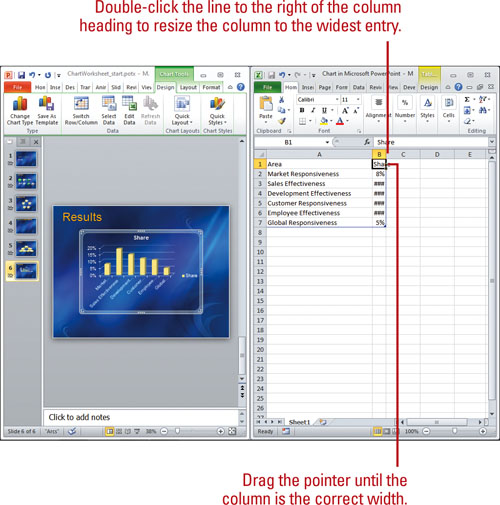
![]() To increase or decrease the width of a column, show the data in the worksheet, position the pointer on the vertical line to the right of the column heading, and then drag the pointer until the column is the correct width.
To increase or decrease the width of a column, show the data in the worksheet, position the pointer on the vertical line to the right of the column heading, and then drag the pointer until the column is the correct width.
![]() To adjust a datasheet column to display the widest data entered (also known as Best Fit), show the data in the worksheet, position the pointer on the line to the right of the column heading, and then double-click to adjust the column width.
To adjust a datasheet column to display the widest data entered (also known as Best Fit), show the data in the worksheet, position the pointer on the line to the right of the column heading, and then double-click to adjust the column width.
If a series of number signs (#) appears in a cell, it means the cell is not wide enough to display the entire cell contents. Widen the column to view the data.
Did You Know?
You can specify a precise column width. Click a cell in the column you want to format, click the Home tab, click the Cells button, click the Format button, and then click Width to enter a column width, click Standard Width to change the standard column width, or click AutoFit Selection to change the column to the smallest size possible to fit the data.
Insert Cells, Rows, and Columns
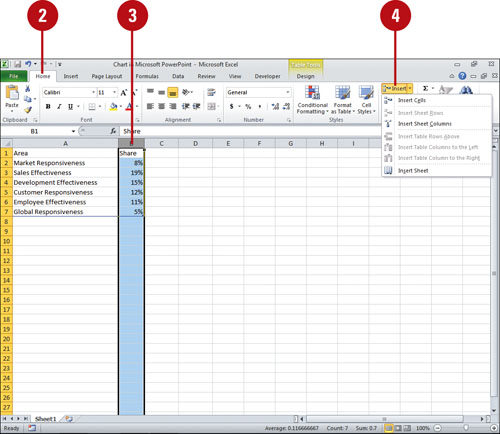
![]() In the worksheet, select the cells you want to modify.
In the worksheet, select the cells you want to modify.
![]() Click the Home tab.
Click the Home tab.
![]() Click where you want to insert cells:
Click where you want to insert cells:
![]() To insert a column, click the column heading to the right of where you want the new column.
To insert a column, click the column heading to the right of where you want the new column.
![]() To insert a row, click the row heading below where you want the new row.
To insert a row, click the row heading below where you want the new row.
![]() To insert a single cell, click an adjacent cell.
To insert a single cell, click an adjacent cell.
![]() Click the Insert Cells button arrow, and then click the insert option you want.
Click the Insert Cells button arrow, and then click the insert option you want.
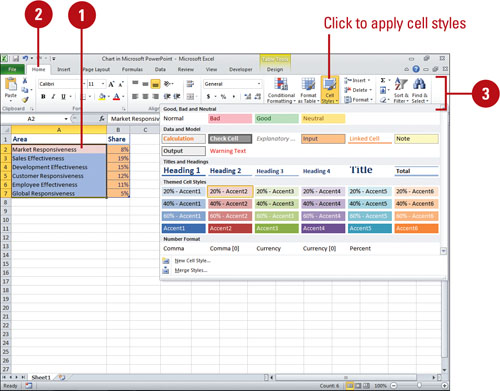
Format the Worksheet
![]() In the worksheet, select the cells you want to modify.
In the worksheet, select the cells you want to modify.
![]() Click the Home tab.
Click the Home tab.
![]() Use the options on the Ribbon to make the formatting changes you want.
Use the options on the Ribbon to make the formatting changes you want.
![]() To apply a theme, click the Cell Styles button, and then click the style you want.
To apply a theme, click the Cell Styles button, and then click the style you want.
![]() To format individual attributes, use the options in the Font and Alignment groups to make the formatting changes you want.
To format individual attributes, use the options in the Font and Alignment groups to make the formatting changes you want.
![]() To format numbers, use the options in the Number groups to make the formatting changes you want.
To format numbers, use the options in the Number groups to make the formatting changes you want.
Selecting a Chart Type, Layout and Style
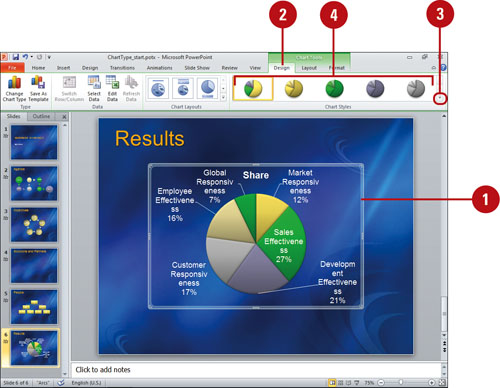
Your chart is what your audience sees, so make sure to take advantage of PowerPoint’s pre-built chart layouts and styles to make the chart appealing and visually informative. Start by choosing the chart type that is suited for presenting your data. There are a wide variety of chart types, available in 2-D and 3-D formats, from which to choose. For each chart type, you can select a predefined chart layout and style to apply the formatting you want. If you want to format your chart beyond the provided formats, you can customize a chart. Save your customized settings so that you can apply that chart formatting to any chart you create.
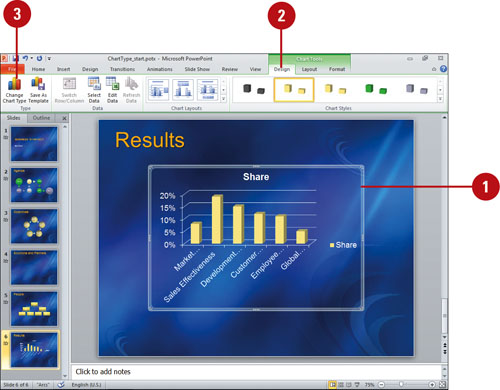
Change a Chart Type
![]() Select the chart you want to change.
Select the chart you want to change.
![]() Click the Design tab under Chart Tools.
Click the Design tab under Chart Tools.
![]() Click the Change Chart Type button.
Click the Change Chart Type button.
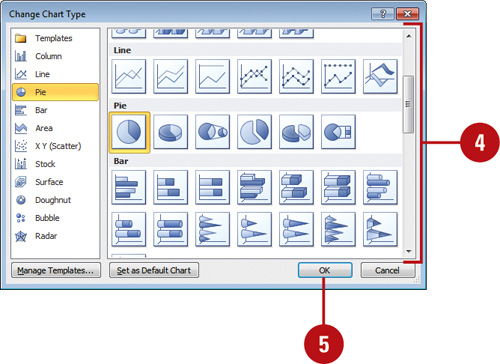
![]() Click the chart type you want.
Click the chart type you want.
![]() Click OK.
Click OK.
Did You Know?
You can reset chart formatting. Click the chart you want to reset, click the Format tab under Chart Tools, and then click Reset To Match Style.
You can delete a chart. Click the chart object, and then press Delete.
You can create macros with chart elements. When you create a macro with charts, it now can include formatting changes to charts and other objects (New!).
![]() Select the chart you want to change.
Select the chart you want to change.
![]() Click the Design tab under Chart Tools.
Click the Design tab under Chart Tools.
![]() Click the scroll up or down arrow, or click the More list arrow in the Chart Layouts group to see variations of the chart type.
Click the scroll up or down arrow, or click the More list arrow in the Chart Layouts group to see variations of the chart type.
![]() Click the chart layout you want.
Click the chart layout you want.
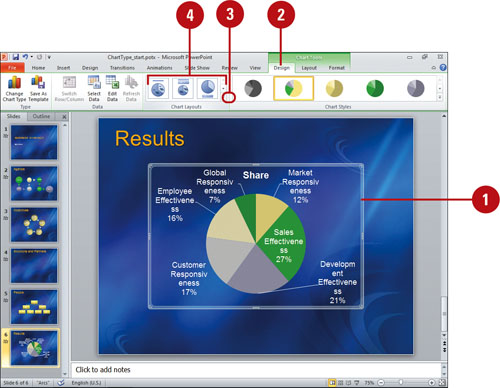
Apply a Chart Style
![]() Select the chart you want to change.
Select the chart you want to change.
![]() Click the Design tab under Chart Tools.
Click the Design tab under Chart Tools.
![]() Click the scroll up or down arrow, or click the More list arrow in the Chart Styles group to see color variations of the chart layout.
Click the scroll up or down arrow, or click the More list arrow in the Chart Styles group to see color variations of the chart layout.
![]() Click the chart style you want.
Click the chart style you want.
Formatting Chart Objects
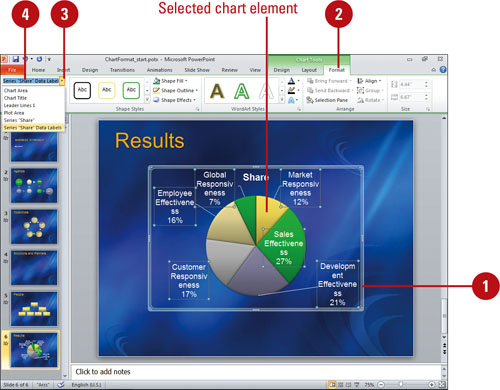
Chart objects are the individual elements that make up a chart, such as an axis, the legend, or a data series. The plot area is the bordered area where the data are plotted. The chart area is the area between the plot area and the chart object selection box. Before you can format a chart object, you need to select it first. You can select a chart object directly on the chart or use the Chart Elements list arrow on the Ribbon. Once you select a chart object, you can use options on the Format tab to modify them. In the same way you can apply shape fills, outlines, and effects to a shape, you can also apply them to shapes in a chart.
Select a Chart Object
![]() Select the chart you want to change.
Select the chart you want to change.
![]() Click the Format tab under Chart Tools.
Click the Format tab under Chart Tools.
![]() Click the Chart Elements list arrow.
Click the Chart Elements list arrow.
![]() Click the chart object you want to select.
Click the chart object you want to select.
When a chart object is selected, selection handles appear.
TIMESAVER To select a chart object, click a chart element directly in the chart.
![]() Use the Home, Design, Layout, or Format tabs to change the selected chart element.
Use the Home, Design, Layout, or Format tabs to change the selected chart element.
Did You Know?
You can quickly access chart formatting options. Double-click a chart element to open a formatting dialog box (New!).
You can enlarge a chart object to select it. Increase the zoom percentage to enlarge your view before using the mouse pointer to select chart objects.
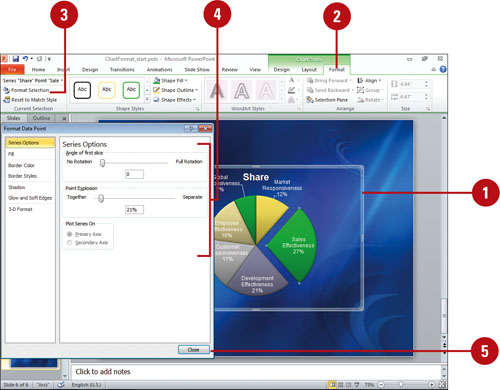
![]() Select the chart or a chart element you want to change.
Select the chart or a chart element you want to change.
When a chart object is selected, selection handles appear.
![]() Click the Format tab under Chart Tools.
Click the Format tab under Chart Tools.
![]() Click the Format Selection button.
Click the Format Selection button.
TIMESAVER Double-click a chart element to open a Format dialog box (New!).
![]() Select the options you want. The available options change depending on the chart object.
Select the options you want. The available options change depending on the chart object.
![]() Click Close.
Click Close.
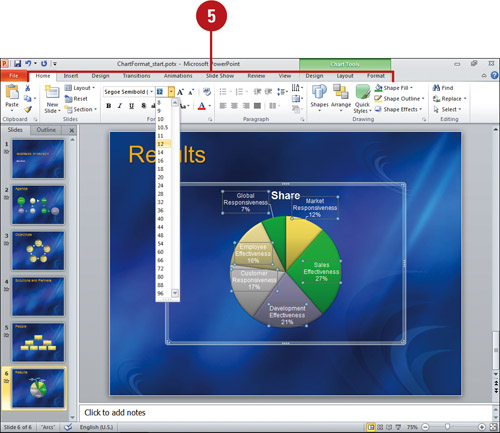
Apply Shape Styles to a Chart Object
![]() Select the chart element you want to modify.
Select the chart element you want to modify.
![]() Click the Format tab under Chart Tools.
Click the Format tab under Chart Tools.
![]() Click the Shape Fill, Shape Outline, or Shape Effects button, and then click or point to an option.
Click the Shape Fill, Shape Outline, or Shape Effects button, and then click or point to an option.
![]() Fill. Click a color, No Fill, or Picture to select an image, or point to Gradient, or Texture, and then select a style.
Fill. Click a color, No Fill, or Picture to select an image, or point to Gradient, or Texture, and then select a style.
![]() Outline. Click a color or No Outline, or point to Weight, or Dashes, and then select a style.
Outline. Click a color or No Outline, or point to Weight, or Dashes, and then select a style.
![]() Effects. Point to an effect category (Preset, Shadow, Reflection, Glow, Soft Edges, Bevel, or 3-D Rotations), and then select an option.
Effects. Point to an effect category (Preset, Shadow, Reflection, Glow, Soft Edges, Bevel, or 3-D Rotations), and then select an option.
Changing the Chart Layout Objects
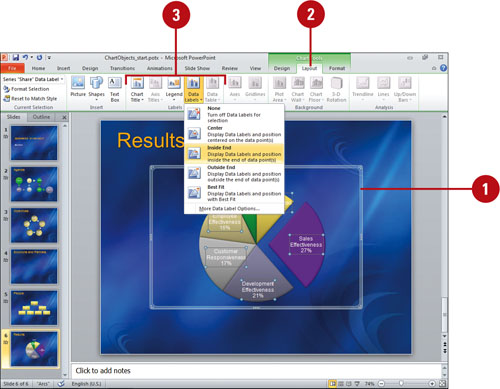
The layout of a chart typically comes with a chart title, axis titles, data labels, and a legend. However, you can also include other elements, such as data labels, and a data table. You can show, hide, or change the positions of chart elements to achieve the look you want. You can also change the chart display by showing axis or gridlines with different measurements. Format the background of a chart by showing or hiding the chart wall or floor with a default color fill, or by changing the 3-D view of a chart.
Change Chart Labels
![]() Select the chart or a chart element you want to change.
Select the chart or a chart element you want to change.
![]() Click the Layout tab under Chart Tools.
Click the Layout tab under Chart Tools.
![]() Click any of the following buttons:
Click any of the following buttons:
![]() Chart Title to show, hide, or position the chart title.
Chart Title to show, hide, or position the chart title.
![]() Axis Title to show, hide, or position the text used to label each axis.
Axis Title to show, hide, or position the text used to label each axis.
![]() Legend to show, hide, overlay, or position the chart legend.
Legend to show, hide, overlay, or position the chart legend.
![]() Data Labels to add, remove, or position data labels.
Data Labels to add, remove, or position data labels.
![]() Data Table to add a data table to the chart.
Data Table to add a data table to the chart.
For Your Information
Using Advanced Chart Analysis Techniques
PowerPoint offers a number of advanced charting techniques to create a chart with data analysis. You can add trendlines derived from regression analysis to show a trend in existing data and make predictions; create a moving average, a sequence of averages from grouped data points, that smooths the fluctuations in data so you can more easily identify trends; add error bars that express the degree of uncertainty attached to a given data series; add drawing objects, including arrows, text boxes, and pictures, to your charts; fill chart elements such as bars, areas, and surfaces with textures, imported pictures, or gradient fills; and animate bars, data points, or other chart data for added multimedia impact. To use advanced chart analysis techniques, select the chart or a chart element you want to change, click the Layout tab under Chart Tools, and then use the Trendline, Lines, Up/Down Bars, or Error Bars buttons in the Analysis group.
Did You Know?
You can insert a picture into a chart. Select the chart, click the Layout tab under Chart Tools, click the Picture button arrow, click Picture from File, or Clip Art, then select the picture you want.
You can insert a shape into a chart. Select the chart, click the Layout tab under Chart Tools, click the Shape button, click the shape you want, and then draw the shape.
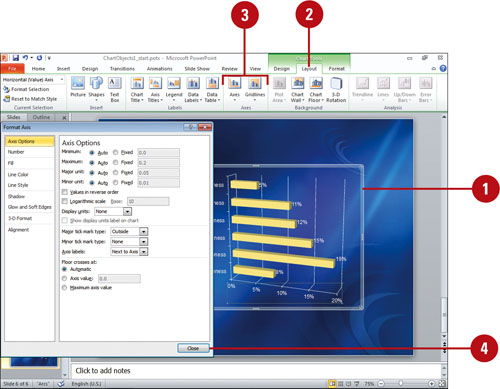
![]() Select the chart or a chart element you want to change.
Select the chart or a chart element you want to change.
![]() Click the Layout tab under Chart Tools.
Click the Layout tab under Chart Tools.
![]() Click any of the following buttons:
Click any of the following buttons:
![]() Axis to change the formatting and layout of each axis.
Axis to change the formatting and layout of each axis.
![]() Gridlines to show or hide major or minor gridlines.
Gridlines to show or hide major or minor gridlines.
![]() If necessary, select the options you want, and then click Close.
If necessary, select the options you want, and then click Close.
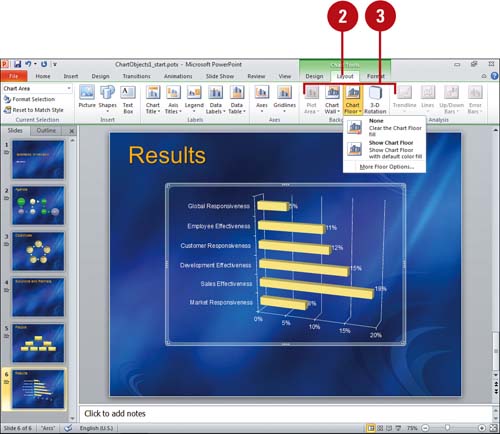
Change Chart Background
![]() Select the chart or a chart element you want to change.
Select the chart or a chart element you want to change.
![]() Click the Layout tab under Chart Tools.
Click the Layout tab under Chart Tools.
![]() Click any of the following buttons:
Click any of the following buttons:
![]() Plot Area to show or hide the plot area.
Plot Area to show or hide the plot area.
![]() Chart Wall to show or hide the chart wall with the default color fill.
Chart Wall to show or hide the chart wall with the default color fill.
![]() Chart Floor to show or hide the chart floor with the default color fill.
Chart Floor to show or hide the chart floor with the default color fill.
![]() 3-D Rotation to change the 3-D viewpoint of the chart.
3-D Rotation to change the 3-D viewpoint of the chart.
Saving a Chart Template
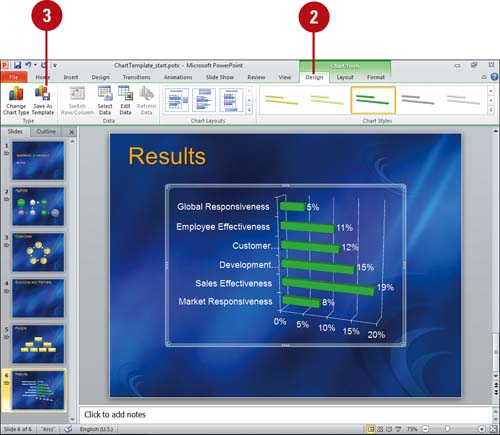
A chart template file (.crtx) saves all the customization you made to a chart for use in other presentations. You can save any chart in a presentation as a chart template file and use it to form the basis of your next presentation chart, which is useful for standard company financial reporting. Although you can store your template anywhere you want, you may find it handy to store it in the Templates/Charts folder that PowerPoint and Microsoft Office uses to store its templates. If you store your design templates in the Templates/Charts folder, those templates appear as options when you insert or change a chart type using My Templates. When you create a new chart or want to change the chart type of an existing chart, you can apply the new chart template.
Create a Custom Chart Template
![]() Click the chart you want to save as a template.
Click the chart you want to save as a template.
![]() Click the Design tab under Chart Tools.
Click the Design tab under Chart Tools.
![]() Click the Save As Template button.
Click the Save As Template button.
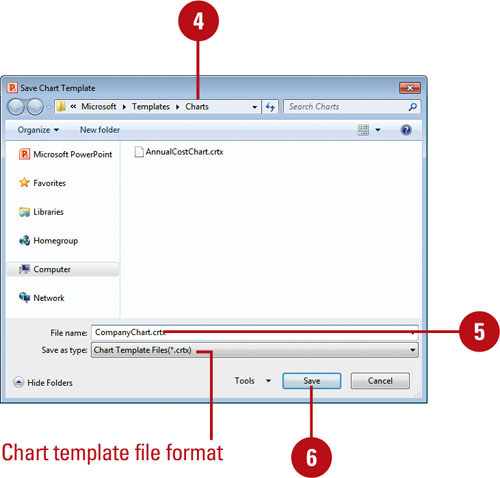
![]() Make sure the Charts folder appears in the Save in box.
Make sure the Charts folder appears in the Save in box.
Microsoft Office templates are typically stored in the following location:
Windows 7 or Vista. C:/Users/your name/AppData/Microsoft/Roaming/Templates/Charts.
Windows XP. C:/Documents and Settings/your name/Application Data/Microsoft/Templates/Charts.
![]() Type a name for the chart template.
Type a name for the chart template.
![]() Click Save.
Click Save.
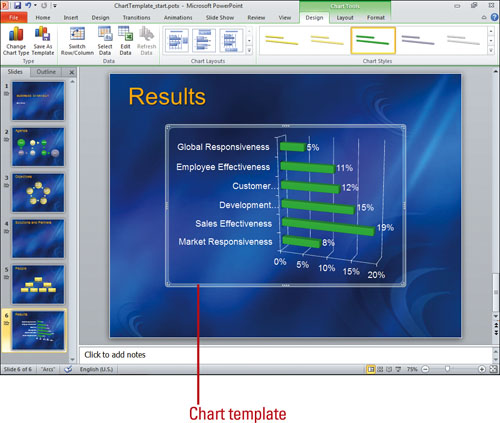
![]() Use one of the following methods:
Use one of the following methods:
![]() New chart. Click the Insert tab, and then click Insert Chart.
New chart. Click the Insert tab, and then click Insert Chart.
![]() Change chart. Select the chart you want to change, click the Design tab under Chart Tools, and then click the Change Chart Type button.
Change chart. Select the chart you want to change, click the Design tab under Chart Tools, and then click the Change Chart Type button.
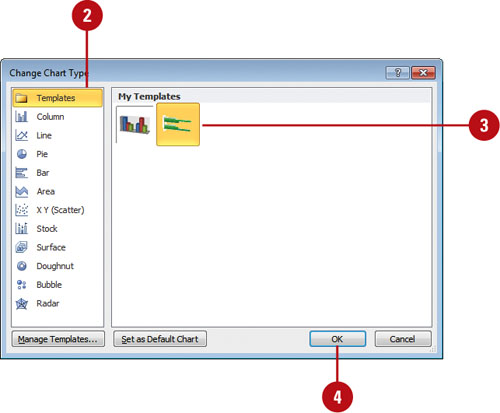
![]() In the left pane, click Templates.
In the left pane, click Templates.
![]() Click the custom chart type you want.
Click the custom chart type you want.
![]() Click OK.
Click OK.
Did You Know?
You can manage chart templates in the Charts folder. In the Chart Type dialog box, you can click the Manage Templates button to open the Charts folder and move, copy, or delete chart templates (.crtx). When you’re done, click the Close button to return back to the Chart Type dialog box, and then click Cancel.
You can set a chart as the default. If you use the same chart template over and over again, you can set a chart as the default when creating a new chart. In the Chart Type dialog box, click Template in the left pane, select the chart you want to use, click Set As Default Chart, and then click Cancel.
Inserting a Table
A table neatly organizes information into rows and columns, now up to a maximum of 75x75. The intersection of a column and row is called a cell. Enter text into cells just as you would anywhere else in PowerPoint, except that pressing the Tab key moves you from one cell to the next. PowerPoint tables behave much like tables in Word. You can insert tables by specifying a size, or drawing rows and columns to create a custom table. If you like to use Microsoft Excel worksheets, you can also insert and create an Excel table in your presentation.
Insert a Table Quickly
![]() In Normal view, display the slide to which you want to add a table.
In Normal view, display the slide to which you want to add a table.
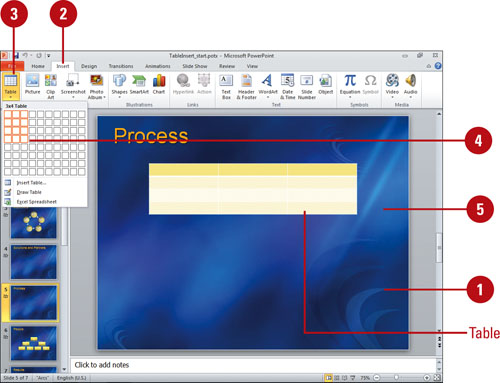
![]() Click the Insert tab.
Click the Insert tab.
![]() Click the Table button, and then drag to select the number of rows and columns you want, or click Insert Table, enter the number of columns and rows you want, and then click OK.
Click the Table button, and then drag to select the number of rows and columns you want, or click Insert Table, enter the number of columns and rows you want, and then click OK.
![]() Release the mouse button to insert a blank grid in the document.
Release the mouse button to insert a blank grid in the document.
![]() When you’re done, click outside of the table.
When you’re done, click outside of the table.
Draw a Table
![]() In Normal view, display the slide to which you want to add a table.
In Normal view, display the slide to which you want to add a table.
![]() Click the Insert tab.
Click the Insert tab.
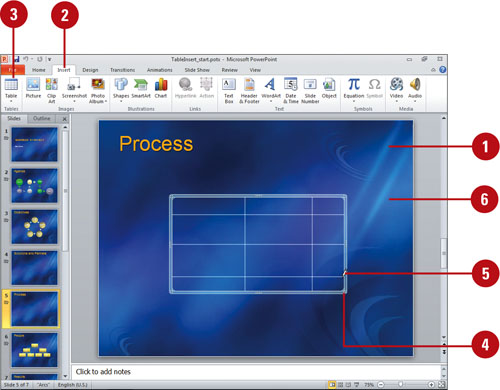
![]() Click the Table button, and then click Draw Table.
Click the Table button, and then click Draw Table.
![]() Drag the table size you want.
Drag the table size you want.
![]() Drag horizontal lines to create rows and vertical lines to create columns.
Drag horizontal lines to create rows and vertical lines to create columns.
![]() When you’re done, click outside of the table.
When you’re done, click outside of the table.
![]() In Normal view, display the slide to which you want to add a table.
In Normal view, display the slide to which you want to add a table.
![]() Click the Insert tab.
Click the Insert tab.
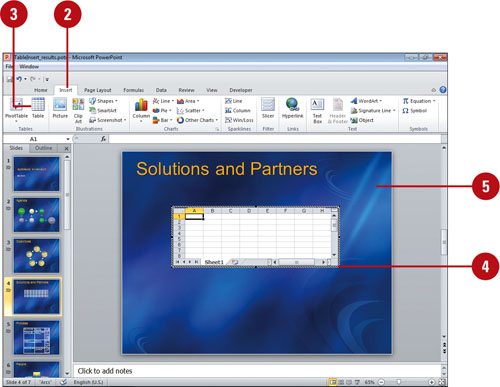
![]() Click the Table button, and then click Insert Excel Spreadsheet.
Click the Table button, and then click Insert Excel Spreadsheet.
An Excel worksheet appears on your slide.
![]() If necessary, drag the lower-right corner sizing handle to enlarge the size of the worksheet.
If necessary, drag the lower-right corner sizing handle to enlarge the size of the worksheet.
![]() When you’re done, click outside of the table.
When you’re done, click outside of the table.
Enter Text and Move Around a Table
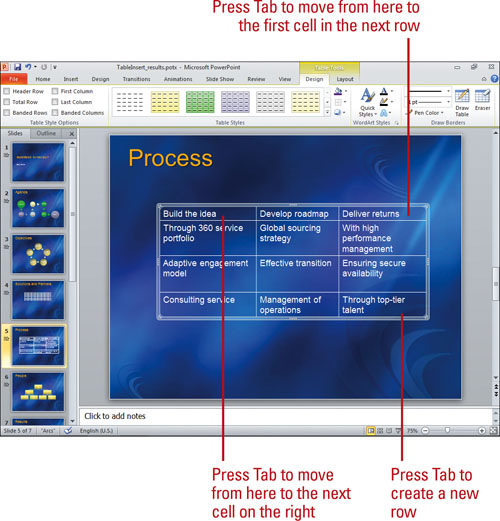
The insertion point shows where text you type will appear in a table. Choose one of the following after you type text in a cell.
![]() Press Enter to start a new paragraph within that cell.
Press Enter to start a new paragraph within that cell.
![]() Press Tab to move the insertion point to the next cell to the right (or to the first cell in the next row).
Press Tab to move the insertion point to the next cell to the right (or to the first cell in the next row).
![]() Use the arrow keys or click anywhere in the table to move the insertion point to a new location.
Use the arrow keys or click anywhere in the table to move the insertion point to a new location.
Modifying a Table
After you create a table or begin to enter text in one, you might want to add more rows or columns to accommodate the text you are entering in the table. PowerPoint makes it easy for you to format your table. You can change the alignment of the text in the cells (by default, text is aligned on the left of a cell). You can also modify the appearance and size of the cells and the table.
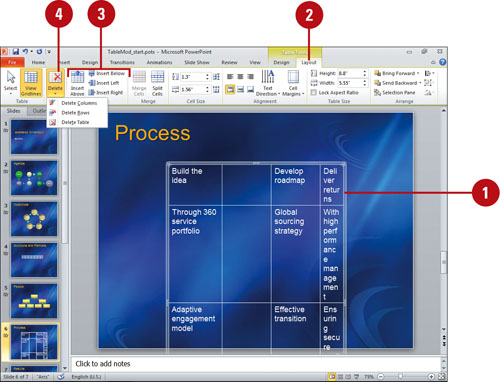
Insert and Delete Columns and Rows
![]() Click in a table cell next to where you want the new column or row to appear.
Click in a table cell next to where you want the new column or row to appear.
![]() Click the Layout tab under Table Tools.
Click the Layout tab under Table Tools.
![]() To insert columns and rows, click the Insert Above, Insert Below, Insert Left, or Insert Right buttons.
To insert columns and rows, click the Insert Above, Insert Below, Insert Left, or Insert Right buttons.
![]() To delete columns and rows, click the Delete button, and then click Delete Columns or Delete Rows.
To delete columns and rows, click the Delete button, and then click Delete Columns or Delete Rows.
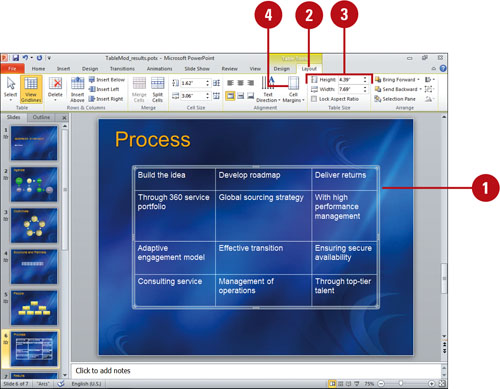
Change Cells Margins and Table Sizes
![]() Select the text you want to align in the cells, rows, or columns.
Select the text you want to align in the cells, rows, or columns.
![]() Click the Layout tab under Table Tools.
Click the Layout tab under Table Tools.
![]() To resize the table manually, drag a corner or middle resize handle.
To resize the table manually, drag a corner or middle resize handle.
To set a specific size for the table, click the Table Size button, and then specify a height and width. To keep the size proportional, select the Lock Aspect Ratio check box.
![]() To change margins, click the Cell Margins button, and then click a cell size margin option: Normal, None, Narrow, Wide, or Custom Margins.
To change margins, click the Cell Margins button, and then click a cell size margin option: Normal, None, Narrow, Wide, or Custom Margins.
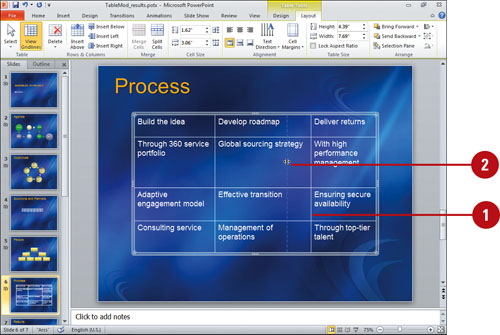
Adjust Row Height and Column Width
![]() Move the pointer over the boundary of the row or column you want to adjust until the pointer changes into a resizing pointer.
Move the pointer over the boundary of the row or column you want to adjust until the pointer changes into a resizing pointer.
![]() Drag the boundary to adjust the row or column to the size you want.
Drag the boundary to adjust the row or column to the size you want.
Did You Know?
You can merge or split cells. Select the cells you want to merge or the cell you want to split, and then click the Merge Cells or Split Cells button in the Merge group on the Layout tab.
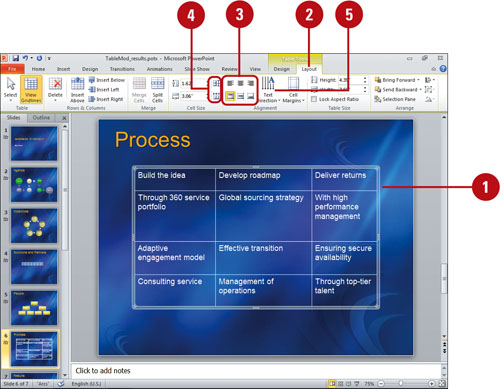
Align Text Within Cells, Rows, and Columns
![]() Select the text you want to align in the cells, rows, or columns.
Select the text you want to align in the cells, rows, or columns.
![]() Click the Layout tab under Table Tools.
Click the Layout tab under Table Tools.
![]() To align text in a cell, row or column, click one of the alignment buttons in the Alignment group: Align Left, Center, Align Right, Align Top, Center Vertically, or Align Bottom.
To align text in a cell, row or column, click one of the alignment buttons in the Alignment group: Align Left, Center, Align Right, Align Top, Center Vertically, or Align Bottom.
![]() To evenly distribute the height and width of the selected row and columns, select the row or column, and then click Distribute Rows or Distribute Columns.
To evenly distribute the height and width of the selected row and columns, select the row or column, and then click Distribute Rows or Distribute Columns.
![]() To change the direction of text in a cell, select a cell, row or column, click the Text Direction button, and then select an option.
To change the direction of text in a cell, select a cell, row or column, click the Text Direction button, and then select an option.
Formatting a Table
When you create a table, you typically include a header row or first column to create horizontal or vertical headings for your table information. You can use Quick Style options, such as a header or total row, first or last column, or banded rows and columns, to show or hide a special row and column formatting. The Total Row option displays a row at the end of the table for column totals. The Banded Row or Banded Column option formats even rows or columns differently from odd rows or columns to make a table easier to view. You can also insert a picture into a table to create a more polished look.
Format Table Columns
![]() Click the table you want to change.
Click the table you want to change.
![]() Click the Design tab under Table Tools.
Click the Design tab under Table Tools.
![]() Select any of the following row and column check box options:
Select any of the following row and column check box options:
![]() First Column to format the first column of the table as special.
First Column to format the first column of the table as special.
![]() Last Column to format the last column of the table as special.
Last Column to format the last column of the table as special.
![]() Banded Column to format even columns differently than odd columns.
Banded Column to format even columns differently than odd columns.

Format Table Rows
![]() Click the table you want to change.
Click the table you want to change.
![]() Click the Design tab under Table Tools.
Click the Design tab under Table Tools.
![]() Select any of the following row and column check box options:
Select any of the following row and column check box options:
![]() Header Row to format the top row of the table as special.
Header Row to format the top row of the table as special.
![]() Total Row to format the bottom row of the table for column totals.
Total Row to format the bottom row of the table for column totals.
![]() Banded Rows to format even rows differently than odd rows.
Banded Rows to format even rows differently than odd rows.
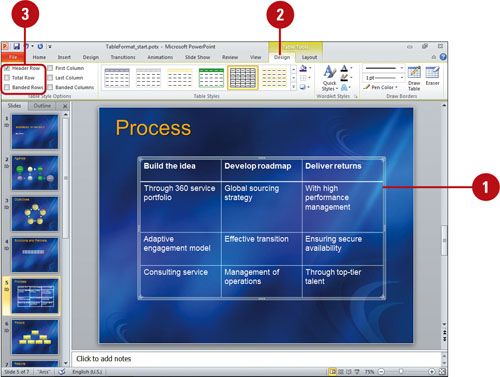
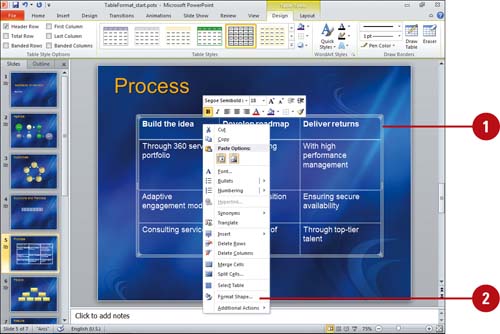
![]() Select the cells where you want to insert a picture, and then right-click one of the selected cells.
Select the cells where you want to insert a picture, and then right-click one of the selected cells.
![]() Click Format Shape.
Click Format Shape.
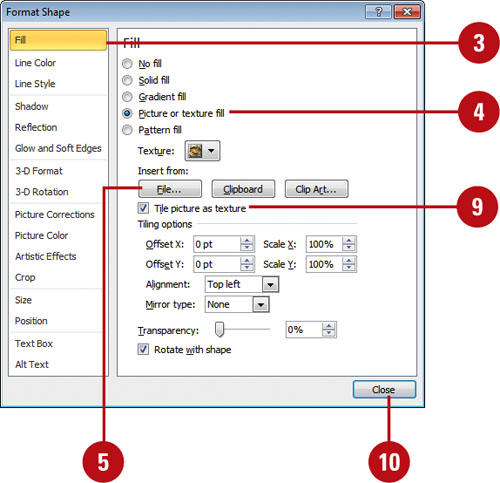
![]() In the left pane, click Fill.
In the left pane, click Fill.
![]() Click the Picture or texture fill option.
Click the Picture or texture fill option.
![]() Click File.
Click File.
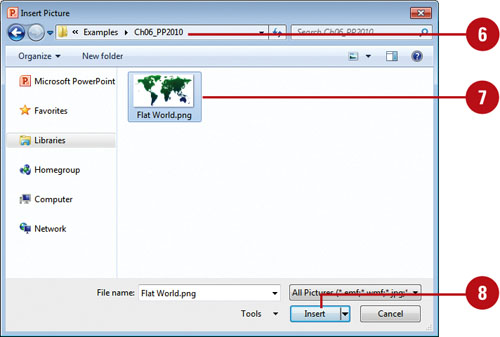
![]() Click the Look in list arrow, and then select the drive and folder that contain the file you want to insert.
Click the Look in list arrow, and then select the drive and folder that contain the file you want to insert.
![]() Click the file you want to insert.
Click the file you want to insert.
![]() Click Insert.
Click Insert.
![]() Select or clear the Tile picture as texture check box.
Select or clear the Tile picture as texture check box.
![]() Click Close.
Click Close.
Did You Know?
You can add or remove lines from a table. Select the table you want to change, and then click the Design tab under Table Tools. In the Draw Borders group, select a pen style, weight, and color. Click the Draw Table button, and then drag the pencil pointer from one boundary to another to add cells. Click the Eraser button, and then click on a border to erase a cell. Press ESC when you’re done.
You can show or hide gridlines in a table. Select the table you want to change, click the Layout tab under Table Tools, and then click View Gridlines to toggle it on and off.
Adding a Quick Style to a Table
Instead of changing individual attributes of a table, such as shape, border, and effects, you can quickly add them all at once with the Table Quick Style gallery. The Table Quick Style gallery provides a variety of different formatting combinations. To quickly see if you like a Table Quick Style, point to a thumbnail in the gallery to display a live preview of it in the selected shape. If you like it, you can apply it. In addition to applying one of the preformatted tables from the Table Quick Style gallery, you can also create your own style by shaping your text into a variety of shapes, curves, styles, and color patterns.
Add a Quick Style to a Table
![]() Click the table you want to change, or select the cells you want to modify.
Click the table you want to change, or select the cells you want to modify.
![]() Click the Design tab under Table Tools.
Click the Design tab under Table Tools.
![]() Click the scroll up or down arrow, or click the More list arrow in the Table Styles group to see additional styles.
Click the scroll up or down arrow, or click the More list arrow in the Table Styles group to see additional styles.
The current style appears highlighted in the gallery.
TIMESAVER Click the gallery title bar arrow to narrow down the list of styles: All, Document Matching, Light, Medium, or Dark.
![]() Point to a style.
Point to a style.
A live preview of the style appears in the current shape.
![]() Click the style you want from the gallery to apply it to the selected table.
Click the style you want from the gallery to apply it to the selected table.
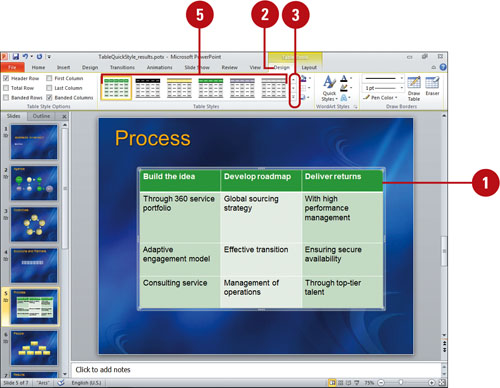
Did You Know?
You can clear table formatting. Select the table you want to change, click the Design tab under Table Tools, click the More list arrow in the Table Styles group, and then click Clear Table.
![]() Click the table you want to change, or select the cells you want to modify.
Click the table you want to change, or select the cells you want to modify.
![]() Click the Design tab under Table Tools.
Click the Design tab under Table Tools.
![]() Click the Shading button, and then click or point to one of the following:
Click the Shading button, and then click or point to one of the following:
![]() Color to select a theme or standard color.
Color to select a theme or standard color.
![]() Picture to select a picture file.
Picture to select a picture file.
![]() Gradient to select No Gradient, one of the shadow types, or More Gradients.
Gradient to select No Gradient, one of the shadow types, or More Gradients.
![]() Texture to select one of the texture types, or More Textures.
Texture to select one of the texture types, or More Textures.
![]() Table Background to select a theme or standard color.
Table Background to select a theme or standard color.
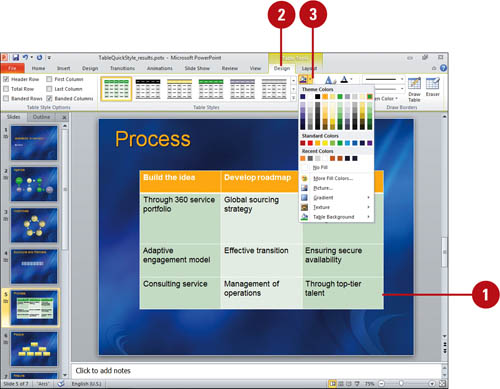
Apply an Outline to a Table
![]() Click the table you want to change, or select the cells you want to modify.
Click the table you want to change, or select the cells you want to modify.
![]() Click the Design tab under Table Tools.
Click the Design tab under Table Tools.
![]() Click the Border button.
Click the Border button.
![]() Click a border option, such as No Border, All Borders, Outside Borders, Inside Horizontal Border, Inside Vertical Border, Diagonal Down Border, or Diagonal Up Border.
Click a border option, such as No Border, All Borders, Outside Borders, Inside Horizontal Border, Inside Vertical Border, Diagonal Down Border, or Diagonal Up Border.
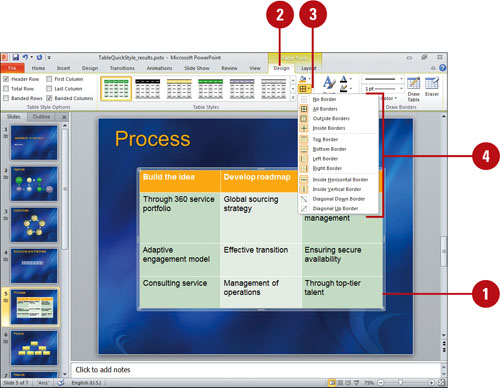
Applying Effects to a Table
You can change the look of a table by applying effects, such as shadows, reflections, glow, soft edges, 3-D rotations, and transformations. Apply effects to a table by using the Table Effects gallery for quick results. From the Table Effects gallery you can apply a built-in combination of 3-D effects or individual effects to a table. To quickly see if you like the effect, point to a thumbnail in the Table Effects gallery to display a live preview of it. If you like it, you can apply it. If you no longer want to apply the effect, you can remove it. Simply, select the table, point to the effect type on the Table Effects gallery, and then select the No effect type option.
Apply an Effect to a Text
![]() Click the table you want to change.
Click the table you want to change.
![]() Click the Design tab under Table Tools.
Click the Design tab under Table Tools.
![]() Click the Tables Effects button, and then point to one of the following:
Click the Tables Effects button, and then point to one of the following:
![]() Cell Bevel to select No Bevel or one of the bevel variations.
Cell Bevel to select No Bevel or one of the bevel variations.
![]() Shadow to select No Shadow, one of the shadow types (Outer or Inner), or Shadows Options.
Shadow to select No Shadow, one of the shadow types (Outer or Inner), or Shadows Options.
![]() Reflection to select No Reflection, one of the Reflection Variations, or Reflection Options (New!).
Reflection to select No Reflection, one of the Reflection Variations, or Reflection Options (New!).
When you point to an effect, a live preview of the style appears in the current shape.
![]() Click the effect you want from the gallery to apply it to the selected shape.
Click the effect you want from the gallery to apply it to the selected shape.
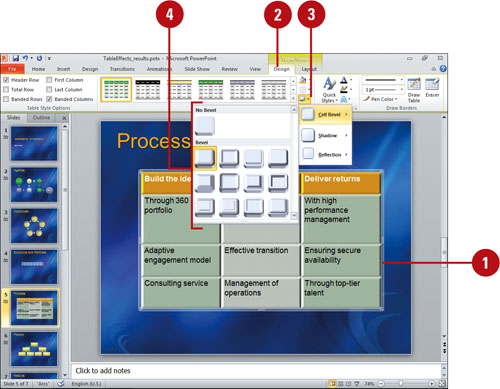
Sharing Information Among Documents
Object linking and embedding (OLE) is a familiar innovation in personal computing. OLE lets you insert an object created in one program into a document created in another program. Terms that you’ll find useful in understanding how you can share objects among documents include:
Embedding and Linking

For example, if you place an Excel chart in your PowerPoint presentation, Excel is the source program and PowerPoint is the destination program. The chart is the source file; the presentation is the destination file. There are three ways to share information in Windows programs: pasting, embedding, and linking.
Pasting
You can cut or copy an object from one document and then paste it into another using the Cut, Copy, and Paste commands on the source and destination program ribbons.
Embedding
When you embed an object, you place a copy of the object in the destination file, and when you activate the object, the tools from which it was created (the source program) become available in your presentation. For example, if you insert and then click an Excel chart in your PowerPoint presentation, the Excel ribbon replaces the PowerPoint ribbon, so you can edit the chart if necessary. With embedding, any changes you make to the chart in the presentation do not affect the original file.
Linking
When you link an object, you insert a representation of the object itself into the destination file. The tools of the source program are available, and when you use them to edit the object you’ve inserted, you are actually editing the source file. Moreover, any changes you make to the source file are reflected in the destination file. You can edit the linked object from either file, although changes are stored in the source file. For example, you might link an Excel chart to a Word document and a PowerPoint slide so you can update the chart from any of the files. If you break the link between a linked object and its source file, the object becomes embedded.
Embedding and Linking an Object
You can embed or link objects in several ways. If you are creating a new object you want to embed or link, use the Insert Object button. If you want to embed an existing file, you can also use Insert Object and specify whether you want to also link the object. If your object is already open in its source program, you can copy the object, and in some cases, paste it onto a slide, automatically embedding it. Finally, you can use the Paste Special command to paste link a copied object—pasting and linking it at the same time.
Insert a New Object
![]() Click the Insert tab, and then click the Insert Object button.
Click the Insert tab, and then click the Insert Object button.
![]() Click the Create new option.
Click the Create new option.
![]() Click the type of object you want to insert.
Click the type of object you want to insert.
![]() Click OK.
Click OK.
![]() Use the source program tools to edit the object.
Use the source program tools to edit the object.
![]() When you’re done, click outside the object.
When you’re done, click outside the object.
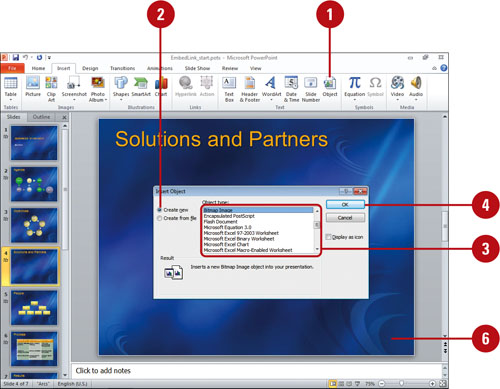
Insert a File
![]() Click the Insert tab, and then click the Insert Object button.
Click the Insert tab, and then click the Insert Object button.
![]() Click the Create from file option.
Click the Create from file option.
![]() Click Browse.
Click Browse.
![]() Click the Look in list arrow, and then select the file you want to insert, and then click OK.
Click the Look in list arrow, and then select the file you want to insert, and then click OK.
![]() To embed the object, clear the Link check box, if necessary. To link it, select the Link check box.
To embed the object, clear the Link check box, if necessary. To link it, select the Link check box.
![]() Click OK.
Click OK.
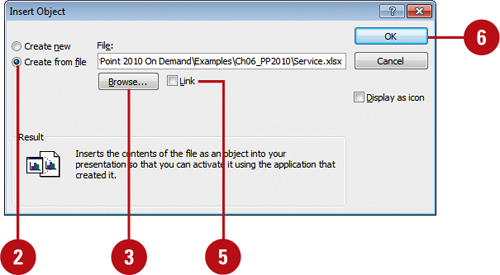
![]() In the source program, select the object you want to paste link.
In the source program, select the object you want to paste link.
![]() Click the Home tab.
Click the Home tab.
![]() Click the Cut or Copy button.
Click the Cut or Copy button.
![]() Switch to your presentation.
Switch to your presentation.
![]() Click the Home tab.
Click the Home tab.
![]() Click the Paste button arrow, and then click Paste Special.
Click the Paste button arrow, and then click Paste Special.
![]() Click the Paste link option.
Click the Paste link option.
![]() Click the object type you want.
Click the object type you want.
![]() Click OK.
Click OK.
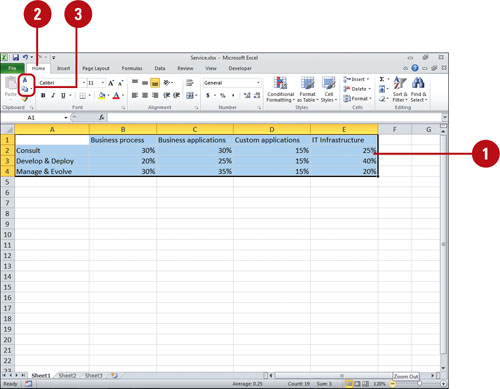
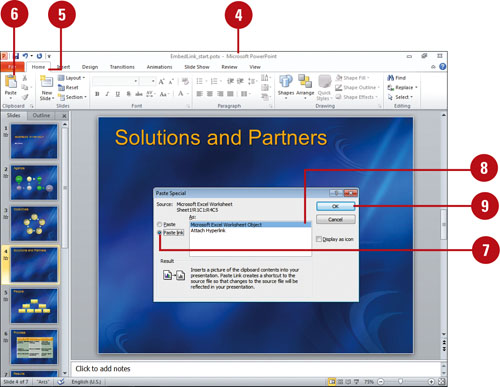
Did You Know?
You can paste text in different formats.
The Paste Special command allows you to paste text on the Clipboard to other parts of a presentation or other documents in different formats: HTML Format, Formatted Text (RTF), or Unformatted Text.
You can insert objects as icons. In the Insert Object dialog box, select the Display As Icon check box. If you insert an object as an icon, you can double-click the icon to view the object. This is especially handy for kiosk presentations.
You can work with embedded objects. If you click an embedded object, you simply select it. You can then resize it in PowerPoint. If you double-click an embedded object, you activate it and the source toolbars and menus appear.
Modifying Links
When you modify a linked object, it is usually updated in the destination document. However, if it doesn’t automatically update, you can update the link manually. All Office 2010 programs give you some control over the links you have established. You can convert a linked object to another object type. The convert to object types vary depending on the source type.
Edit a Linked Object
![]() Open the presentation that contains the links you want to update.
Open the presentation that contains the links you want to update.
![]() Double-click the object.
Double-click the object.
The source program opens.
![]() Make changes you want.
Make changes you want.
![]() Click the File tab (or File menu, depending on the program), and then click Exit (or Exit program name).
Click the File tab (or File menu, depending on the program), and then click Exit (or Exit program name).
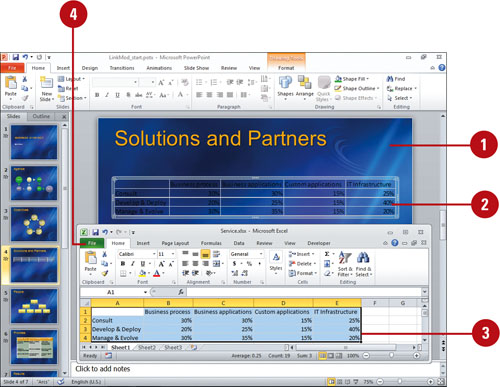
Did You Know?
You can change the source of a linked object. Double-click the linked object to open it, close the original file, open a new one, place the data you want in the file, and then save and exit the source program.
You can update the source of a linked object. Open the source file directly from the source program (not through PowerPoint), make the changes you want, and then save and exit the program. Open PowerPoint with the linked object. Double-click the object, and then exit the program to update the object in PowerPoint.
![]() Right-click the linked object whose file type you want to convert.
Right-click the linked object whose file type you want to convert.
![]() Point to Linked x Object, where x is Worksheet, Equation, or some file type, depending on the object type.
Point to Linked x Object, where x is Worksheet, Equation, or some file type, depending on the object type.
![]() Click Convert.
Click Convert.
![]() Click the new object type you want.
Click the new object type you want.
![]() Click OK.
Click OK.
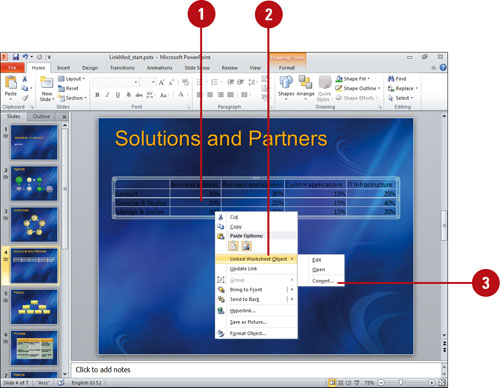
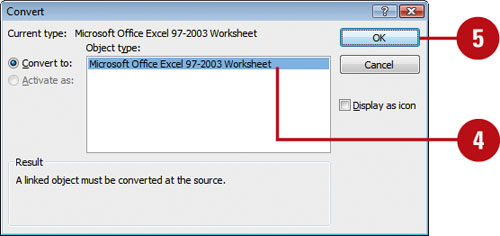
Did You Know?
You can reconnect a broken link. After you break the connection to a linked object, you must reinsert the object into your presentation to reconnect.
For Your Information
Reducing the Size of Embedded Objects
If you no longer need to edit an embedded object, you can reduce the size of the object in PowerPoint by removing the OLE related data and compressing the picture. OLE objects include a Windows® Metafile (WMF) picture of the image. PowerPoint normally compresses images very efficiently, but it can’t compress images in WMFs, so copying and pasting or dragging images into your files can make your files quite large. To remove the OLE data, right-click the embedded object, point to Grouping on the shortcut menu, and then click Ungroup. Next, right-click the image again, point to Grouping on the shortcut menu, and then click Regroup. Ungrouping throws away the OLE data and leaves just the picture in a form that PowerPoint can now compress. Remember, once you ungroup the embedded object, you cannot restore the OLE data without creating a new embedded object.
Inserting a Microsoft Excel Chart
If you need to create chart for backwards compatibility with Power-Point 97-2003, you can embed an Excel object for Excel 97-2003. An embedded object is an object that maintains a direct connection to its original program, known as the source program. After you insert an embedded object, you can easily edit it by double-clicking it, which opens the program in which it was originally created. Embedding objects increases the file size of a presentation because the embedded object is stored in the presentation. To reduce the file size of the presentation, you can link an object instead of embedding it. A linked object appears in the slide, but it actually contains a “link” back to the original file, known as the source document. When you link an object, the original object is stored in its source document, where it was created. You must have Microsoft Excel installed on your computer to insert an Excel chart or worksheet.
Insert a New Excel Chart
![]() Click the Insert tab, and then click the Insert Object button.
Click the Insert tab, and then click the Insert Object button.
![]() Click the Create new option.
Click the Create new option.
![]() Click Microsoft Excel Chart.
Click Microsoft Excel Chart.
![]() Click OK.
Click OK.
![]() Use the source program tools to edit the object.
Use the source program tools to edit the object.
![]() When you’re done, click outside the object.
When you’re done, click outside the object.
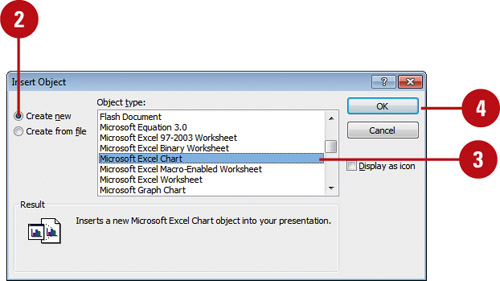

Did You Know?
You can drag a chart from Excel to PowerPoint. Open both Excel and PowerPoint, select the chart in Excel, and then drag it into PowerPoint. If the PowerPoint presentation is not visible, drag the chart to the presentation button on the taskbar to display PowerPoint.
Import a Microsoft Excel Worksheet or Chart
![]() Display the slide on which you want to insert the Excel chart.
Display the slide on which you want to insert the Excel chart.
![]() Click the Insert tab, and then click the Insert Object button.
Click the Insert tab, and then click the Insert Object button.
![]() Click the Create from file option, click the Browse button, locate and select the chart you want, and then click OK.
Click the Create from file option, click the Browse button, locate and select the chart you want, and then click OK.
![]() To link the chart, click the Link check box.
To link the chart, click the Link check box.
![]() Click OK.
Click OK.
![]() If necessary, edit the worksheet using the Excel tools.
If necessary, edit the worksheet using the Excel tools.
![]() When you’re done, click outside the worksheet.
When you’re done, click outside the worksheet.

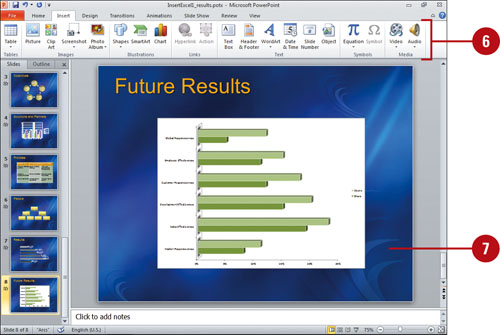
Inserting a Microsoft Word Document
If you need to create a chart for backwards compatibility with Power-Point 97-2003, you can embed a Word document object for Word 97-2003. You can insert a Microsoft Word table into PowerPoint by inserting the document as an embedded object in a slide. When you insert a new or existing Word document, a Microsoft Word document appears on the PowerPoint slide. Double-click your embedded object to open Word and edit the document. A Ribbon will also open which assists you in creating and formatting the document. You must have Microsoft Word installed on your computer to insert a Word document.
Insert a Word Document
![]() Click the Insert tab, and then click the Insert Object button.
Click the Insert tab, and then click the Insert Object button.
![]() Click the Create new option, and then click Microsoft Word 97-2003 Document, or click the Create from file option, click the Browse button, and then locate and select the file you want.
Click the Create new option, and then click Microsoft Word 97-2003 Document, or click the Create from file option, click the Browse button, and then locate and select the file you want.
![]() Click OK.
Click OK.
![]() Double-click the Word object, if necessary.
Double-click the Word object, if necessary.
A Microsoft Word document opens in the PowerPoint slide.
![]() Use the commands on the Ribbon to create or modify the document that you want.
Use the commands on the Ribbon to create or modify the document that you want.
![]() When you’re done, click outside of the object.
When you’re done, click outside of the object.
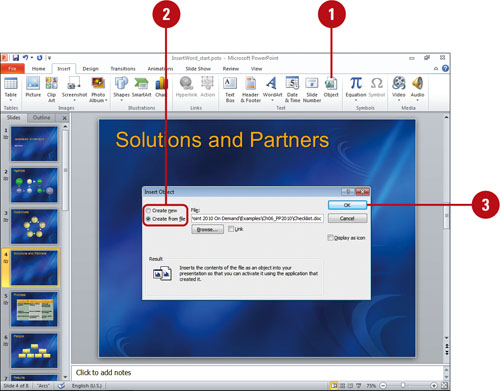
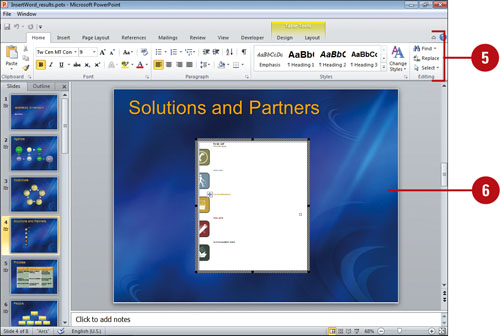
See Also
See “Sharing Information Among Documents” on page 247 for more information about an embedded object.
Inserting a Microsoft Organization Chart
If you need to match an existing organization chart from a previous version of PowerPoint, create a chart layout for Co-Manager, Vertical, and Multiple Manager, or need backwards compatible with PowerPoint 97-2003, then Microsoft Organization Chart is your best choice. Microsoft Organization Chart is an add-in for Microsoft Office programs, which you need to install using the Add or Remove Features option in Office setup. You can insert an Organization Chart using the Insert Object button on the Insert tab. When you create an organization chart, a sample chart appears. You can add text, add shapes, and format the chart boxes and connecting lines.
Create an Organization Chart Using an Embedded Object
![]() Click the Insert tab, and then click the Insert Object button.
Click the Insert tab, and then click the Insert Object button.
![]() Click the Create new option.
Click the Create new option.
![]() Click Organization Chart Add-in for Microsoft Office Programs.
Click Organization Chart Add-in for Microsoft Office Programs.
![]() Click OK.
Click OK.
![]() To add text, click a chart box, and then type a name or text you want.
To add text, click a chart box, and then type a name or text you want.
![]() Click the chart box to which you want to attach the new chart box.
Click the chart box to which you want to attach the new chart box.
![]() Click the Chart box button on the toolbar you want.
Click the Chart box button on the toolbar you want.
![]() Subordinate. Places the shape below the selected shape and connects it to the shape.
Subordinate. Places the shape below the selected shape and connects it to the shape.
![]() Coworker. Places the shape next to the selected shape and connects it to the shape.
Coworker. Places the shape next to the selected shape and connects it to the shape.
![]() Manager. Places the shape above the selected shape as the manager.
Manager. Places the shape above the selected shape as the manager.
![]() Assistant. Places the shape below the selected shape with an elbow connector.
Assistant. Places the shape below the selected shape with an elbow connector.
![]() When you’re done, click the Close button on the window.
When you’re done, click the Close button on the window.
![]() To edit the organization chart, double-click it.
To edit the organization chart, double-click it.