Chapter 7
Experience
One of the most astute Amazon.com reviews for this book was not intended as a compliment—the reviewer said Mind Over Markets was “too complicated.” Those two words capture the reason why most traders fail, as well as the reason why the book in your hands is still relevant, challenging, and insightful after two decades: It was written for serious traders, and it doesn't purport to be a total solution.
Mind Over Markets is a practical handbook for developing an understanding of market behavior that will help you trade with the odds in your favor. And in the 22 years since it was published (and translated into Chinese and French) the authors have continued on their journeys, delving deeper into practical experience. And so it is experience that this final, fresh chapter is all about; we'll bring the book learning in the preceding chapters into the light of real experience, where real money is won and lost in the market's endless heaving to and fro. The examples we'll employ are simply meant to provide context for the content—the synthesis of the five stages of learning can only happen in practice.
Set Aside Your Expectations
Traders, being human, want markets to be orderly and easily understandable. But if you start with that expectation then you're off on the wrong foot. We're all prone to seeking only what we're looking for, which keeps us from being present for what is actually happening.
Being free from all distractions, he can undertake his practice wholeheartedly. Practice combined with non-attachment helps him to continue his search until he reaches the goal.
—Swami Rama
To be successful, you must set aside your desires and expectations. You've got to get inside the head of the people you're competing against. How gruesome does it feel to get caught short? How would that feeling manifest itself in a herd of day traders? So much of trading today is about momentum, which can offer invaluable insight when considered in the proper context.
After you understand how markets operate—not as orderly and scientific as you'd like—then you've got to figure out how your own head operates. You can have all the market knowledge in the world, but if you don't understand the ways in which rationalization can be a powerful gravitational force, then market knowledge might not help you.
Trading is a game. And if you can figure out what's going on in your head, and in the heads of your competitors, you're more likely to win.
Mind Over Markets in Profile
In 2007, 15 years following the publication of our original work, we published Markets in Profile: Profiting from the Auction Process, which examines the market's continuous two-way auction process by taking a profoundly different approach toward sorting and understanding the differences in behavior between the various timeframes:
Seemingly knowledgeable experts routinely maintain that there is a buyer for every seller, and a seller for every buyer. This simple utterance sets up a mental block that impedes a real understanding of the auction process; actionable reality begins with understanding the relationships and behavioral expectations among the timeframes. While it is true that there is a buyer for every seller, the buyers and sellers are not evenly matched—they are operating in different timeframes, which means their actions have different weight.
It is imbalance between the timeframes that drives the auction process.
The longest timeframe, for example, most commonly transacts with the day, or short-term timeframes, that are considered to be “weaker hands” and less committed to holding inventory. When this occurs, the inventory for the shorter timeframes often gets out of balance, which leads to short-covering rallies or long-liquidation breaks. This is the ebb and flow of the market's tides.
Markets in Profile offers a deeper dive into the behavior of each of the separate timeframes. The book revolves around a central idea: Information has no impact until individuals act on that information. There are as many responses to any given piece of information as there are humans who receive it; we all find ourselves somewhere on the long continuum between leader and follower, in every endeavor.
To illustrate the importance of this concept, consider what would happen if you were to simultaneously share a perfect investment idea with five different people. One of those five might act immediately, without requiring further evidence, while each of the remaining four would act in successively later time periods, waiting to see proof that the idea was, in fact, generating profits. The Diffusion Model, made popular by Malcolm Gladwell in The Tipping Point: How Little Things Can Make a Big Difference (Boston: Little, Brown, 2000), would label each of these individuals, in succession, as:
These five archetypes can help us better understand the way various timeframes' interactions influence the market's auction process. Once the laggards have transacted, for example, the market is generally prepared to begin to auction in the opposite direction. If a market has been rising, the top of the rally may be drawing in new laggard longs, as well as laggard shorts that are finally covering.
Market-Understanding and Self-Understanding
Many successful traders we've worked with over the years have expressed a common opinion: Once they've gained market understanding, at least 75 percent of their results are based upon self-understanding. But attempting to advance your self-understanding is difficult, in this context, until you have a solid grasp of market fundamentals; if you're not looking at the correct information to begin with, then market understanding may never arrive. Our goal has been to provide you with a realistic framework for understanding how markets function. The essential component of that framework is the continuous two-way auction process, captured and recorded with the Market Profile.
Perfect Practice Makes Perfect
Reading Markets in Profile, the follow-up to Mind Over Markets, is the next step on the path to becoming an expert trader. In it, you will learn to formulate a contextual understanding of the market; real learning always begins with appreciating the importance of context. At the highest level of skill acquisition, time spent studying, interpreting, and trading the market is the most important factor that separates the winners and losers—like in any endeavor. But note that the efficacy of the practice is entirely dependent on the practice being correct. You can practice a bad golf swing all day, but that dimpled white ball will never obey until you practice a correct swing. All day.
The more advanced your trading, the more nuanced your education becomes.
Blinded by Price
You will recall that price is simply a mechanism for advertising opportunity, with time regulating all opportunities, and volume serving to validate the success or failure of the advertised opportunities. Most traders (as well as most academics) begin by incorrectly responding to the single dimension of price. What is far more important is what lies behind the response to that price. You must continuously ask yourself the right questions. For example:
In The Invisible Gorilla by Christopher Chabris and Daniel Simons, the audience is invited to view a film that features two teams passing basketballs back and forth in a complicated pattern. One team is dressed in white shirts, while the other is wearing black. The audience is asked to count the passes made by the white-shirted team, while ignoring the black-shirted team. Here's the amazing part: Half-way through the film, a woman wearing a gorilla costume appears, ambles onto the court, thumps her chest, then walks off the court. The gorilla is in view for nine full seconds, but approximately half of all viewers didn't even notice the gorilla. And not only did half the audience miss the gorilla, but they couldn't believe a gorilla was really there!
Traders who are focused solely on price miss most of the salient information embedded within the market's two-way auctions. These same traders often wonder, after the market has closed, how they could have missed some of the market's most obvious opportunities. Many resolve to step back and take a more comprehensive view of the market, focusing on those elements that are far more important than price. The difficulty is that leaning on price has become such an automatic response that it is difficult to broaden your focus and execute new resolve.
But there's a course of action that will help you overcome that automatic, knee-jerk response to price—preparation.
Be Prepared
How do you prepare to overcome the inexorable forces of will, memory, and desire? You start by developing a tactical plan—a game plan that lays out tactical choices, based on potential outcomes. The execution of a tactical plan of course requires that you remain very much aware of the current price action, but the goal is to be prepared to make a tactical choice, avoiding price blindness.
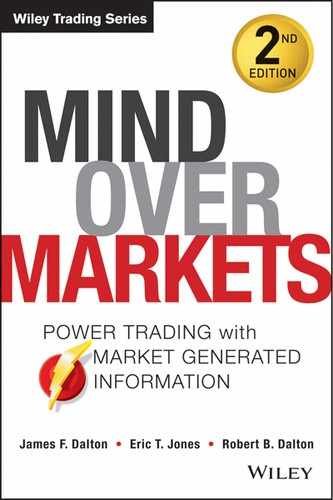
My personal preparation begins by getting as far away from daily price as possible—I begin by reviewing a monthly bar chart, like the one in Figure 7.1.
Figure 7.1 S&P Indices Monthly Bar Taken December 2012
Perspective
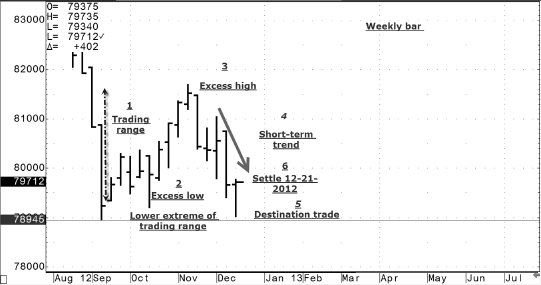
The monthly bar shows that the S&P indices are just below the multiyear high set in September 2012. Additionally, an excess low was established in November. The two most important concepts we deal with are excess and balance. Excess marks the end of one auction and the beginning of a new auction. When a market comes out of balance, it also represents the beginning of a new auction. Notice that the excess on the September high is far less than the excess on the November low. The long-term trend remains up.
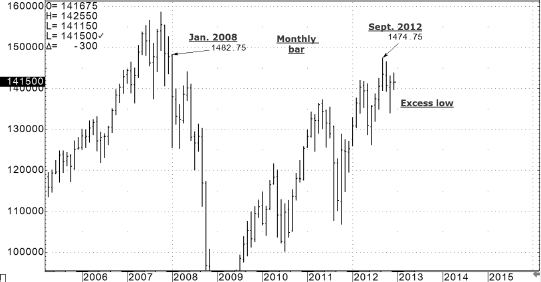
Next, I review the weekly bar. If change is to occur, it will manifest itself through the weekly bar prior to becoming evident through the monthly bar. Then I review the daily bar. Similarly, the daily bar will indicate change prior to the weekly bar. Bar charts are employed to speed-read the market. Finally, I review the Profiles for greater detail.
Let's take a closer look at Figure 7.2.
Figure 7.2 S&P Weekly Bar
The weekly bar shows an excess low followed by four weeks of one-timeframing higher (one-timeframing higher occurs when the low of the next week does not exceed [take out] the low of the preceding week).
The latest weekly settlement is close to the low for the week. Close your eyes and imagine what the weekly bar will look like if, during the early part of the next week, the prior week's low is taken out. The market will have stopped one-timeframing higher, and an excess high will be confirmed. The cessation of a one-timeframing mode represents change, and trading is all about understanding and anticipating change.
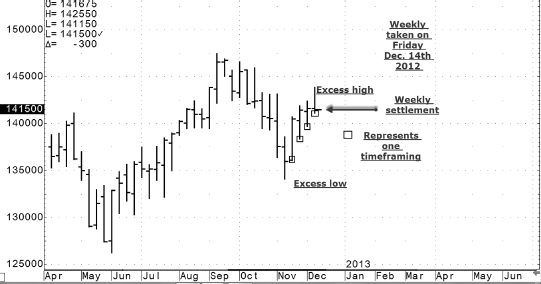
Now imagine what the weekly bar might look like if the one-timeframing mode remains in place (Figure 7.3). If you haven't imagined the two scenarios described above, early price movement during the following week will be more difficult to keep in perspective. Additionally, focusing on the importance of weekly one-timeframing will reduce the odds of price blindness.
Figure 7.3 S&P Daily Bar
The daily bar shows an excess high, similar to the excess high shown on the weekly bar. Next, focus on the downward one-timeframing mode. This contrasts with the upward one-timeframing mode shown under the weekly bar—change is very likely to occur early in the week.
Trading is about dealing with change. People generally don't like change, but change is at the heart of opportunity, in any endeavor.
The upward one-timeframing mode shown on the weekly bar versus the downward one-timeframing mode displayed on the daily bar presents an ambiguous picture. And as much as people tend to dislike change, they abhor ambiguity. But again, real trading opportunities develop from ambiguous situations (if the situation weren't ambiguous, everyone would be sharing the same position).
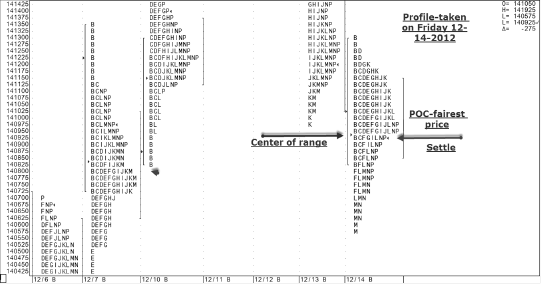
The daily Profile from December 14, 2012, depicts an almost perfectly balanced day; the Point Of Control (POC) is just a single tick above the center of the range (Figure 7.4). Think of the POC as the fairest price at which business is being conducted in the day timeframe. This conceptual approach makes it easier to understand what is actually occurring in the market. In this case, the question is this: Are traders selling S&P futures at prices below the fairest price and becoming short-in-the-hole? Or are they buying futures above the fairest price?
Figure 7.4 S&P Daily Profile
As I finish my analysis for the following week, my expectation is for a balanced Monday opening. Any meaningful change to the weekly bar will occur outside of Friday's daily balanced range. Reflect back on the weekly bar, which settled at a level where the market could continue to one-timeframe higher—this would represent the status quo—or cease one-timeframing higher, which would represent change.
There are three likely scenarios when trading a balanced market:
Your mental flexibility will be exponentially increased if you are always prepared for at least these three possible scenarios. The action may be the result of an unexpected short-covering rally or long-liquidation break, an exogenous event, out-of-range earnings, an economic announcement, or larger timeframes entering the market. If you have already considered different scenarios, you will be better prepared to quickly adapt to any directional auction.
Overnight Inventory
The final preparatory step, which is completed just prior to the pit session opening, is to evaluate overnight trading and inventory. This is why we split out our Profiles between pit session and overnight trade. You will only gain confidence in employing this analysis through your own observation; misunderstanding overnight inventory or disregarding it is another example of price blindness.
Determining if overnight inventory is long or short is simply mechanical. We measure overnight inventory from the prior pit session close or settle, and if the majority of overnight trade is above this level, we consider overnight inventory to be long. Similarly, if the majority of overnight trade occurs below the prior pit session settle, we deem overnight inventory as short. If overnight trade occurs about equally on both sides of the prior pit session settle, then we determine that overnight inventory is neutral.
The following example—selected to explain the concept—is not all that unusual.
The volume that occurs overnight is often no more than 25 percent of the volume experienced during the pit session hours. Generally, overnight trade involves shorter timeframe, weaker-hands traders. If inventory gets too long or too short, the odds are good that there will be an inventory adjustment shortly after the pit session opening. On occasion, the inventory adjustment can occur later in the session, depending on the confidence level in the current pit session.
The opening on December 3, 2012, occurs near the high of the overnight trade, and begins to sell off immediately; long-overnight inventory is immediately liquidated to bring the market into balance. Understanding the behavior of shorter timeframe traders and their tendency to fall prey to price blindness is pivotal in appreciating the influence of overnight trade.
Clearly it isn't as simple as conveyed in this example. However, your final morning analysis should assess overnight inventory, and alert you to the potential adjustment of that inventory (Figure 7.5).
Figure 7.5 Overnight Inventory Example
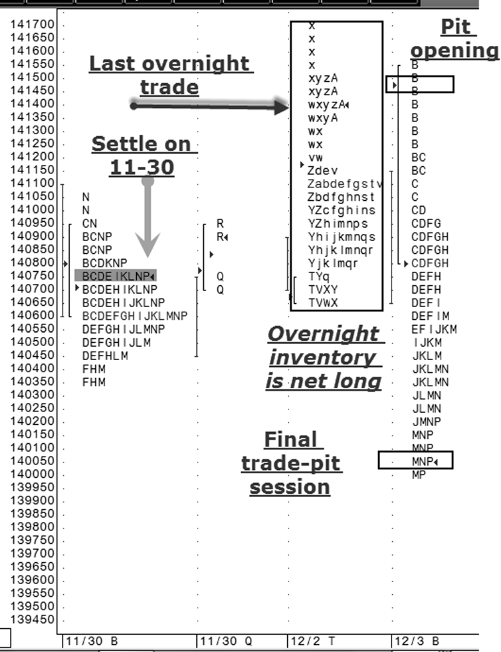
If overnight inventory is long, for example, and the market doesn't adjust, that is an indication of a strong market—at least in the short term.
Quite often you'll see an early adjustment when there is a significant degree of long or short overnight inventory. Not being aware of a potential adjustment, or seeing the adjustment as more than it actually is, can mislead you for the entire session. This is a difficult concept for inexperienced traders to grasp. The best way to begin to internalize overnight trading is to monitor each day, always forming your own opinion—as we've said a hundred times, self-confidence and market-understanding can only be gained through your own experience. The concepts addressed here are meant to provide contextual awareness, which is the ultimate starting point for self-development.
Traders who don't prepare, or don't know how to prepare, are generally at a serious disadvantage. Being prepared includes writing down at least three possible market scenarios: What will I do if the auction moves up, down, or remains in balance? How will I assess the conviction of those moves?
Gaps Can Be Gold
Leading up to November 23, 2012, the financial news stations interviewed a number of traders and analysts who were bullish on gold based on price—price had been rising. Let's look at the daily bar in Figure 7.6.
Figure 7.6 Gold Daily Bar Taken December 14, 2012
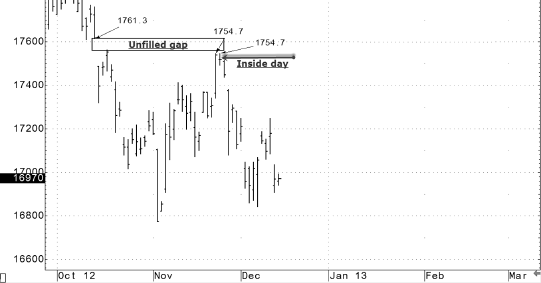
Earlier we stated that the two most important concepts we deal with are excess and balance. Please note that a gap is a form of excess—view a gap as a series of invisible single prints. The November 23, 2012, high at 1754.7 did not fill the gap that extended up to 1761.3; long-term sellers remained in control. Once again, the importance of understanding timeframes and their attendant behaviors is vital. As short-term traders were covering shorts, short-term momentum traders began to pile on to the auction. Selling to these buy orders were long-term, opportunistic traders who were selling at the top of the trading range, which was defined by the very visual gap. As you can see from this example, there was a “seller for every buyer.” However, the different timeframe participation reveals that the process cannot be explained so simplistically.
An inside day followed the failed attempt to fill the gap. An inside day is one form of balance. Within a couple of days, our two most important references—excess and balance, not price—have garnered our full attention.
Earlier we outlined the three scenarios for preparing to trade balance; go with the downside breakout from the inside day. The above analysis was all published before the fact through a service offered at J Dalton Trading. Traders who were simply following rising prices and listening to price-based analysis were likely caught long as the market began to break. Additionally, these price-following traders were more likely to be buying breaks rather than selling rallies.
Gaining an Edge
You constantly read and hear about the importance of traders “getting an edge.” We have already discussed the importance of preparation, which builds the initial base for obtaining an advantage over those who are less prepared. Here, we'll discuss two additional ways for gaining an edge—learning to read and interpret market structure, and becoming an odds-based trader.
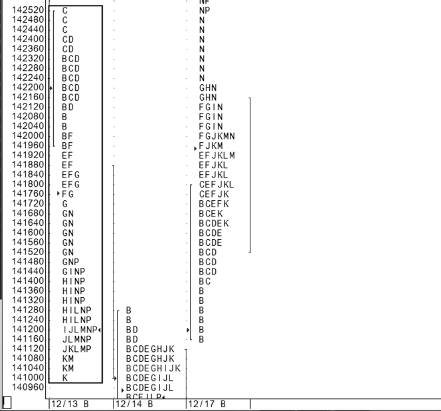
In Figure 7.7, you see December 14, 2012, represented by a one-dimensional, 30-minute bar chart on the left, and a two-dimensional Market Profile on the right. The 30-minute bar chart lacks dimension and structure; it does not graphically depict the critical fact that all prices are not equal.
Figure 7.7 Conventional Bar Chart versus the Market Profile Graphic
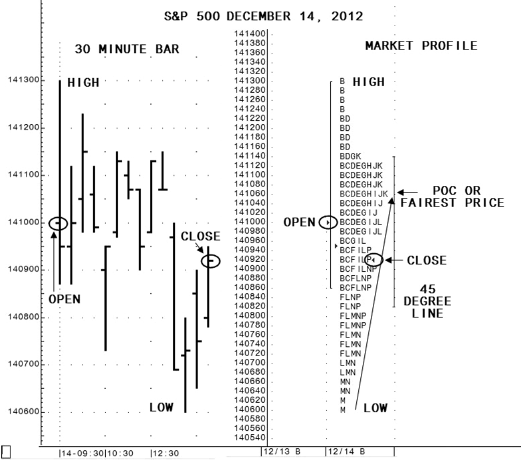
The Market Profile shows the same open, high, low, and close, in addition to showing time and volume performance at each price. The wider a single price is, reading from right to left, the more time was spent at that price. Additionally, by applying the price × time = volume equation, we can estimate volume at each price level.
While we are not technically Profile traders (we employ a range of tools and interwoven analysis), we value the Market Profile for its ability to reveal the inherent inequality in different prices—information you can leverage to trade more competitively. The multidimensional Profile gives structure to the market's continuous two-way auction process. Learning to read and interpret that structure can provide you with a serious edge, because it helps you avoid the perils of price blindness.
The study and interpretation of structure is a lifelong endeavor, as no two days are ever the same; this is an exciting and welcome challenge for many professional traders.
The Fairest Price Revealed
The example above depicts a structure that indicates a market that has gotten very short in the day timeframe. The POC, or fairest price at which business is being conducted, is the longest line reading from left to right. Selling that takes place below the fairest price is an indication of traders' willingness to sell futures below the current day's fairest price; traders refer to this as selling “short-in-the hole,” or selling short at poor prices. There isn't always a short-covering rally following this pattern. However, the odds of profiting from remaining short have decreased, and the odds of a rally to adjust short-term inventory have increased.
The above example is from Friday, December 14, 2012, and was written about on Saturday, December 15th. The capture shown in Figure 7.8 was taken on Monday morning, December 17th, 33 minutes after the opening, and shows the early rally. You can never prove it was a short-covering rally. But from our experience, we're comfortable identifying it as such.
Figure 7.8 December 17th after Opening
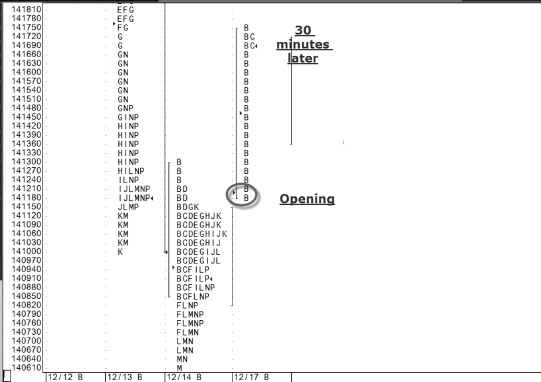
Thinking in terms of odds will help keep you from becoming too focused on price, which will help keep you out of bad trades. You may not have wanted to go home long on the December 14th close, but taking home a short was against the odds. Market structure—not price—contained the information necessary to read Friday's market.
Prior to the second edition of Mind Over Markets, we talked a lot about the POC, but since then this acronym has evolved into the more conceptual descriptor, fairest price—the fairest price at which business is being conducted. The last example revealed how the fairest price lens was employed to identify a particular market condition and opportunity. This was just one example of the power of the Profile, and how it reveals the continuous two-way auction process in an evolving visual schema.
Thinking Statistically
Few of us naturally think logically all the time. Most of us are ruled by cascading waves of emotion, influenced by our environment and the day's events. Statistical thinking is hard, because it requires focus and parallel processing, or thinking about several things at once. Some examples of this type of contextual thinking include simultaneously assessing current market direction, volume, and market structure—Profile shape, daily settlement, who's buying or selling, and overall trade location within the daily, weekly, and monthly bars. That's a lot to keep straight and uncluttered in your brain.
Traders are prone to overestimating how much they understand about the market by looking at price, and becoming overconfident by the illusion of certainty. As Nassim Nicholas Taleb writes in The Black Swan (New York: Random House, 2007), “We tend to learn the precise, not the general.” Nonlinear auctions occur when the illusion of certainty is shattered. And when opinions are revealed to be illusory, human behavior can become extremely erratic; nonlinear auctions often make some traders a lot of money, while destroying the majority of those who have difficulty accepting what is actually happening in the market.
The Trader's Dilemma
In our last example, price was going lower. However, the odds of downside continuation were decreasing. The market is regulated through time—if you don't use the opportunity to adjust your position and time runs out, the financial consequences can be severe. Many traders are like new aggressive male drivers in that they know the dangers, but believe it could never happen to them. Understanding the odds adds a dimension to your thought process that not only alerts you to asymmetric opportunities, but also keeps you from becoming too focused on price and ending up on the wrong side of the trade.
The best example of “The Trader's Dilemma” was captured on film over a two-day period in early October 2011 at DePaul University in Chicago. We were presenting and filming J Dalton Trading's Live Market Seminar. The S&P indices had been declining for several days on poor volume and structure (volume should always be evaluated on a relative, rather than absolute, basis). A sound structural review begins with understanding the attempted direction on each day. Elongated structure that develops in the attempted direction is viewed as positive for directional continuation. Truncated structure that develops in the direction of the auction is considered negative for continuation.
As the final day's session began, Jim stated that, “This may be one of those days that sees the market open weak, but close strong.” The odds appeared to be building against the shorts; most traders simply continued to press the current trend, as they were addicted to price movement. We have often referred to this trader dilemma as being mesmerized by price.
During the session, traders sold each small rally, which was continually adding to the short inventory. With about an hour to go, Jim asked who was still short—a few nods indicated that some seminar participants were. Soon after, with less than an hour remaining in the New York pit session, the market rallied over 400 points.
The dilemma occurs when traders are compelled to act immediately upon the information that indicates a struggling decline (in this example). Often, this information has to be “carried forward” until there is completion to the current auction. And completion generally occurs only after the laggard longs have completed their liquidation, along with the laggard shorts, who continue to sell.
When do you cover your shorts and when do you go long? You want to cover your shorts when the odds are becoming overwhelming, even though the auction may not yet be complete. You may elect to be a little late in going long; the additional information you gain by being late may lower the risk of being wrong in a big way. Failure to exercise control and patience will likely result in you getting whipsawed.
The Most Important Omission from the First Printing in 1990
In the first printing of this book, we talked about buying and selling tails in Profile structure. Tails represent short-term excess, while a lack of a buying or selling tail represents an auction high or low that has not been completed. We describe a lack of a buying or selling tail as a poor low, or a poor high. While the concept of tails, or the lack thereof, remains true, we have since developed a more nuanced appreciation for what causes poor lows and highs. The lack of a tail may indicate that the market has gotten too long when there is no selling tail, and too short when there is no buying tail.
This understanding—like all understanding—evolved over time. It is the context that leads to the high or low that signals a deeper layer of meaning. Volume will often be below the relative volume for the past several days; tempo, or pace, will be halting or slow; and the Profile will likely be more truncated. Once the inventory is adjusted, the market often returns to take out the initial high or low in order to complete the original auction—but this action doesn't always occur on the same day (one of the most damaging trader tendencies is acting too soon).
The biggest disappointment is that there are no absolute answers.
Continual practice and observation are required before this information becomes internalized, and can be appreciated and understood fully.
Emotional Markets
In a prior example, we reviewed the situation when a market gets too short over time. The mirror formation would indicate the inverse—the potential for a market that has gotten too long. A contextual understanding will likely include this inventory imbalance building over multiple sessions, with deteriorating volume and market structure (a Profile becoming less elongated). In the following example we will see a Profile that quickly gets too elongated, usually within a single session (Figure 7.9).
Figure 7.9 S&P 500
On December 13, 2012, the S&P indices broke hard and fast. As the market began to break, multiple short-term timeframe traders continued to pile onto the short side of the market—there was little thinking going on. Traders have often heard us say, “Traders do what works until it doesn't work anymore.” Price-based traders continued to pressure the market on the following day; the trade to sell every rally was still working. However, inventory had become extremely short.
As we discussed earlier in the book, an elongated Market Profile is a sign of auction continuation. When the Profile is too elongated, however, the result (as shown above) is often just the opposite. This kind of information can't be internalized or even fully understood by reading a book—the process of internalization begins with knowing what to look for. In the above example, a day and a half prior to the recovery rally it was possible to begin to visualize the recovery. And consider that even while the market was auctioning lower, the potential for a short-covering rally was increasing.
A Landscape View of the Market
It is highly unlikely that simple systems will win over any reasonable length of time. That's why serious professional traders begin with a landscape view of the markets—landscape referring to a bank of monitors lit up to display potentially interconnected markets. While a trader may be trading a single market, he or she should be acutely aware that other markets could impact that single market. Examples include:
With accumulated experience, you learn to keep a constant eye on multiple markets, paying particular attention to sudden shifts in sentiment.
Personal Evolution
There is nothing quite so compelling as real personal anecdote. As the lead author of this book, and a full-time trader, I (Jim Dalton) would like to share a summary of my own experience with the Market Profile. Hopefully this passage will provide some insight and inspiration as you continue on your quest to becoming an expert trader.
From the beginning, I was skeptical about analysis that treated all prices as equal. After years in the markets, with a membership on the Chicago Board of Trade (CBOT) and a founding membership on the Chicago Board Options Exchange (CBOE), I came to the conclusion that fundamental analysis is generally too long term, often appearing out of touch with the market. Auction market theory, on the other hand, seemed to offer the most objective means of allocating the constant flow of bids and offers.
I embraced the idea that auctions are really mechanisms for price discovery.
For example, if an auctioneer couldn't get buyers to raise their bids as he was attempting to get the auction underway, he would lower the bid. Once the auction got going, it usually took one of two courses. If the auction occurred as expected, rising prices would indicate that some bidders had their orders filled, while others dropped out as prices increased. Eventually, the auction would end as the last bidder bid. Volume decreased as prices rose—this was the expected course, as higher prices were cutting off buyers. The unexpected auction was far more complex and exciting: As prices auctioned higher, volume increased with new bidders continually entering the market. These kinds of auctions often end with an upward flurry as the laggards arrive (once I was introduced to the Gladwell's Diffusion Model, I more fully appreciated the auction process in all its nuances).
It was a much smaller step to grasp the concept of a continuous two-way auction process—auctioning from high to low, and low to high—than to consider the influence of the different participants on the auction process. The Market Profile served as an innovative way to organize these continual two-way auctions in such a way that specific participant behavior could sometimes be visualized. I'm often asked if the Profile works. Or, more commonly, if it still works. The better question is this: “Is the Market Profile a valid scientific way to organize data?”
The answer to that question is a definitive yes. The Profile is constructed using a constant, time, on the horizontal axis, and a variable, price, on the vertical axis to form a distribution. Scientists have employed this method to study and observe data for generations. Personally, I would much rather study organized data than unorganized data; the Profile is simply a valuable tool for organizing objective information.
To be clear, I'm a trader, not a Profile trader. However, the Profile has been invaluable to my analysis, and it has enabled my personal evolution through decades of reading and interpreting data in its ever-changing visualizations. The previous discussion around tails is a good example of how the Profile has enabled deeper insight into the patterns of human behavior that often emerge.
Over time, our knowledge deepens through practice—and not just practice, but correct practice (remember that golf swing metaphor).
Hierarchy of Information
When we begin to learn any skill we start with basic definitions. As time goes on, we begin to internalize these basics. Then as we become competent, we have internalized enough information to, for example, play the piano well enough that the piece can be recognized by a patient listener. We are not alone at this stage—countless would-be artists can play that same tune well enough to be recognizable. In short, our skill level has no meaningful revenue potential at this stage.
Reflect on how easy it has become for most of us to drive ourselves to the store, yet we're still nowhere close to becoming a racecar driver—or even a New York taxi driver. If we want to advance professionally once the basics have been acquired, we must continue to practice, learning one nuance at a time. Setbacks of course occur when we have acquired so many nuances that we have to begin to decide which are most important, as well as when a particular nuance becomes irrelevant under changing conditions. Think of this as ruling reason. For example, you may have six data points that suggest a positive bias for price direction, but the one observation that points to a negative bias outweighs those six. It is the ruling reason that drives your decision.
As you advance toward proficient and expert, the information that is most salient within the current context becomes easier to discern. A professional baseball coach doesn't routinely have his players attempt to steal home, but under the right circumstances the risk/reward may be attractive enough to attempt such a bold gambit. Most successful professionals have identified multiple mentors, and constantly look to coaches to keep them on track. But finding a coach that is truly knowledgeable (and affordable) is prohibitive for most people, traders included.
Below, we have attempted to list many of the nuances that you must deal with every day. And while listing and describing them is far easier than internalizing them, we believe that once you have these nuances in mind, you will be in a better position to constantly observe them, honing your ability to effectively employ them as part of your trading strategy. An important part of this internalization process includes recognizing the changing hierarchy of this subtle information from day to day.
Timeframe Control—Who Is Dominating the Current Session?
It will be more practical, in the earlier stages of your career, if you think in terms of day timeframe, and then “all the others.” But as you become more experienced, you will begin to see four timeframes: day, short-term, intermediate-term, and long-term.
On days when the day timeframe is in control, the trading is likely to be restrained with lower volume, less range extension, and guided by very mechanical references. Among these references:
Additionally, the high and low from overnight trading—as well as the previous day, week, and month—will be very much in play. Weekly highs and lows are only relevant to the day trader if they are easily within range. When the day timeframe is in control, you are far more likely to experience nonexcess highs and lows, which simply indicate a lack of buying or selling tails. We also refer to these as poor or unsecured lows and highs. During these days, you're much more likely to see day timeframe inventory becoming too short or too long, with constant counter auctions to correct the day timeframe inventory imbalance.
When the other timeframe is in control, the references listed above will be far less significant; in fact, long-term traders may not even acknowledge some of them as references. Day-timeframe traders attempting to apply these references (or anchors) when the other timeframe is in control are likely to get run over. How many times have we heard day- and short-term traders say that they gave back three weeks of profitable trading in one day? Many times we've also heard it said, “If it weren't for that one day, my month would have been profitable.” It is critical to day- and short-term traders to respect the dominance of the longer timeframes, who always trump the actions of the shorter timeframes.
The other timeframe is more likely to recognize a multiple day trading range. Interchangeable terms are balance areas or trading brackets, highs and lows, weekly and monthly extremes, unfilled gaps, and common knowledge moving averages. More alert and experienced day-timeframe traders who are able to quickly recognize who's in control pile on to the auctions driven by the longer timeframe. These adaptable day traders shift their strategy and tactics from more mundane rotational trading to momentum trading. The less experienced day trader is fading or going against the action of the longer timeframes. The addiction to price—the temptation to sell at a price higher than they could previously, or buy at a price lower than they could previously—cannot be resisted...they step in front of the proverbial train.
Markets Are Visual
A standard bar chart is the best way to identify visual references, such as trading range highs and lows, as well as weekly and monthly extremes. Most people have a tendency to view the 24-hour electronic bar chart rather than view a bar chart that includes the pit sessions only. As of this writing, the New York or Chicago pit sessions are still the center of trading for most U.S. listed equities and world commodities. For this reason, we view a bar chart for the U.S. pit session, and may separately view 24-hour bar charts, particularly for the currencies. We do this so that we can view gaps between the U.S. day sessions. We define a gap as an opening that occurs outside of the previous day's high or low (we don't measure gaps from the close of the prior day). We also view U.S. day session bar charts for daily, weekly, and monthly trading ranges and excess highs and lows. This affords us an opportunity to see visual areas on the bar charts that may be destinations for current directional auctions, hereafter referred to as “destination trades.”
We are often asked why we use bar charts, rather than composite Profiles, for long-term charts. The reason is that long-term, composite Profiles can contain too much information, and hide important structural information such as the gaps and trading range highs and lows we just discussed. Additionally, significant references—points such as daily, weekly, and monthly highs and lows—may blend into the composite, where they are lost.
Destination Trades
Destination trades are far easier to grasp when you appreciate what timeframe is dominating, as well as the visual nature of the markets' prominent reference points. Once a directional auction gets underway, the auction tends to travel to a very visual reference. For a day timeframe trade, for example, the reference may be the previous day's high or low, a three-day high or low, or to the top or bottom of a gap.
The destination for a long-term trade may be from a five-month bracket high or low to the opposite extreme of that bracket; it may take days, weeks, or months to reach the destination. Of course destinations don't have to be reached, but they always serve as benchmarks to chart market progress. We often say, “Put the trade on and monitor for continuation.” Understanding possible destinations will help you maintain a better perspective of the multiple auctions, and help you better gauge your position's performance. For example, it is not uncommon to have a long-term auction to the upside with an intermediate-term corrective auction to the downside, as well as a day timeframe trend day to the upside. Employing destination areas from the bar charts will help you sort out this potentially conflicting data, and keep this information out of the abstract.
The Opening
The Market Profile is a time-sensitive, evolving database that records the market's continuous two-way auction process, the study of which is termed Auction Market Theory. The opening is the first recorded data point each day; we want to observe if the market opens within balance (within the previous day's range) or out of balance (outside of the previous day's range). Of course, in or out of balance is a matter of degree. If we opened just four ticks below yesterday's high, for example, we would still be in balance. However, the odds are higher that the market will trade out of balance to the upside, or failing that, begin to trade toward the previous day's low. The more out of balance we are to begin the day, the greater the opportunities; the more out of balance we are, the greater the odds that the other timeframe is responsible. Remaining within balance limits traders to much smaller opportunities. When in balance, the odds are also much greater that trading is being dominated by the day timeframe.
Trends
We have simplified the timeframes down to two. For this discussion, we will determine the direction of the long- and short-term trend. The definition of a trend is entirely dependent upon your own timeframe. At a minimum, we generally want to trade with the direction of the short-term trend. And if you are trading against the trend, you want good trade location, and you want your trade to work quickly. Trade location is the best risk control we have available. Let's review an example (Figure 7.10).
Figure 7.10 U.S. Dollar Index as of December 21, 2012
Remember, these concepts are applicable to all timeframes—from 30-minute bars to daily, weekly, monthly bars, and so on.
Reflect on the risk/reward at different levels along the continuum from high to low. This same analysis is relevant to all timeframe trades. For day traders, we suggest using the daily Market Profile, and placing a green pin on the Profile for each buy, and a red pin for each sell. After the day is over, review your overall trade location—if a majority of the pins are within the fattest portion of the Profile, then you are trading with the majority; you are not getting an edge and are unlikely to be profitable. If too many of your green pins are near the higher end of the Profile, and the red pins are near the lower portion, then your trading is of the laggard category, and you are likely to get whipsawed.
Daily Perspective
Every day, we seek a balanced perspective by seeking to determine the nature of any existing trends, which timeframe is dominating, whether the opening is in or out of balance, and so on, as well as the opportunity that each of these situations reveals—trade location, potential visual destinations, and evolving structural cues.
Cognitive Dissonance
All humans feel an acute discomfort when we find ourselves holding two opposing thoughts. This is an extremely common emotion shared by traders. But cognitive dissonance can actually be positive for those traders who are willing to think through the source of that dissonance. For example, it is powerful to recognize that a market is rising, but the higher it goes without confirming structure and volume, the better the downside opportunity to follow. The trend may be your friend, but it is equally important to recognize when that trend is ending. Being prepared for change affords us the best trade location and opportunity. Let's see this process in action (Figure 7.11).
Figure 7.11 Treasury Bonds
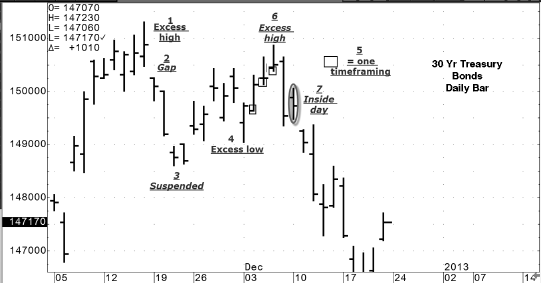
As we approach the end of the Second Edition of Mind Over Markets, our examples are getting more complex. Figure 7.11 serves to establish the background for this discussion.
Hopefully, by this point you're feeling like you did the last time you visited your ophthalmologist—as you sat behind the refractor staring at rows of fuzzy letters, you noticed how they came in and out of focus. Hopefully this is occurring now as the layers of information that have been presented are beginning to form a recognizable whole.
Take a moment to reflect back on the suspended auction discussed under item 3. The poor low that formed suggested that it would be revisited or repaired at some time in the future, as there was no excess—in other words, no aggressive buying that led to an excess low.
Recording and carrying this information forward is important for reading the subtleties of the continuous two-way auction process. Many traders complain that this type of information is simply too ambiguous, yet the market's best opportunities are often hidden in the subtleties of market-generated information.
Having reviewed the overall market and a series of auctions, it's time to transition to the real discussion.
The previous example shown in Figure 7.12 included a suspended downward auction followed by a market that was finding ways to work itself higher. We suspect that there were two underlying causes for the auction going higher:
Figure 7.12 Excess High Marked on the Previous Daily Bar Chart
In Figure 7.12, you notice that each day's low was established in the initial pit session 30-minute Y period, which allows us to easily determine that the attempted direction was up. The basic question that we ask each day is: “What was the market trying to do, and how effective was the effort?” A solid attempt to trade higher would begin with value beginning to develop higher, which we see revealed in the Profiles. Additionally, the Profile structure would be much more elongated, with most prices attracting no more than five or six TPO prints. In the above example, some prices attracted as many as 10 letters—a lot of time was spent trading at these prices. This is not a science, but rather the art of reading and interpreting market structure. Some markets are open for shorter periods, while others, like bonds and stocks, are open for longer periods. The amount of time spent trading at a particular level, relative to the pit session hours, affects our analysis of this data.
On a solid day, the market is more likely to settle near the higher end of the range. In the above example, the settle of each of the last two days is well off of the highs. At the time, I found myself holding two contrasting opinions: 1) The larger auction was down and had been temporarily suspended, and 2) the short-covering and short-term momentum buying was occurring, which was related to the Federal Reserve's FOMC release. We always want to trade value, and value was developing higher each day; no matter what my opinion of the long-term, you don't want to fade or go against value.
This is a good opportunity to reflect back on systems that trade price. In this instance, price was trading higher each day. Yet, while value was also trading higher, the Market Profiles were revealing structural weakness that demonstrated slowing momentum. The odds of upside continuation were weakening, while the odds of a market reversal were increasing. The break that began on Friday, December 7, 2012, took the market down approximately $5,000 per contract over a period of six days before a new excess low emerged. The suspended auction that we discussed earlier was revisited and repaired, meaning that the poor, or in this case suspended auction, no longer existed.
Imagination
The career of a professional trader is largely dependent upon his or her imagination—if you can't imagine what might occur, it will be difficult for you to recognize market opportunities as they arise. You will end up taking small profits and fading larger opportunities that lead to net losses, when a chance for larger profit was right in front of you. We foresaw such a scenario in real time when we discussed a similar market situation while recording our Live Markets Seminar in October 2011.
In the above example, a substantial opportunity was identified through positive cognitive dissonance; the dissonance was observing one rising auction and sensing that a reversal was probable. The deteriorating auction, when combined with carrying forward information conveyed by the suspended auction, allowed us to imagine and capitalize on a large opportunity to the downside.
False Certainty
Traders are prone to overestimate how much they understand about the markets by looking at price, which often causes them to become overconfident. Nonlinear auctions occur, as we have often stated, when the illusion of certainty is shattered. I'm writing this on Sunday morning, December 23, 2012; during the electronic trade on Thursday evening, December 20, such an illusion was shattered, which briefly took the S&P indices limit down. Let's examine the market leading up to this break.
The final line in our daily S&P Pre-Market Update, published just prior to the break, read: “I continue to be concerned regarding underlying structure. Thursday's anomalies contribute to my concern.” This was an odds-based comment—I certainly didn't foresee a limit down move in just a few hours. However, the odds of holding long inventory appeared to be extraordinarily high. Much of this conclusion was based upon structural analysis, which was similar to the analysis discussed in the last bond example. Two additional contributing observations are discussed below.
Anomalies
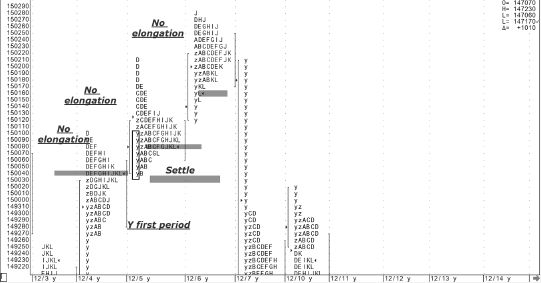
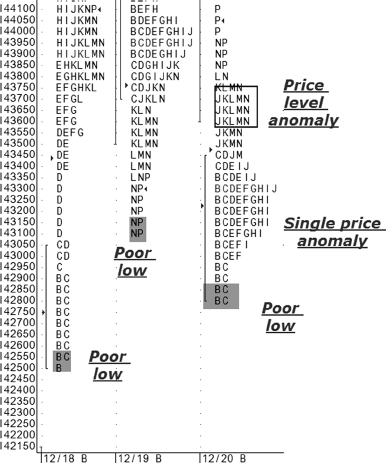
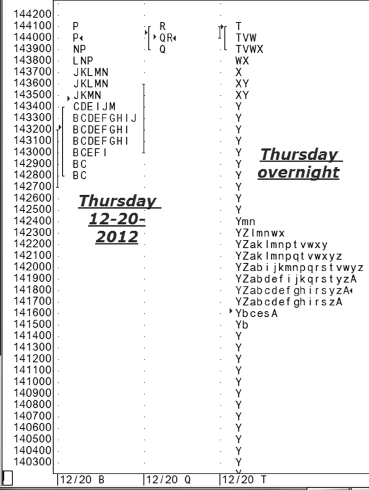
An anomaly, as described under the glossary on our website, is a single price or price level that lacks symmetry—an unusual structural arrangement in the Market Profile. An anomaly represents structural weakness. Learning to spot anomalies is the first step toward understanding the pivotal information that anomalies provide. See the Market Profile from Thursday, December 20, 2012, in Figure 7.13.
Figure 7.13 Market Profile, Thursday, December 20, 2012
The Profile shows a single price anomaly, as well as a price-level anomaly. In addition, there was a series of poor lows—another indication of structural weakness.
Markets in Profile, published in 2007, discusses timeframes extensively. When longer timeframes are active in the market, they tend to be more aggressive on the highs and lows. Their interest will be more evident through single-print buying and selling tails. When tails are nonexistent, the higher and lower structural portions of the Profile lack excess. In the above S&P example, the lack of buying tails for three successive days is an indication that the market is being dominated by short-term, weaker-hands traders. These are the traders that impulsively liquidate and reverse their positions at the first sign of a problem. A single poor low represents one data point, which I give limited attention. But multiple poor lows represent exponential risk to those holding long positions. The graphic in Figure 7.14 shows that risk as the market traded limit down.
Figure 7.14 Exponential Risk as Market Traded Limit Down
Market Logic
It is not unusual for market logic to supersede all other analysis and understanding. During the period leading up to Thursday's overnight limit down break, short-term traders—who were afraid that they would miss the anticipated rally following a favorable outcome between the president and Congress to keep the country from falling off of fiscal cliff—couldn't buy enough. As often happens, they were misguided in their actions and paid a severe price. Additionally, many reversed their positions only to experience another whipsaw.
Other examples of market logic include what didn't happen; almost all traders can accurately report what actually occurred during a trading session, but professional traders reflect on what didn't happen. What could have happened and didn't is often extremely valuable information. For example, when a negative Monthly Jobs Report fails to lead to a declining market, the market will likely rally—those left staring at the report are unable to trade with the market, and experience negative cognitive dissonance.
As we've often stated, the Market Profile is a valuable analytic tool for recording and interpreting the market, but it should not be employed in a vacuum.
We Are All Day Traders
No matter what timeframe trader you are, we are all day traders on the day we enter and exit a position. And how we enter our initial trade, no matter our timeframe, will ultimately influence our subsequent actions. Understanding that influence—both positive and negative—is vital to success. Positive psychology is an important element for successful trading; knowing how your emotions influence your behavior is just as important as understanding the fundamental market dynamics discussed in this book. For example, most traders are far too eager to get involved as the market opens, for fear of missing an opportunity. When such a feeling is controlling you, the odds are good that you'll make an impulsive trade as a result. It is common knowledge that impulsive trades seldom work out.
When markets open within balance relative to the previous day's range, the opportunities are usually limited, and it's probably best to wait for better trade location. In this situation, the additional information gathered while waiting will give you a more complete, coherent picture of who is driving market behavior. View the opening on a continuum relative to the previous day's range—the closer to the center of the range, the lower the odds that you need to trade early; the closer you are to the previous day's extremes, the more likely that you can benefit from early entry. The more out of balance the market is relative to the center of the range, the greater the opportunities. Attractive opportunities usually develop around gap openings, as gaps reveal the ultimate out-of-balance experience. The bigger the gap, the smaller the odds that the gap will be filled during the current trading day. This may feel counterintuitive, but the bigger the gap the more likely that longer timeframe traders are caught the wrong way, and will have to trade in the direction of the gap to adjust their existing inventory.
Free from distractions, we continue until we reach our goal...
While it may seem strange to quote a swami in a book on trading, we can think of no better goal than the one commonly described by wise folks throughout the ages: We must free ourselves from attachment to desired outcomes if we are to see the world as it really is. In reading this book, you have made progress on your path to becoming a successful trader. Over time, you will transform these insights into instincts in the kiln of experience. And those instincts will help you rise above the distracting maelstrom of conflicting information with a broader, more holistic market perspective. You will begin to understand the big picture, while also participating in the daily minutia—that is the hallmark of a professional trader.
Developing this level of market understanding is not an easy process. Most people find it impossible to even parse ambiguous, conflicting information, let alone transcend it. But armed with awareness, you have the ability to separate yourself from your competitors, most of whom are lost in the shallows of price and opinion. You have the opportunity to forge your own path toward expert. Good luck on your journey!
Note
1. Notice also that these two similar weekly lows lack excess—they are considered a poor or unsecured low, albeit on the daily bar chart. We will come back to this later in the discussion.