
INTRINSIC VALUE
Investors should buy stocks as if they were groceries instead of perfume.
—BENJAMIN GRAHAM
When we buy groceries, clothing, or a television, we ask not only whether the food is tasty, the clothing attractive, and the television well built, but how much it costs. Is it worth the price? When we buy stock, we should ask the same question—not whether it is issued by a good company, but whether the price is right. Is it worth the cost? The relevant question is not whether Amazon is a better company than Target, but whether Amazon stock, at $800 a share, is a better buy than Target stock at $80 a share.
What is a share of stock worth? We do not buy stock to eat, wear, or watch at night. We buy stock for the cash it generates: the dividends. This insight is the basis of value investing.
Value investors buy stock with the expectation that, even if they never sell the stock, they will be satisfied with the dividends they expect to receive. Value investors don’t invest in postage stamps, baseball cards, or Beanie Babies because they don’t generate income. John Burr Williams, a Harvard economist temporarily turned poet, wrote:
A cow for her milk
A hen for her eggs
And a stock, by heck
For her dividends.
Bees, for their honey
And stock, besides,
For their dividends.
It would be a mistake “to buy a cow for her cud or bees for their buzz.”
If a city slicker comes to your farm and offers a low price for your cow, you ignore him. You bought the cow for the milk, not to sell to city slickers. If the city slicker returns the next day and offers a ridiculously high price, more than the milk is worth, you take advantage of his ignorance.
In the same way, Benjamin Graham created an imaginary Mr. Market, a person who comes by every day offering to buy the stock you own or to sell you more shares. Sometimes, Mr. Market’s price is reasonable. Other times, it is silly. There is no reason for your assessment of your stock to be swayed by Mr. Market’s prices, though you may sometimes take advantage of his foolishness.
MR. MARKET IS FICKLE, AND THAT’S A GOOD THING
Figure 6-1 shows the daily Dow Jones Industrial Average from August 26, 2015, to August 25, 2016. I am writing this on August 26, 2016, so the figure reflects the most recent fifty-two-week period I have available. I scaled the Dow to equal 100 on August 26, 2015, so that percentage changes can be gauged by comparing the daily prices to 100.
The Dow was up about 15 percent over this fifty-two-week period, but its volatility is even more interesting. The Dow went up 12 percent in the five weeks between September 28, 2015, and November 3, 2015, then fell 14 percent during the next three months, followed by a 16 percent increase in the two months after that.

The Dow is an average of the prices of thirty prominent blue-chip stocks. In the words of Dow Jones & Company, these are “substantial companies—renowned for the quality and wide acceptance of their products or services—with strong histories of successful growth.” The intrinsic value of these bluest of blue-chip companies surely did not go up or down by double-digit amounts every few months. Yet their stock prices did.
And this is the average of the prices of thirty blue-chip stocks. Swings in individual stock prices can be even wilder. Pick any of the Dow stocks at random and look at its high and low prices over the preceding fifty-two weeks. Seriously, take a break from reading this book and find a list of the thirty Dow stocks. Pick one at random. Then go to a finance website and look at the fifty-two-week high and low prices for this stock. Now ask yourself if it is reasonable that the real value of this company would vary so much in one year’s time.
I did the same exercise. I used a random number generator to pick a number between 1 and 30. The number selected was 21, so I looked at Nike, the twenty-first stock in the Dow list when the company names are arranged alphabetically. The high price was $67.16, on November 27, 2015; the low price was $51.89 on June 27, 2016. According to Mr. Market, Nike had lost a quarter of its value in seven months.
But wait, there’s more. Figure 6-2 shows Nike’s price between August 26, 2015, to August 25, 2016, scaled to equal 100 on August 26, 2015. There are several 20-percentage-point swings in the price of Nike stock, although the intrinsic value of the company surely did not go up, down, up, down by 20 percent in a manner of months—not to mention the 5 to 10 percent zigs and zags from one week to the next. On February 1, Mr. Market said that Nike was worth $99 billion. A week later, Mr. Market announced that Nike was now worth $85 billion. Two weeks later, Mr. Market changed his mind, now proclaiming that Nike was again worth $99 billion. Mr. Market is nuts.
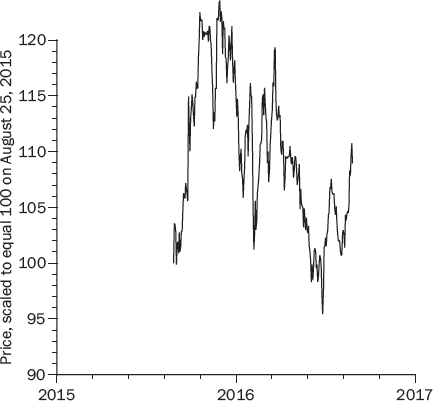
There are two takeaways. First, Mr. Market is very volatile, bordering on unstable. His opinion of what a company is worth can vary much more than the company’s real value. Second, Mr. Market’s fickleness may create rewarding opportunities for value investors looking to buy good stocks at bargain prices. Instead of bemoaning Mr. Market’s fickleness, we should embrace it.
THE PRESENT VALUE OF DIVIDENDS
John Burr Williams and Benjamin Graham were both teaching us to form our own opinions of what a stock is worth, based on the income it generates, not on the daily fluctuations in stock prices. Similarly, Warren Buffett suggested that we think of stocks as disguised bonds so that we will value stocks by looking at their dividends the same way we value bonds by looking at their coupons.
Let’s assume, as do John Burr Williams, Benjamin Graham, and Warren Buffett, that we plan to hold the stock forever. Even though this is not literally true, it forces us to think about the cash generated by the company instead of guessing whether Mr. Market’s price tomorrow will be higher or lower than his price today.
Consider a stock that will pay a $10 dividend one year from today. (Companies usually pay dividends quarterly; for simplicity, we assume annual dividends.) How much would you pay for this $10? Somewhat less than $10, because if you had the $10 today, you could invest it for a year and have more than $10. This is the time value of money: A dollar today is worth more than a dollar tomorrow.
Looking at other ways you might invest your money, you may decide that you do not want to buy this $10 dividend unless it gives you a 5 percent return. If so, the highest price you are willing to pay is $9.52 because that would give you your 5 percent required return. Paying $9.52 for a $10 dividend is a 48-cent profit, which is a 5 percent return on your $9.52 investment:
![]()
The $10 dividend one year from now is worth $9.52 to you today.
If your required return were 10 percent, you would be willing to pay $9.09 today for a $10 dividend a year from now because your profit would be 91 cents, a 10 percent return on your $9.09 investment:
![]()
The higher your required return, the less the dividend is worth. This makes sense. The only way you can get a higher return from a $10 dividend is if you can buy it for a lower price.
The math is more complicated for dividends further into the future, but the principle is the same. The present value of future cash is how much you are willing to pay today for cash that you have to wait to receive in the future.*
A former student who is now a fund manager told me that if you understand present value, you’ll understand 90 percent of investing. That’s an exaggeration, but like all good exaggerations, there is truth to it. An understanding of present value is indispensable for informed investment decisions.
The right way to think about a prospective investment is to consider the cash it will generate and then discount this cash by a required return that takes into account the time value of money. This simple idea is the cornerstone of value investing.
Because you are acting as if you are going to hold a stock forever and receive dividends forever, the stock’s intrinsic value is the present value of these dividends. The intrinsic value does not depend on predictions about what the stock’s price will be tomorrow or a year from now.
The only market price that matters is today’s price. A stock is worth buying if Mr. Market’s price today is lower than the stock’s intrinsic value, and the bigger the gap, the bigger the appeal.
To implement the intrinsic-value model, we need to specify the future dividends and a required return, what Williams called an investor’s “personal rate of interest.” The required return for stocks surely depends on the returns available on other investments, such as Treasury bonds. Suppose that the interest rate on Treasury bonds is 5 percent. Stocks are riskier than Treasury bonds because stock dividends are less certain than Treasury coupons. Risk-averse investors will consequently have a higher required return. How much higher? Some investors, looking back over the last 100 years, see that the average return on U.S. stocks has been some 5 to 7 percent higher than the average return on Treasury bonds and conclude that the risk premium going forward must be around 5 to 7 percent. However, we shouldn’t use after-the-fact returns to estimate before-the-event preferences, because U.S. stock returns over the past several decades probably turned out to be much higher than investors anticipated at the time.
A study of the twentieth-century performance of stock markets in thirty-nine different countries found that the U.S. stock market beat all the rest. It seems unlikely that investors worldwide knew that the twentieth century would turn out to be America’s century and the U.S. stock market would turn out to be the winner. If they had known that, they would have bought U.S. stocks instead of other stocks. It is more likely that the remarkable performance of the U.S. stock market was a pleasant surprise to investors who owned U.S. stocks.
The question going forward is how much of a risk premium you require. If long-term Treasury bonds pay 5 percent, would you be satisfied with a 12 percent anticipated return from stocks? Most likely. What about 10 percent? Or 8 percent? It’s your call and it has nothing to do with how well the U.S. stock market has done over the past hundred years.
THE CONSTANT-GROWTH MODEL
Investors often predict future dividends by assuming that dividends grow at a steady rate each year. In this case, a stock’s intrinsic value (the present value of all its future dividends) is given by an equation derived by John Burr Williams, which I call the JBW equation:

The intrinsic value V is equal to the current dividend D, divided by the shareholders’ required return R minus the dividend growth rate g. Suppose the dividend is $5 and the required return is 10 percent. If dividends grow at 5 percent, the intrinsic value is $100:
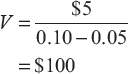
Dividends never grow at a perfectly constant rate, but the JBW equation is a reasonable approximation with logical implications.
First, it makes sense. Suppose you buy the stock for $100. The initial $5 dividend is a 5 percent return on your $100 investment. If dividends grow by 5 percent, the dividend will be $5.25 next year and the stock’s value will be $105:
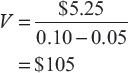
You get a 5 percent dividend and a 5 percent increase in the stock’s value, which gives you a 10 percent total return. Year after year, the dividend and value grow by 5 percent, keeping the dividend yield at 5 percent and increasing the value of your investment by 5 percent. Year after year, you get a 10 percent return.
Think about this for a moment, because it is very important and yet not always fully appreciated. If you buy a stock with, say, a 3 percent dividend yield, and the dividends grow by 5 percent a year, a reasonable estimate of your long-run return is 8 percent. The JBW equation makes no assumptions about future stock prices; it assumes that you never sell. However, the model is internally consistent in that if you do sell and market prices grow at the same rate as dividends, your total return, dividends plus capital gains, will equal your required return.
THE VALUE OF GROWTH
The JBW equation also demonstrates how important the growth rate is to the value of a stock. At a 10 percent required return, a stock paying a $5 dividend has an intrinsic value of $50 if there is no growth and an intrinsic value of $100 with 5 percent growth. The intrinsic values for other growth rates are shown in Table 6-1.
Growth makes a big difference because of the power of compounding. The difference between zero and 5 percent growth may not sound like much; but fifty years down the road, the first company will still be paying a $5 dividend while the second pays a $57 dividend.
Growth Rate, % |
Value $ |
0 |
50 |
1 |
56 |
2 |
63 |
3 |
71 |
4 |
83 |
5 |
100 |
6 |
125 |
7 |
167 |
8 |
250 |
This logic explains the lure of growth stocks, companies with high anticipated growth rates. The logic works in reverse, too. Sometimes, a company with bright prospects announces an earnings increase and its stock price free-falls downward. Why? Because the announced increase in earnings was not as large as had been anticipated, and small differences in growth rates can make a big difference to the value of a company’s stock. In Table 6-1, a scaling down of growth prospects from 8 percent to 6 percent cuts the intrinsic value in half.
A particularly dramatic example happened to Oracle, a software powerhouse, on December 9, 1997. Analysts had been expecting Oracle’s second-quarter sales to be 35 percent higher than a year earlier and its profits to be 25 percent higher. After the market closed on December 8, Oracle reported that its second-quarter sales were only 23 percent higher than a year earlier and its profits were only 4 percent higher. The next day, 171.8 million Oracle shares were traded, more than one-sixth of all Oracle shares outstanding, and the stock’s price fell 29 percent, reducing Oracle’s total market value by more than $9 billion.
As is so often the case, Mr. Market overreacted. The annual return on Oracle stock over the next sixteen years, through December 31, 2013, was 15.8 percent, compared to 4.1 percent for the S&P 500. A $10,000 investment in Oracle the day after its 1997 crash would have grown to $105,000 compared to $19,000 for the S&P 500.
A more prolonged example involved Disney, a favored growth stock that fell from a high of $122 on January 19, 1973, to $17.50 on December 17, 1974, even while its earnings were increasing. Its 1973 earnings of $1.64 a share were 16 percent above 1972’s $1.41 earnings, but below analysts’ optimistic $1.80 to $2.00 predictions. Even the revised predictions of $1.95 for 1974 proved to be optimistic, as earnings only increased slightly, to $1.66. Recession, inflation, and the energy crisis took their toll, but worst of all was the fear that Disney had changed from a glamorous growth stock into something a bit more mature and much less exciting.
This, too, proved to be an overreaction. If you had invested $10,000 in Disney on December 31, 1974, at a slightly recovered price of $21.375, you would have earned 15.5 percent a year through December 31, 2013, and your investment would have been worth $2.77 million, compared to 8.8 percent and $270,000 for the S&P 500.
More recently, on January 24, 2013, Apple reported a record quarterly profit of $13.1 billion, selling 28 percent more iPhones and 48 percent more iPads than a year earlier, but the stock dropped more than 12 percent, reducing its market value by $50 billion. Apple had sold a record 47.8 million iPhones, but this was less than the consensus forecast of 50 million. Earnings per share were higher than forecasted ($13.81 versus $13.44), and so was revenue ($54.7 billion versus $54.5 billion), but investors were used to Apple clobbering forecasts. A bit of a paradox here. If analysts expected Apple to beat their forecasts, why didn’t they raise their forecasts? In any case, Mr. Market was scared and the price plunged. Will this, too, prove to be an overreaction?
While the value of growth cannot be doubted, the uncertainty in valuing rapidly growing companies is what kept Benjamin Graham away from IBM and other, more temporary highfliers. Thinking the same way, Warren Buffett has always had an aversion to speculative tech stocks and a fondness for boring companies that generate profits reliably: Benjamin Moore, Burlington Northern, Dairy Queen, Fruit of the Loom, GEICO, See’s Candies, Coca-Cola, Kraft, Procter & Gamble. When Buffett bought Apple stock in 2016, this did not mean that he had changed his mind about growth stocks. Instead, it signaled that he now viewed Apple as a money machine, a mature company with dependable profits and an attractive stock price.
There is an old Wall Street saying, “A bargain that stays a bargain isn’t a bargain,” suggesting that buying a stock for a price less than its intrinsic value is not a good investment if the price doesn’t increase afterward. Investors who focus on intrinsic value don’t think that way. Remember Warren Buffet’s aphorism, “My favorite holding period is forever.” Intrinsic-value investors are not dismayed if the price doesn’t go up, because they buy stocks for income, not price appreciation. In fact, if the price goes down and the income projections haven’t changed, they will buy more. In market panics, value investors say, “Wall Street is having a sale.” They back up a truck and fill it with bargains.
ECONOMIC EVENTS AND THE STOCK MARKET
The two main economic drivers of the stock market are the state of the economy (boom or recession) and interest rates. When the economy is strong, profits surge and dividends follow close behind. When recession hits, profits slump and dividends grow slowly, or even drop. When interest rates go up or down, so do the required returns used to determine the intrinsic value of stocks. Higher required returns reduce intrinsic values; lower required returns increase intrinsic values. This is why higher interest rates are bad news for the stock market and lower interest rates are good news.
It is often thought, wrongly, that the only reason interest rates affect the stock market is because they affect the economy—making it more or less expensive for firms to borrow money to expand and for households to borrow money to buy things. For example, in March 1986, a seasoned market observer wrote:
The force driving stock prices up is declining interest rates (and oil prices). Well, interest rates decline when lenders have lots of money but borrowers don’t have lots of need for it; that is, when business is slow. Like now. Every new statistic—retail sales off a bit, unemployment up a bit—indicates that the economy is only so-so. Which wouldn’t be so bad if the outlook for the economy were better. But it’s not. Despite lower interest rates, business doesn’t seem in a hurry to invest in new plants and equipment. . . .
What does it all mean? Only that the economy will putter along—no disaster but no great glory either—and the stock market will probably take a sharp decline.
He was seemingly oblivious to the fact that, even if the economy just putters along, lower interest rates, all by themselves, make stocks more valuable because they increase the present value of future dividends. As it turned out, the market did not take a sharp decline. The S&P 500 rose 26 percent over the next twelve months.
The evidence is everywhere, but most obviously in big market moves. The 1973–1974 stock market crash ended when interest rates peaked, and the 1985–1986 stock market surge coincided with a 3-percentage-point drop in long-term interest rates. The unemployment rate was near double-digit levels in 2009, 2010, and 2011, but there was a stock market boom fueled by the Fed reducing interest rates to keep the economy from collapsing.
ECONOMIC VALUE ADDED
If a company has strong earnings but doesn’t pay dividends, it is clearly worth something, but the present value of the nonexistent dividends is zero. We might assume that the company will eventually pay dividends, like Microsoft, Apple, and countless other companies that never paid dividends—until they did. Value investors might predict a future date when the company will start paying dividends and predict how big the dividend will be and how rapidly it will increase. Then they could calculate the present value of these distant dividends. Not an easy task! And what about companies like Berkshire Hathaway that generate enormous profits but may never pay a dividend, reasoning that they can help their shareholders more by using the money to continue making profitable investments?
I will discuss two value-investor alternatives in Chapter 7, based on models created by Robert Shiller and John C. Bogle. Another appealing approach is called economic value added (EVA). Suppose that a firm has $100 million in assets and earns $15 million, a 15 percent return on its assets. So far, so good. Some profits are better than no profits. However, economic value added depends on whether earnings are higher than shareholders’ required earnings. If shareholders require a 10 percent return, required earnings are $10 million and the firm’s $15 million in actual earnings provides an economic value added of $5 million. If, on the other hand, the shareholders’ required return is 20 percent, there is a $5 million shortfall. Instead of adding value, the firm is subtracting value.
Economic value added makes a lot of sense because it asks and answers the right questions—and it makes no assumptions about Mr. Market’s prices. The clincher is that, for firms that do pay dividends, economic value added gives the same intrinsic value as the dividend-discount model! The advantage of the EVA model is that it can be used for firms that do not pay dividends.
In the spring of 2000, Yahoo stock was one of the things I considered when assessing whether we were in a bubble. At that 36K conference, I noted that Yahoo’s stock price was $475 a share at the start of the year. Unlike most dot-coms, Yahoo was profitable, earning $55.8 million. Still, this was only 20 cents a share. Yahoo’s price-earnings ratio (P/E) was a mind-boggling 2,375.
Yahoo didn’t pay a dividend and there were no dividends in the foreseeable future, so the dividend-discount model couldn’t be used to value its stock.
Could Yahoo’s price be justified by plausible assumptions? Here’s where economic value added comes in handy. With $1.24 billion in assets, a 10 percent shareholder required return implies required profits of $124 million. Yahoo’s actual $55.8 million profit in 1999 was $68.2 million less than required. Instead of economic value added, Yahoo had economic value subtracted of $68.2 million. To justify its $125 billion market value, Yahoo would have needed an annual EVA of $1.3 billion in 2000, $2.6 billion in 2001, $3.9 billion in 2002, and so on forever.
This is an interesting number because Walmart’s 1999 economic value added was $1.3 billion. So, to be worth its market value, Yahoo would have to be as profitable as Walmart in 2000, twice as profitable in 2001, three times as profitable in 2002, and so on.
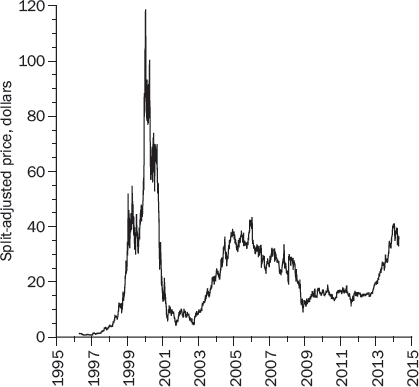
It is hard to escape the conclusion that Yahoo was deliriously overvalued. The market soon came to its collective senses and Yahoo stock fell off the proverbial cliff (see Figure 6-3). Yahoo’s stock plummeted 90 percent over the twelve months following the 36K conference in the spring of 2000.
In the spring of 2000, value investors could not predict what Yahoo’s stock price would be in the next few months or years, but they were confident that Yahoo’s bubbly stock price made it an extremely unattractive value investment.
PRECIOUS-METAL IRAS
We’ve all heard and seen advertisements urging us to invest our individual retirement accounts (IRAs) in gold, silver, and other precious metals:
Gold carries the unique distinction of always maintaining its intrinsic value, which means gold has never been worth zero.
Don’t rely on stocks, bonds, and other paper-based investments valued according to others’ opinions.
Precious metals protect your investment and ensure that you are not putting your future in the hands of a volatile stock market.
Nothing brings peace of mind like knowing your retirement assets are precious metals stored in a fortified bank vault.
The Taxpayer Relief Act of 1997 allows people to invest their IRAs in precious metals. Many precious-metal companies try to persuade people to do so. These arguments, taken from their advertisements, are unpersuasive. “Never worth zero” is hardly an assurance that the value won’t drop precipitously. Yes, stock prices depend on the opinions of others, but so do precious-metal prices. Yes, stock prices are uncertain, but so are precious-metal prices.
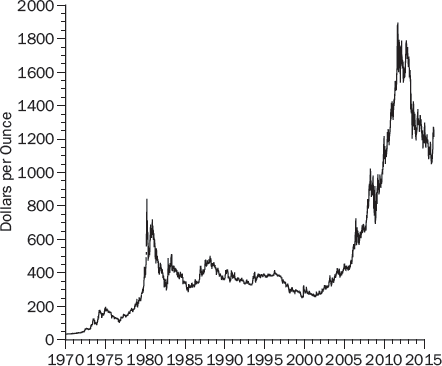
Figure 6-4 shows the daily price of gold back to the 1970s, when governments abandoned the fixed exchange rate of $35/ounce. The price hit a high of $843 in January 1980, then fell over the next twenty years to $252 in June 1999. Then the price surged upward to a peak of $1,896.50 in September 2011, before falling 45 percent to $1,050.60 in December 2015.
And yet, after all these booms and busts, newspaper, magazine, radio, television, and internet ads continue to tout gold as a safe investment. Perhaps the most dangerous part of this nonsense is that IRAs are intended to maintain the living standards of retired people. It sounds cruel, but the main financial risk during retirement is outliving one’s wealth and having to live in poverty. It is little comfort to retirees to know that their IRAs will never go all the way to zero.
The most salient fact about gold is that it has no intrinsic value, because it generates no cash whatsoever. In fact, it has a negative intrinsic value to the extent that investors must pay storage and security fees to safeguard it. In a 1998 speech at Harvard, Warren Buffett said that gold “gets dug out of the ground in Africa or someplace. Then we melt it down, dig another hole, bury it again, and pay people to stand around guarding it. It has no utility. Anyone watching from Mars would be scratching their head.” In his 2011 letter to Berkshire Hathaway shareholders, Buffett estimated that if we were to collect the world’s gold stock and melt it into a giant 170,000-ton cube, it would be about sixty-eight feet on a side and fit inside a baseball field easily. At the 2011 price of $1,127 per ounce, it would be worth about $9.6 trillion.
For that $9.6 trillion, we could instead buy all U.S. cropland, which generates $200 billion in revenue each year, plus sixteen companies the size of ExxonMobil, each earning $40 billion, and still have $1 trillion left over to buy other revenue-generating assets. Buffett concludes with his usual wisdom and wit:
A century from now the 400 million acres of farmland will have produced staggering amounts of corn, wheat, cotton, and other crops—and will continue to produce that valuable bounty, whatever the currency may be. Exxon Mobil will probably have delivered trillions of dollars in dividends to its owners and will also hold assets worth many more trillions (and, remember, you get 16 Exxons). The 170,000 tons of gold will be unchanged in size and still incapable of producing anything. You can fondle the cube, but it will not respond.
Value investors do not buy metals—no matter how precious—because metals do not generate cash; they are not money machines.
*Here’s the math. The present value of $1 received n years from now is $1/(1 + R)n, where R is the required return.