
|
Name |
Usage |
User Growth Block |
Graph Stats |
|
Module Type |
Block |
Block |
Block |
|
Author |
José Coelho |
Valery Fremaux, Emeline Daude |
Eric Bugnet |
|
Released |
2008 |
2009 |
2006 |
|
Maintained |
Actively |
Limited |
Actively |
|
Languages |
Basque, Catalan, English, German, Hebrew, Hungarian, Portuguese |
English, French |
English, French, Hungarian, Polish, Russian |
|
Compliance |
Good |
OK |
Good |
|
Documentation |
Online documentation |
None |
None |
|
Errors |
Errors displayed with error reporting turned on |
None displayed |
None displayed |
Sometimes there is a need to get a broader picture of what is going on. How many students are there? How many users have used the site recently? How often are users connecting? There are a number of blocks that attempt to answer these questions.
The Graph Stats block needs to be downloaded from the author's website. The Usage and User Growth blocks are downloaded as normal from http://moodle.org/.
Once you have all the blocks, unzip them and copy the block directories into the /moodle/blocks/ directory, then visit the Notifications page.
The Usage and User Growth blocks each have global settings, but you need not change them in order to use these blocks. The Graph Stats block will force you to view and save the global settings when the block is installed. When shown in Moodle, the Graph Stats block is referred to simply as Statistics.
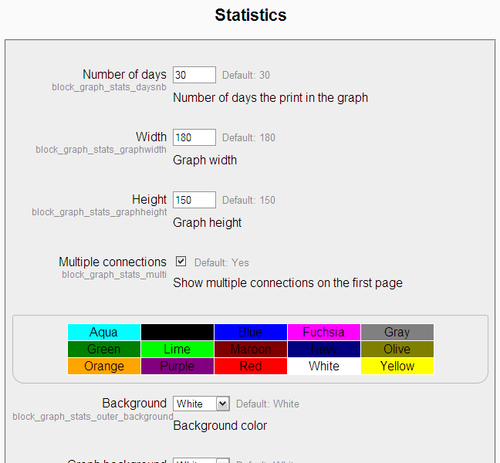
You can accept these settings and save them as it is. If you wish the graph to show a shorter or longer period than 30 days, you can change this default. The setting labeled Multiple connections controls the counts of connections. Each day the number of individual users who connected is shown; the block can also show the total number of connections (including reconnections) on the same day. The remaining settings relate to the presentation of the block and its embedded graph.
These three blocks are primarily intended to be shown on the site root page. They can be used on course pages, but they may not perform as you would expect on those pages; connections and user numbers are really site-wide figures.
Each block can be added from the Blocks menu. The Usage block is titled Usage, the User Growth block is titled Active users, and the Graph Stats block is labeled Statistics.
When the blocks are added to the site root page, they can be viewed by everyone, even users who are not logged on. If you are running a live site, you may want to limit who can view the blocks by changing view permissions for various users. You can access these permissions by clicking the icon labeled Assign roles in the header of each block, going to the Override Permissions tab, selecting each user role you wish to change and altering the View block capability of each role in turn.
Of the three blocks, only the Usage block has any instance settings. Clicking on the configuration icon for that block will show the following settings:
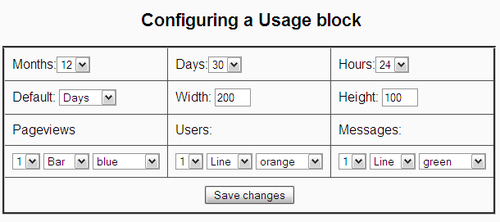
The row and column layout of this collection of settings is a little misleading. The top two rows are independent of the rows below.
The block can show usage statistics over three timeframes: months, days, and hours. The length of these timeframes can be adjusted independently by changing the settings in the top row.
The second row of settings controls the appearance of the block including the initial view and the dimensions of the graph inside the block.
The bottom two rows control how the three measured statistics are presented. Each aspect can be turned on and off using the first 1/0 setting. Each count can be presented as a horizontal line, a vertical bar, or as a filled area. The color of each statistic can also be chosen.
When the Usage block has been added, it shows the following:
- The number of page views
- The number of users who connected
- The number of forum posts made
The statistics appear, as defined, with the most recent statistics appearing on the right of the graph and earlier statistics displayed working towards the left:
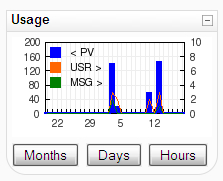
At the bottom of the block there are three buttons. These control the timeframe displayed in the graph. The default view is days, so the last 30 calendar days are shown. Clicking either Months or Hours shows a different graph for those timeframes, without reloading the page.
The User Growth block shows the number of users in the system over the last 12 calendar months. Each vertical bar indicates the number of users who had accounts created in that month or earlier, in other words, the graph is cumulative over time:
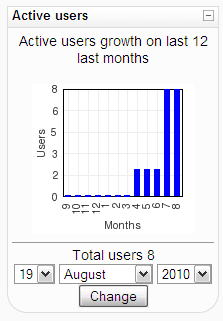
The timeframe can be shifted backwards in time, so you can see how growth happened during earlier years. You can also view periods forward in time and doing so assumes the current number of users will continue (unless the authors have some special code that can look into the future). With a new timeframe set, clicking on the button labeled Change will reload the page with the selected timeframe displayed.
The Graph Stats block shows connection statistics over the last month (or set number of days). The graph shows the number of unique users who connected each day, and the total number of connections made (which will differ from the number of users if users log in more than once on a day).

At the bottom of the block the total number of users with current accounts in the system is shown, together with a count of courses on the site; this count includes the root page (which is treated as a limited course within the system).