In this chapter, we describe the basic programming tools needed to provide stereoscopic 3D views of the polygons.
6.1 Basics of a Stereoscopic Scene
To produce stereoscopic 3D views of polygons, we create two images of the three-dimensional objects. The first image is the projection of the three-dimensional polygons onto the screen, using the equations given in Chapter 4 and a point of projection with coordinates (VX1, VY1, VZ1). The second image uses a second point of projection with coordinates (VX2, VY2, VZ2), slightly shifted horizontally from the first. Note that VX2=VX1+⊗X, VY2=VY1, and VZ2=VZ1. Here, ⊗X represents a small shift.
The two images obtained will not be displayed on the screen. Instead, we store them in a memory region to be binary ORed. The resulting image will appear on the computer's screen. Therefore, this process requires us to allocate three binary images in a memory region.
To appreciate the stereoscopic effect, you need to observe the scene through colored filters, red for the left eye and cyan for the right eye. For this purpose, you can construct glasses made with red and cyan cellophane films, which are commercially available, or you can acquire commercially available glasses specifically made for this purpose (often called 3D glasses). However, in both cases, we must ensure that each filter transmits only its corresponding color. In our experience, we had to add an extra film to the red filter. Additionally, we must take care of the properties of the cellophane films as we have found different transparency qualities among them.

Program screenshot obtained from an Android cell phone. Best viewed with 3D glasses
6.2 Programming and ORing the Images
To calculate the binary OR between the left and right images, we have to import Pillow into our program, which is a specialized library for image processing. To verify if you have it installed on your computer, use the pip3 list directive . It should appear on the list. Otherwise, you can install it by typing the pip3 install Pillow command in your Terminal window.
We need three modules from Pillow, which will be available in the program by using the from PIL import Image, ImageDraw, ImageFont directive.
From the three libraries, Image will allow us to create the three images that this process requires. The second module, ImageDraw, provides tools for drawing lines. We will use straight lines to draw the edges of our polygons and to fill their faces. In our working example, we will fill only the back faces of our polygons. Finally, the last module, ImageFont, will allow us to display text.
Because the resulting image is a binary one, to be able to display it on the screen, we need to convert it into an appropriate image file. For our working example, we will use the png format. We will perform this conversion in a memory region. Therefore, we need to allocate memory and make it behave as a file. We will refer to a block of memory with this characteristic as an in-memory file. We will achieve this task using the library io, which we will incorporate into our program with the import io directive . Finally, the image stored in the in-memory file will be converted into a Kivy image to be displayed on the screen. We describe this process in detail in the following sections.
6.3 Projections
The program begins by creating the three required images by utilizing the Initialize(B, *args) function , which receives the handle B to access the widgets. Initialize(B, *args) uses the Image.new directive from PIL to create the three images, which we will name PilImage1, PilImage2, and PilImage3. The first image, PilImage1, will store the red image, while PilImage2 will store the cyan image. PilImage3 will store the result of the bitwise OR operation.
Additionally, to draw lines, we need to create two drawing instances, which we will name Draw1 and Draw2. These instances also allow us to display text.
We want to display a rounded frame like the one depicted in Figure 6-2, so the dimensions of our PIL images will be reduced by ten pixels in width and height compared to the Kivy image declared in the file.

Program screenshot showing text
The Initialize(B, *args) Function
- 1.
ShowScene(B) creates two NumPy arrays, called Array1 and Array2, resulting from the conversion of the data stored in PilImage1 and PilImage2.
- 2.
An additional array, named Array3, is created as a result of bitwise ORing the elements of Array1 with Array2.
- 3.
PilImage3 is created after converting Array3 into image data.
- 4.
At this point, PilImage3 is converted into a Kivy image, following the procedure given at
https://stackoverflow.com/questions/10762454/load-image-from-memory-in-kivy
The procedure is as follows.- a.
A region of memory, behaving as a file, is allocated using the Memory=io.BytesIO() directive. This directive provides a memory region named Memory that can be used as a file. Now we can store our image in this memory block by means of the PilImage3.save(Memory, ext="png") directive.
- b.
As Memory behaves like a file, it has an inherent file pointer. Each time we access it for writing or reading, this file pointer is updated. Therefore, before copying the image to the Kivy widget, it is necessary to reload the file pointer to the beginning of the file, where our data will be stored. This is accomplished by using the Memory.seek(0) directive.
- 5.
We now proceed to convert the image into the png format by using the ImagePNG = CoreImage(Memory, ext="png") directive. Now, ImagePNG holds our result.
- 6.
The final step consists of copying ImagePNG to the Kivy image widget that is declared in the File.kv file. As ImagePNG has the appropriate format, it will be displayed on the screen simply by using the B.ids.Screen1.texture = ImagePNG.texture directive.
Freeing Previously Allocated Resources
Code for the ShowScene(B) Function
Function to Clear the Screen
6.4 Polygon Structure
To place the polygon in a stereoscopic scene, you can use the same polygon structure described in Chapter 5.
A stereoscopic scene provides depth perception, which means that small changes in the Z-coordinate can cause changes in the polygon position that can drive it off-screen. Therefore, it is convenient to devise a method to help position the polygons.
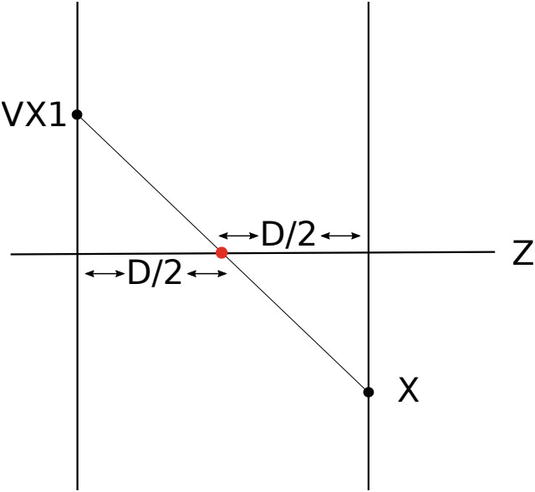
Point X projected by the point of projection VX1. The red point, placed in the Z-axis, is in the middle of the two planes
In Figure 6-3, the Z-axis passes through the center of the screen and the projected point, X, is shifted from this center. This method consists in calculating this shift. This quantity, calculated using properties of similar triangles, corresponds to VX1. An analog situation occurs for the y-direction. We will shift the whole scene using this value.


 , substituting this value in Equation (6.3) allows us to define the following constant factor:
In Equation (6.4), Factor0 ∗ VX1 will shift the projection of the red point, or equivalently, the point (0,0,0) precisely to the center of the screen.
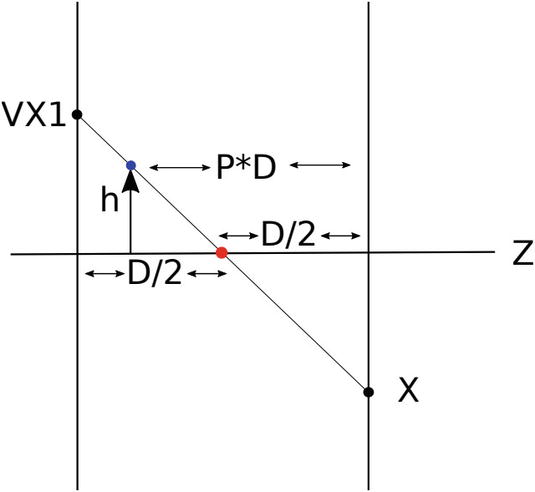
Positioning an arbitrary point (blue point) to attain the same projection as the red point


Equation (6.6) specifies that, when the blue point is positioned at a vertical height h and at a distance Z=P*D from the screen, it will give the same projection X as the red point. The complete scene will be shifted by an amount equal to Factor0 ∗ VX1, so the red point and all the points satisfying Equation (6.6) will be projected at the center of the screen.
From this description, we can now describe our method for positioning the polygons at distances Z=P*D from the screen. The method consists of positioning the polygons first at the center of the screen using Equation (6.6), and then shifting them to a desired position.
Equation (6.6) does not depend on the parameter D, which means we can experiment with different stereoscopic perspectives using different D values, without the drawback of losing the polygons from the scene.
Filling the Cube Polygon
Although they are not used here, we maintain the polygon colors in the 2*Num+1 place of the structure, as in Chapter 5, for compatibility purposes.
6.5 DrawAxes Function
The DrawAxes (P, VX, VY ,VZ, Which) function is in charge of drawing the three-dimensional axes on the screen. This function receives a parameter P, corresponding to a polygon structure, and the three coordinates of a point of projection, (VX, VY, VZ). The parameter Which is 0 for the red projection and 1 for the cyan projection. In our program, VZ is always set to 0. This variable may be used in future applications. As described, the shifting values Factor0*VX and Factor0*VY are used to position the three-dimensional origin (0,0,0) at the center of the screen.
The DrawAxes(VX,VY,VZ,Which) Function
The DrawEdges(P, VX, VY, VZ, Which) and FillPolygon(P, VX, VY, VZ, Which) functions are similar to their respective functions described in Chapter 5, with the addition of the Which parameter.
6.6 Points of Projection
The points of projection for the red and cyan images have horizontal coordinates VX1 and VX2 and should differ slightly. In principle, increasing the difference between VX1 and VX2 produces a better stereoscopic appearance. However, there is a maximum difference allowed. It is advisable to experiment with different values.
Code Listing for main.py
Code Listing for File.kv
6.7 Summary
In this chapter, we programmed the polygons in 3D stereoscopic scenes. We placed and rotated them using the three-dimensional projection equations derived in previous chapters. We created two images using Pillow and performed the logical OR between them using NumPy. Finally, the resulting ORed image was converted to a Kivy image and displayed on the screen.