
7
Research methods for studying multilingual information management: an empirical investigation
Abstract
This chapter presents the findings of a study undertaken to apply the research framework and model devised and investigate the adoption of ICT by translators. Thus, the analysis of the collected data over the two stages of the study provided a comprehensive view of what the information and technology-related needs of this community of practice are.
Keywords
ICT adoption
CAT tools
web resources
Internet usage
quantitative research
qualitative research
descriptive findings
empirical research
“Cross-disciplinary research, […] requires familiarity with measuring techniques in more than one discipline.”
(Oppenheim, 1992, p. 7)
In order to illustrate how the presented research framework and model can be applied to investigate a community of practitioners, this chapter presents the research method followed during previous work undertaken by the author between 2002 and 2005.1 Therefore, this chapter is focused on presenting a suitable research method to design instruments based on previous validated research that enable enquiring about the aspects identified in the research model, and on presenting a plan to analyse the data through quantitative and qualitative techniques. To do so, first some of the research methods used by previous studies in related research areas are reviewed, notably in ICT adoption research and in translation studies research, and a specific research design is proposed and justified. Next, the design of the research instruments and data collection methods used are detailed. Finally, an overview of the data analysis approach performed is presented.
7.1. Research approaches
Studies in the disciplines informing this interdisciplinary research have followed various research approaches, which are summarised in this section.
Easterby-Smith et al. (1999) identify three reasons that the exploration of philosophy may be significant with regard to research methodology: first, it can help the researcher to refine and specify the research methods to be used in a study, that is, to clarify the overall research strategy to be used. This would include the type of evidence gathered and its origin, the way in which such evidence is interpreted, and how it helps to answer the research questions posed. Second, a knowledge of research philosophy will enable and assist the researcher to evaluate different methods and avoid inappropriate use and unnecessary work by identifying the limitations of particular approaches at an early stage. Third, it may help the researcher to be creative and innovative in either the selection or adaptation of methods that were previously outside his or her experience. There has long been a debate about the underlying philosophy that should guide valid research, where quantitative research has generally been associated with positivist philosophical traditions, and qualitative research has commonly been associated with interpretivism. Within the social sciences there is an increasing belief that this debate between positivists and anti-positivists is inadequate to address the problems facing researchers in today’s world (Cornford and Smithson, 1996).
Oppenheim suggested that “no single approach is always or necessarily superior; it all depends on what we need to find out and on the type of question to which we seek an answer” (Oppenheim, 1992, p. 12). It is now widely acknowledged that a research approach (or strategy) must be selected according to the object of study, the specific research questions and objectives of that study, and the setting in which the research is undertaken so that valid answers are obtained to the research questions. This choice should then be more a matter of appropriateness, rather than a decision only driven by a philosophical perspective (Crossan, 2003).
A number of research approaches are available to information systems researchers, each having its own strengths and weaknesses (Mumford et al., 1985). Galliers (1992) proposed a taxonomy2 of information systems research approaches which identified and compared the following ten research strategies used in IS research: theorem proof, laboratory experiments, field experiments, case studies, surveys, forecasting, simulation, argumentative studies, interpretive studies and action research.
Although various research strategies have been employed to study ICT adoption in small firms, including interview-based studies (Baker, 1987), longitudinal studies (Cragg and King, 1993), and case studies (King and McAulay, 1989; Caldeira and Ward, 2002), most of the previous research undertaken in this area by the end of the 20th century had been conducted from a positivist perspective3 through the use of questionnaire-based surveys (see, for example, Raymond, 1985; Lees, 1987; Raymond, 1987; DeLone, 1988; Lefebvre and Lefebvre, 1988; Montazemi, 1988; Raymond, 1989; Kagan et al., 1990; Yap et al., 1992; Daniel et al., 2002).
Much of the research on ICT adoption in the translation sector has been devoted to the adoption of translation tools. However, previous studies have not tended to be focused specifically on freelance translation businesses, but rather considered translation tools adoption in translation businesses in general, in large organisations, or a mix of both large and small translation organisations. Among these studies there have only been a few in-depth surveys (see, for example, Webb, 2000; Fulford, 2001; Höcker, 2003; Lommel, 2004; Fulford and Granell-Zafra, 2005; Dillon and Fraser, 2006; Lagoudaki, 2006), and a number of case studies on translation tools adoption in large organisations (King, 1998; Jaekel, 2000; Lange and Bennett, 2000). Most of the studies in the translation sector, like in the area of IS, have been conducted from a positivist perspective.
Interpretivist approaches (i.e. simulation, argumentative studies, interpretive studies and action research), and the other empirical approaches available (i.e. theorem proof, laboratory experiments, field experiments and forecasting), according to Galliers’ taxonomy (1992), have not been used much in previous studies of ICT adoption, and did not seem to suit the particular context of this research. Accordingly, survey and case study research approaches are further discussed below.
Survey research permits the examination of a phenomenon in a wide variety of natural settings. This examination essentially comprises a snapshot of practices, situations or views at a particular point in time, and is typically undertaken using questionnaires or structured interviews, from which inferences may be drawn (Galliers, 1992). In survey-based research the researcher has a clearly defined model with independent and dependent variables and the factors that affect it, so that anticipated relationships can be tested against observations of the phenomenon under investigation. The major strength of the survey approach is that it permits the collection of data from a large number of subjects, thus allowing quantitative analysis to test inferences, and giving the potential to generalise the findings to an even larger number of cases. One of the major disadvantages of this approach is that the variables under study have to be known in advance. Thus, it can only be used in relatively well understood situations.
The case study approach is commonly used in the study of issues that are not well understood, or where relationships between the context and the phenomenon under study are not clear (Yin and Campbell, 2002, p. 13). The strength of the case study approach is that it enables the researcher to capture reality in considerably greater detail than is possible in a questionnaire survey. Weaknesses of the case study approach include the fact that its application is usually restricted to a single organisation, or to just a small number of organisations.
7.2. Selecting a suitable approach
In order to investigate the adoption of ICT by freelance translators in the UK and the factors affecting that adoption, a survey approach was deemed to be the most suitable method for data collection. A key advantage of the this approach is that it permits the collection of data from a large number of subjects and thus enables gathering data from a larger sample of professionals to obtain an overall picture of the freelancers of the multilingual information management sector in the UK. The types of survey frequently used in social research include questionnaires, interview, observation studies, and content analyses (Bryman and Bell, 2003). For practical reasons, a questionnaire survey was deemed to be a suitable method for data collection in the present study, since the researcher had access to lists of professional translators that belonged to a professional association. Therefore, the mailed questionnaire method seemed the most suitable way for obtaining a substantial number of responses from a geographically dispersed sample. The options of using telephone or email surveys were discarded as suitable contact details were not available to the researcher and in an open online survey there would have been no straightforward means of control over the reliability of the eventual participants.
The survey approach was deemed to be more powerful than a case study approach for quantifying relationships in the research model. However, questionnaire-based surveys can be weak at providing insights about particular issues. Therefore, a decision was made to follow the gathering of quantitative data in the questionnaire survey with a more in-depth study of individual cases in order to permit a closer examination of issues and relationships. The initial survey exploring the adoption of ICT by translators in the UK was then followed by further fieldwork in order to gain more detailed insights about the decision to adopt CAT tools of the participants. The aim of this second phase of the fieldwork was to shift the study from a “descriptive” to an “analytical” design (Oppenheim, 1992, p. 12).
A number of research design options were considered for this subsequent phase of the research, including interviews, focus groups and a further questionnaire survey. Focus groups are typically designed to collect data from a limited number of participants through a focused discussion among the group of participants (Lewis-Beck et al., 2003). Such groups may stimulate participants’ thinking and elicit ideas about a specific topic (Gliner and Morgan, 2000, p. 341). However, the goals of this second phase of the fieldwork required more detailed information from each individual adopter or non-adopter of specialist ICT, and thus focus groups were rejected. Interviews allow the gathering of data in more detail from each subject, and can be conducted either face-to-face, by telephone or by online methods. However, a large number of interviews would have had a high economic cost and they would have required a longer timescale than the available one, so interviews were ruled out because they did not allow the collection of data from a large number of translators.
In the light of the above drawbacks of interviews and focus groups, a decision was made to conduct a further questionnaire-based survey. A survey approach would again allow collecting data from a geographically dispersed and larger sample without incurring greater expenses and, at the same time, it would allow us to ask open-ended questions to capture qualitative information. In addition, since the participants were identified from the sample of the first survey, had given their consent to collaborate further, and had facilitated valid email addresses, an online survey was deemed a suitable method to conduct this phase of the research.
Online data collection methods are regarded as a faster and less costly way of collecting a larger volume of detailed information in shorter time scales than traditional data collection methods (Gaiser, 1997; Clarke, 2000; Dillman, 2000). At the same time, these methods simplify the data collection process, allow the collection of a large number of responses, and can ensure the accuracy of the collected data by adding responses automatically into a database, offering significant savings in terms of data entry (Mann and Stewart, 2000). In contrast with traditional data collection methods, some extra time should be devoted to designing and planning this type of online study, but once ready, the time required to collect the data and prepare the responses for their analysis would be reduced.
The online survey included a combination of a web-page-based questionnaire with email messages similar to email surveys (Mann and Stewart, 2000), thereby gaining some of the advantages of this type of survey, too. For example, the convenience of initially contacting participants to ask them to collaborate further in this research, to explain to them how to access the website containing the questionnaire, and to open a communication channel with the researcher should they have any queries. The advantages and potential of an online survey were clear in terms of gaining access to the participants quickly, cost and time savings, eliminating transcription bias, and easier handling of data than by manual methods (for a more detailed discussion of the benefits of online research methods, see Mann and Stewart, 2000).
Nevertheless, such methods also have disadvantages that can represent a challenge for the researcher (also discussed in detail by Mann and Stewart). In fact, these authors claim that “[o]nce a researcher has decided that CMC [Computer-Mediated Communication] is the way forward, the first practical step is to ensure that the researcher and all respondents have access to the required technology and the confidence to use it” (Mann and Stewart, 2000, p. 66). The first challenge, therefore, relates to the technological infrastructure and knowledge required to set up the survey and get the responses from the participants. Also, “establishing contact for individual person-to-person CMC usually involves a mutual exchange of email addresses” (ibid), which sometimes can create problems when recruiting participants and contacting them without their consent, which could be considered “spamming.”
These initial challenges were overcome by the characteristics of the sample and the researcher. The sample consisted of a number of participants from the first survey who (1) had previously agreed to collaborate further with this research after participating, (2) provided their email addresses among their contact details, and (3) were regular email users and familiar with Internet technologies. The researcher’s expertise in HTML programming and Internet technologies was satisfactory to set up the study and run it to the expected standards.4
The use of mixed approaches is often recommended in the literature. Bryman maintained that “the use of more than one method […] can greatly enhance the process of fusing problem and method, by allowing the researcher to reap the opportunities presented by two or more techniques” (Bryman, 1989, p. 248). Others point out the legitimacy of combining methods in the research design if such a strategy addresses the study’s research questions (Miles and Huberman, 1994; Brannen, 1995). Burgess, (1984) defines “multiple research strategies” as the use of diverse methods in tackling a research problem. This strategy has traditionally been referred to as “triangulation” (Denzin, 1970). Denzin distinguishes four different types of triangulation: multiple methods, multiple investigators, multiple data sets and multiple theories. Multiple methods triangulation can be between-methods or within-method. A within-method approach involves the same method being used on different occasions, while between-methods means using different methods in relation to the same object of study. The design of this study fits into the “multiple methods”–“between methods” approach defined by Denzin and was structured in two phases:
• Phase 1: ICT adoption and use exploratory study; conducted through a mailed questionnaire;
• Phase 2: In-depth analysis of organisational impacts and evaluation of ICT sophistication; conducted through online survey methods.
7.3. How to explore ICT adoption and use
As explained before, the exploratory study comprised a mailed questionnaire survey to UK freelance translators. Its main goal was to obtain a snapshot of ICT usage among freelance translators, that is, to provide a profile of translators and their use of general-purpose ICT and translation-specialised tools and resources, as well as their attitudes towards them. In addition, this questionnaire survey permitted the identification of a sample of CAT tools users and CAT tool non-users that could be studied further in the next phase of the research.
7.3.1. Questionnaire design considerations
The questionnaire was designed following suggestions from previous studies about survey methods, mainly Dillman’s recommendations for a total (1978) and tailored (2000) design method. Dillman’s Total Design Method (TDM) for the development and use of a mail questionnaire (1978) was borne in mind in order to ensure a satisfactory response rate following the maxims of minimising the cost for responding, maximising the rewards for doing so, and establishing trust that those rewards would be delivered. Dillman’s most recent contribution to the design of mail surveys (defined as the Tailored Design Method in Dillman, 2000) also provided useful recommendations on writing questions, constructing the questionnaire and implementing the survey.
Following Dillman’s recommendations, a cover letter was produced along with the questionnaire. This letter highlighted the relevance of the study, the importance of the participation of the translators, as well as the benefits that they would obtain from participating in the study. As an additional incentive to encourage participation in the study and increase the response rate, two measures that were adopted: the offer to respondents of a copy of a summary of the findings of the study and an additional prize draw with prizes of book vouchers for three of the respondents. Following another recommendation made in the survey research literature, stamped addressed envelopes were provided for return of the questionnaire. In addition to the cover letter, a letter of endorsement was enclosed with the questionnaire. This letter was written by the Director and Chief Executive of the professional body from which the mailing list was obtained.
All these measures contributed to delivering a reliable questionnaire that was clear, interesting, easy to return and had a professional layout. In addition, these efforts would help to involve translators in the study and increase the response rate substantially.
The appearance of the questionnaire was kept simple and visually attractive. Sans serif fonts were used in the questionnaire to increase its readability, as well as bold format and text boxes to enable the identification of the different sections of the questionnaire. The front cover was also simple, but eye-catching, and it clearly identified the researcher’s name, organisation and contact information, as well as a title that was directly related to the study. Moreover, basic instructions for completing the questionnaire, as well as a clause ensuring confidentiality and thanking the participants for their cooperation, were included at the bottom of the front cover. A copy of the questionnaire is included in Appendix 1.
7.3.2. Instruments and structure of the questionnaire
In order to establish the sequence of the sections of the questionnaire, Dillman’s suggestions were considered for increasing the respondents’ motivation for, and confidence in, completing the questionnaire (Dillman, 1978). Accordingly, questions that were similar in content or type were grouped together. The order of the questions took advantage of the cognitive ties that respondents were likely to make among the groups of questions. Questions that were more likely to be difficult were placed after questions that were likely to be easier to answer.
As a result, the questionnaire was structured in four sections as follows:
• Section A: Translator profile
• Section B: Information Technology (IT) usage
• Section C: Internet usage
• Section D: IT strategy
Where appropriate, validated research instruments were drawn from existing research on ICT adoption and adapted for this study. The sections of the questionnaire and the instruments used are now presented in detail.
7.3.2.1. Section A: Translator profile
This section contained questions regarding translators’ characteristics and the characteristics of their translation business. In particular the following issues were addressed:
• educational background, such as educational level and translation qualifications;
• demographic data, such as age and gender;
• data about their employment situation, such as whether they were working in-house, as a freelancer, or managing a translation company; how many years they had been working as translators; their workload; the services they provided; the language combinations they translated; and the subject fields they worked in.
Also, in order to help with the pre-screening of freelance translators, translators were required, immediately after the section on translator profile, not to continue with the rest of the questionnaire if they were not, at that point in time, actively involved in translation work.
7.3.2.2. Section B: Information Technology usage
This section consisted of questions about the IT skills and IT qualifications of the translators, followed by a question about their familiarity with, and their working knowledge of, a number of software applications.
With regard to IT current usage, Raymond and Paré’s instrument for measuring IT sophistication in small manufacturing businesses (Raymond and Paré, 1992) was used to develop the question about IT usage (Question 17). These authors defined IT usage in terms of “technological sophistication” and “informational sophistication.” These aspects of IT sophistication basically refer to “the number or diversity of information technologies used by small businesses” (i.e. the type of technology used) and “the nature of the applications portfolio” (i.e. the function of the type of applications). In this study, the translators were asked to indicate whether they were currently using a number of IT applications, which had been grouped according to their function (e.g. document production, business management, translation production).
With regard to IT knowledge, Magal and Lewis (1995, p. 76) defined IT knowledge “in terms of awareness of, familiarity with, exposure to, or a working knowledge of technology, rather than expertise.” They measured IT awareness by providing a representative list of software commonly used by SMEs and asked the respondent to indicate the extent to which they were familiar with the application or software. Hussin et al. (2002) and Ismail (2004) adapted and tested the measures with a sample of small manufacturing firms in the UK and with a sample of Malaysian manufacturing SMEs, respectively. The survey also adapted Magal and Lewis’s instrument to design the question about IT usage. The respondents were asked to indicate their level of familiarity with, and knowledge of, IT on a 4-point Likert-type scale with the following (ordinal) categories: a score of 1 represented “Not familiar,” a score of 2 represented “Familiar, but with no working knowledge,” a score of 3 represented “Familiar, with some working knowledge,” and a score of 4 represented “Familiar, with extensive working knowledge.”
7.3.2.3. Section C: Internet usage
This section of the questionnaire was designed similarly to the second part of section B, but in this case translators were asked about their familiarity and working knowledge with Internet-based tools and resources. It was separated from the earlier question on IT usage for pragmatic reasons of length and format and to explicitly ask translators about the online information sources and ways of accessing knowledge they used. Participants were also asked whether they had their own website to promote their services.
For the question on usage and experience with Internet-based tools and resources (Question 19), Raymond and Paré’s (1992) and Magal and Lewis’ (1995) instruments were used in a similar way to that of the earlier question of usage. Similarly, the same 4-point Likert-type scale was used for this purpose.
7.3.2.4. Section D: IT strategy
This section of the questionnaire consisted of three different types of questions regarding translators’ opinions on the technologies referred to in sections B and C of the questionnaire. After asking if the translators had a written business plan, a question was asked about the translators’ opinions on the importance and current use of IT for a number of tasks undertaken by translators. Chenhall and Morris (1986) developed and tested an instrument designed to measure accounting information systems (AIS) design in large organisational context, which was later adapted and tested in the small business context by Gul (1991), and more recently to measure both AIS requirement and AIS capacity in accounting SMEs by Ismail (2004). The scales used by Ismail’s instrument were used in the study to obtain translators’ opinions on the relevance of IT in their work. This relevance and use were measured using a 4-point scale ranging from “Not important” to “Very important” and from “None” to “Extensive” use.
Questions 22 and 23 measured the perceptions that translators have of ICT in general, and CAT tools in particular. The instruments used in these questions were based on one developed by Cragg (1990) to measure computerisation success, where the author was asking the respondents what they thought of a number of issues regarding the use of computers. In Question 22, the original instrument measured the attitudes of users and non-users of computers, which were phrased accordingly to obtain the information on translators’ perceptions of ICT in general. In Question 23, the statements in the original instrument on ICT in general were worded differently to capture translators’ perceptions of one particular type of ICT (CAT tools). One of the items (“Computerisation significantly improves my communication with customers”) could not apply to the use of CAT tools, and was substituted by an item asking about the respondents’ opinion on the cost of these tools (i.e. “CAT tools are well worth their cost”), which was one of the translators’ concerns that arose from the literature examined on CAT tools.
The last question (Question 24) further enquired about the translators’ ICT strategy. This question was adapted from Hussin’s instrument (1998) to measure various aspects of ICT strategy, which covered Earl’s (1989) three levels of strategy related to ICT, namely, the Information Systems strategy, the Information Management strategy, and the Information Technology strategy. Respondents were asked to indicate their position along a 5-point scale with regard to the bipolar alternatives listed in Figure 7.1.
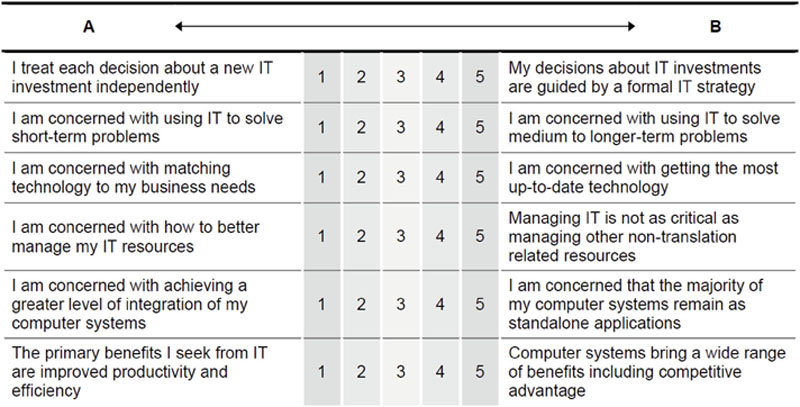
Figure 7.1 IT strategy bipolar items
Finally, the back cover of the questionnaire included a free text box for respondents to comment on the questionnaire or the study as a whole. A question was also included about whether the participant would be willing to participate in other stages of the research. Also, there was space for providing the participant’s contact details (name, address, and email) if they wanted to receive a copy of the summary of the survey findings.
7.3.3. Questionnaire refinement
As suggested by Dillman (1978) the questionnaire was refined before carrying out the data collection. The refinement of the questionnaire followed two stages: pre-testing by academics and research students and pre-testing by translators.
The questionnaire was first pre-tested by academics in the researcher’s university department, who had prior experience with surveys on ICT adoption, and also by fellow research students, who had designed and used questionnaires in their research. Useful feedback arose from these pre-tests. Overall, the layout of the questionnaire was perceived to be appealing, neat and easy to follow, although comments from the pre-testers helped with the rewording of some questions and statements to clarify their meaning, with the reordering of some statements to make them easier to follow, and with improvements to the layout. Based on this feedback, amendments were made to the questionnaire.
After pre-testing the questionnaire in an academic environment, it was rigorously pre-tested by six translators who were likely to have similar characteristics to the participants in the survey. This rigorous process of assessing the questionnaire’s content and clarity provided useful feedback which was used to improve it, until the questions could be clearly understood and answered without problems by the translators. The translators were also asked to answer the questionnaire and the overall impression from the answers given and the comments made by them was that the questionnaire was appropriate and ready to be delivered to the translators in the sample.
7.4. How to analyse organisational impacts and evaluate ICT sophistication
As in the first phase of the study, the design of the online study involved the development of the survey, adapting existing scales and measures where available, managing the technical issues involved in the creation of the web form, testing and piloting of the survey, the preparation of contact messages, handling the responses received, and keeping track of the participants’ interaction and their responses to the survey. These issues are explained in more detail in this section. The questionnaire for the online survey was designed similarly to a semi-structured questionnaire using open-ended questions to obtain both quantitative and qualitative information from the respondents, as opposed to the rigidity of using a structured questionnaire. Therefore, as noted by Easterby-Easterby-Smith et al. (1999, p. 112), this design is suitable for being analysed following the method suggested by Miles and Huberman (1994). Briefly, the analysis of the data using this method is accomplished by drawing conclusions from the visual patterns observed in a matrix sheet that displays the data extracted from the responses through a data reduction process (e.g. coding). This method is further explained in the section of this chapter presenting the analysis of the research.
7.4.1. Online questionnaire design considerations
A number of issues affecting online research methods were considered for the design of the online study. This section focuses on how such issues affected this study and how they were addressed.
In order to ensure that the participants had access to the required technology and the confidence to use it, an online study should be kept as easy as possible for respondents to access and complete (Dillman, 2000). Also, the virtual environment of the survey should be familiar to the respondents (Mann and Stewart, 2000). In seeking these priorities, some advantages from email and web-page-based surveys were met. First, all the communications between the researcher and the participants were made through text-based email messages, making them convenient for the respondents because they required no facilities or expertise beyond those that they use in their day-to-day email communication.5 Second, a website containing a form was used to collect the data from the survey, avoiding typical problems of email-based surveys, such as selecting several answers when only one choice is required, deleting questions accidentally, or altering their format (Mann and Stewart, 2000), and providing a visually attractive interface6 that appeared identical to all respondents, was easy to complete and submit, and whose data was in a completely predictable and consistent (coded) format, making automated processing and analysis possible by the researcher.7
Another challenge may arise from the perception of the notification email as from an unknown sender by the participants (Faught et al., 2004). Although participants were familiar with this research and had previously agreed to collaborate further, previous communication with them was accomplished by postal mail. Therefore, it was possible that the first contact email informing the participants about the second phase of the fieldwork seemed unknown to them, their email clients filtered the message as “junk”/“spam” mail, or that they simply deleted the message before reading it. These problems are analogous to the “wastebasket problem” for mail surveys, and the researcher needed to be aware of this issue and work to avoid filters and the delete button. To overcome this potential problem the researcher’s university email system was used, which identified the sender’s email address belonging to a UK university, and also used the university’s mail server, increasing the reliability of message handling. Moreover, neither graphic elements nor attachments were sent along with the messages and email messages intentionally contained only text-based information, therefore reducing the risk of some email clients blocking the message for being potentially dangerous.
7.4.1.1. An online survey
Prior to the development of the web form, and to sending contact messages to the participants, a survey implementation strategy was devised.
First, a tracking document was created using spreadsheet software and included information about the participants, the messages sent to them, the messages received from them, and the overall progress of the survey.
Second, contact messages to be sent were prepared and produced using group mail software.8 These messages included an invitation letter to participate in the online study, a thank you message for completing the survey (to be sent individually or in small groups after receiving the responses), and a template for an apology message in the event of technical problems (to be modified and addressed individually in each case).
Third, participants were split into two groups for sending the contact messages: the pilot group (21), and the rest of the participants (130).
After these preliminary tasks, the web page containing the questionnaire was designed. Separate sets of questions were produced for “adopter” and “non-adopter” groups. Once the contents were ready, the web page containing the questionnaire was designed in HTML9 following guidelines for good web design and principles for constructing and implementing web surveys. In the literature on research methods, it is highlighted that “Internet surveys need to be designed with the less knowledgeable, low-end computer user in mind” (Dillman, 2000, p. 377), and that it is important to design with computer and questionnaire logic in mind: “Meshing the demands of questionnaire logic and computer logic creates a need for instructions and assistance, which can easily be overlooked by the designer who takes for granted the respondent’s facility with computer and web software. […] The building of such instructions takes on the same level of importance as writing the survey questions” (idem).
Some of the design principles for web surveys discussed by Dillman (idem) and applied to this web survey were addressed as follows:
• “Introduce the Web questionnaire with a welcome screen that is motivational, emphasizes the ease of responding, and instructs respondents about how to proceed to the next page” (p. 377). This was achieved by including welcoming, motivation, and instructions statements in the contact email and also contained a link pointing to the web address where the web survey was located.
• “Provide a PIN number for limiting access only to people in the sample” (p. 378). Since the invitation to participate was sent privately to the participants, password protection access was considered unnecessary; moreover, for ease of use reasons, it was considered that a login process could complicate the access to the survey or deter some respondents from following this process.
• “Present each question in a conventional format similar to that normally used on paper self-administered questionnaires” (p. 379). Questions and scales were reproduced in a similar way to a paper questionnaire, although taking advantage of colouring, layout, and shading features offered by HTML format.
• “Restrain use of color so that figure/ground consistency and readability are maintained, navigational flow is unimpeded, and measurement properties of questions are maintained” (p. 382). As mentioned above, HTML format features were used, but only using colouring and bold font face in a sensible way, so that it enhanced the readability of the questions. Moreover, all the questions including a list of items across scales were designed using resizable tables to ensure the integrity of the proportions and consistency were maintained.
• “Avoid differences in the visual appearance of questions that result from different screen configurations, operating systems, browsers, partial screen displays, and wrap-around text” (p. 385). All text used relative font sizes so text could be enlarged or reduced using the text size options available in visual browsers, and a flexible page format was used so pages could be automatically resized for different window sizes and screen resolutions avoiding annoying wrap-around effects regardless of the participants’ computer or software used to display the web survey.
• “Provide skip directions in a way that encourages marking of answers and being able to click to the next applicable question” (p. 394). This principle was applied several times giving explicit instructions to click on a link that forwarded the respondent to the following question (i.e. “please click here to go to next section”).
The final version of the survey web page is reproduced in Appendix 2, and was made available online for the duration of the study through the university web servers.
7.4.2. Instruments and structure of the online questionnaire
As in the design of the questionnaire in the first phase of the study, suggestions made in research methods’ literature were considered to define the structure and sequence of the sections in the online questionnaire (Dillman, 2000). Accordingly, questions that were similar in content or question type were grouped together. The order of the questions took advantage of the cognitive ties that respondents were likely to make among the groups of questions. Questions that were more likely to be difficult were placed after questions that were likely to be easier to answer.
The web questionnaire was structured in four parts (A-D):
• Part A: Terminology management tools
• Part B: Translation memory
• Part C: Your ‘translation toolkit’
• Part D: Your profile
Standard instruments were used for the survey questions where possible, drawing on existing instruments used in previous research on ICT adoption and adapting them for this study. The main instruments used are presented in detail below, and a complete copy of the questionnaires developed for adopters and non-adopters of CAT tools can be found in Appendices 2 and 3.
7.4.2.1. CAT tools: terminology management tools and translation memory
Questions in Parts A and B of the study were formulated using Moore and Benbasat’s instrument, which was designed to “measure the various perceptions that an individual may have of adopting an information technology (IT) innovation” (Moore and Benbasat, 1991, p. 192). Their instrument was designed to “be generally applicable to a wide variety of innovations, especially other types of information technologies” (p. 194). They developed this instrument using the theoretical framework of innovation adoption developed by Rogers (1995). In this instrument, eight constructs were used to measure the perceptions of adopting an information technology innovation. According to Moore and Benbasat, the reason for using the perceived characteristics of innovations, rather than perceptions of the innovation itself, was that “the findings of many studies which have examined the primary characteristics of innovations have been inconsistent” (p. 194). They argue that “primary attributes are intrinsic to an innovation independent of their perception by potential adopters,” while “the behaviour of individuals […] is predicated by how they perceive these primary attributes” (p. 194). In addition, they further claim that “studying the interaction among the perceived attributes of innovations helps the establishment of a general theory” (p. 194).
The constructs used in the instrument were relative advantage, compatibility, voluntariness, image, ease of use, result demonstrability, visibility, and trialability. These were defined by Moore and Benbasat as follows:
• relative advantage: “the degree to which using an innovation is perceived as being better than its precursor” (p. 196);
• compatibility: “the degree to which [using] an innovation is perceived as being consistent with the existing values, needs, and past experiences of potential adopters” (p. 195);
• voluntariness: “the degree to which use of the innovation is perceived as being voluntary, or of free will” (p. 195);
• iImage: “the degree to which use of an innovation is perceived to enhance one’s image or status in one’s social system” (p. 195);
• ease of use: “the degree to which an individual believes that using a particular system would be free of physical and mental effort” (p. 197, cited from Davis, 1986, p. 82);
• result demonstrability: the degree to which “the results of using [an] innovation” are communicated (p. 203);
• visibility: the degree to which “the results of using [an] innovation” can be observed (p. 203);
• trialability: “the degree to which an innovation may be experienced with before adoption” (p. 195).
The in-depth study of the second phase of the research required an instrument that measured the adoption of CAT tools (i.e. an IT innovation) within freelance translation businesses (i.e. a very small organisation). Furthermore, Moore and Benbasat’s instrument was measuring the perceptions of an individual, which perfectly suited the case of the translation micro businesses under study, where the freelance translators were not only the users of the technology, but also the ones making the decision of adopting CAT tools.
Questions 1 to 3 of parts A and B were based on Moore and Benbasat’s instrument. All the items of the constructs in the complete instrument that were applicable to an individual were used in these questions. The wording was slightly modified to reflect the purpose of this research and the specific context of freelance translators. In addition, the same items were used for the version of the questionnaire addressed to non-adopters of CAT tools, accordingly rewording them by using conditional verb tenses that enabled obtaining information about their opinion on how using the tools would influence their work (e.g. instead of asking them if translation memory enables them to accomplish tasks more quickly, the statement read if translation memory would enable them to accomplish tasks more quickly). All perceptual items in the instrument were measured by five-point Likert scales representing a range from “Strongly Disagree” to “Strongly Agree.” The items for each question and the constructs they relate to are presented in Tables 7.1 to 7.4.
Table 7.1
Items for Question 1: using terminology management tools/translation memory
| Item | Construct | |
| (In Part A) Terminology management tools… |
1. Enable me to accomplish tasks more quickly.
2. Improve the quality of work I do.
3. Make it easier for me to do my job.
4. Improve my job performance.
5. Are overall advantageous in my job.
6. Enhance my effectiveness in my work.
7. Give me greater control over my work.
8. Increase my productivity.
| RELATIVE ADVANTAGE |
| (In Part B) Translation memory… |
9. Are compatible with the type of translation assignments I undertake.
10. Fit well with the way I like to work.
| COMPATIBILITY |
|
11. Are cumbersome to use.
12. Require a lot of mental effort.
13. Are often frustrating.
14. Do what I want to do easily.
15. Are easy for me to use.
16. Were easy for me to learn.
| EASE OF USE |
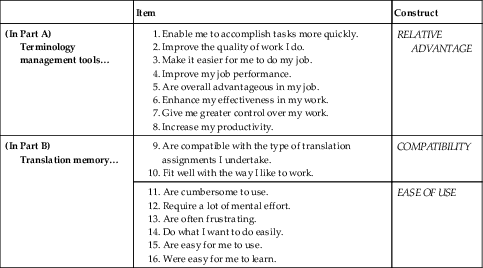
Table 7.2
Items for Question 2: terminology management tools/translation memory and the translation sector
| Item | Construct | |
| (In Part A) Terminology management tools… |
1. My clients expect me to use them.
2. My use of them is voluntary.
| VOLUNTARINESS |
| (In Part B) Translation memory… |
3. Using them improves my image within the translation sector.
4. Clients prefer to work with translators who use them.
5. Translators who use them have a high profile in the translation sector.
6. Having them is a status symbol among translators.
| IMAGE |
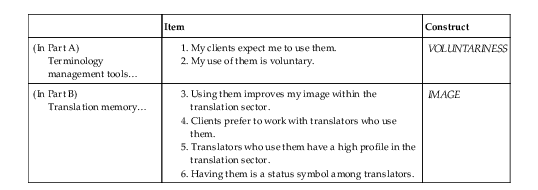
Table 7.3
Items for Question 3: learning about terminology management tools/translation memory
| Item | Construct | |
|
1. I have seen how other translators use them.
2. Many freelance translators use them.
| VISIBILITY | |
| (In Part A) Terminology management tools… |
3. Before deciding whether to use them, I was able to try them out fully.
4. I was permitted to use them on a trial basis long enough to see what they could do.
5. I had ample opportunity to try them out before buying.
| TRIALABILITY |
| (In Part B) Translation memory… |
6. I would have no difficulty telling others about what they can do.
7. I believe I could communicate to others the advantages and disadvantages of using them.
8. The benefits of using them are apparent to me.
| RESULT DEMONSTRABILITY |

Table 7.4
Items for impacts of terminology management tools/translation memory
| Items | |
| Impacts of Terminology management tools on… // Translation memory on… | Translators’ turnover Size of translators’ customer base Quality of translators’ translations Translators’ productivity Volume of work translators undertake Number of clients translators have Volume of work offered to translators by clients Prices translators charge for work they undertake |
In Question 4 of Parts A (terminology management tools) and B (translation memory) the participants were asked about the extent to which the use of CAT tools affected a number of elements of the translators’ business (for adopters); and the impacts of the potential use of these tools, in the case of CAT tool non-adopters. For this purpose, a 5-point scale ranging from “Large Decrease” to “Large Increase” was used for the items in Table 7.4.
7.4.2.2. Translation business characteristics
In Question 2 of Part D of the online survey, participants were asked to provide some details about their professional background as translators, and the type of work they undertake. For this purpose, questions relating to their translation assignments, the environment of their freelance translation business, and about ways of learning to use new software tools were formulated. In addition, a 5-point performance scale (ranging from very weak to very strong) was adapted to the context of freelance translators from an original performance scale developed by Khandwalla (1997) to measure the index of subjective performance based on the manager’s assessment of the company’s ability relative to its competitors. While the instrument was originally developed and tested in large organisations, it has also been adapted and validated in the SMEs context (Miller and Droge, 1986; Raymond et al., 1995; Hussin, 1998; Ismail, 2004). This resulted in five items measuring translator’s performance, namely through a 5-point scale ranging from “Very weak” to “Very strong”: (a) long term profitability, (b) amount of translation work undertaken, (c) financial resources (liquidity and investment capacity), (d) client base, and (e) professional image and client loyalty.
7.4.3. Online survey trial and piloting of the questionnaire
After uploading the web pages containing the survey to the researcher’s web space on the university server, a number of access tests were carried out from different locations and using different computer specifications to ensure compatibility with different machines and Internet connections.
Once electronic access to the survey was tested, the questionnaire was piloted to gain some insights into the likely response rate, and the expected types of response, as well as to gain assurance that the wording of the questions was clear. As suggested by Oppenheim (1992), the respondents in pilot studies should be as similar as possible to those in the main survey, so the questionnaire was then sent to 21 random translators for the pilot exercise. Twelve responses were obtained and showed that the questions were clearly understood, that they could be answered without problems by the translators, and the overall impression and the feedback from the piloting respondents was very satisfactory.
7.5. The data analysis scheme
Given the exploratory purpose of the first survey, a quantitative data analysis approach was deemed suitable to draw conclusions that could be statistically generalised to the population under study.10 On the other hand, the follow-up and in-depth nature of the subsequent survey was aimed at gaining more detailed insights into ICT adoption and consequently, a more qualitative approach to analyse the data was deemed suitable. The following sections briefly describe these two proposals of analysing data, using as an example the analysis undertaken in both phases of the study.
7.5.1. A quantitative data analysis approach
Since the purpose of the study used as an example was initially exploratory and the characteristics of the sample under study had a reasonable size, a quantitative approach was taken to analyse data. To do so, descriptive statistics were examined to find out whether the sample was representative or not, and to understand better the study sample. In exploring ICT tool adoption, descriptive statistics, chi-square tests and logistic regression analyses were used to identify levels of ICT tool uptake, and test the relationships between the adoption of CAT tools and the adoption of, and experience with, other ICT that were supporting translators in the activities in their workflow. In order to investigate the characteristics of the freelance translators who had adopted CAT tools and of their freelance translation businesses, chi-square tests and logistic regression analyses were also used, leading to the definition of a profile of CAT tool adopter. Then, factor analysis statistical technique was conducted to explore and examine the perceptions of ICT in general, and CAT tools in particular, among the translators in the survey sample. The perceptions of CAT tool adopters and non-adopters were then compared and their differences assessed through ANOVA tests. In addition, perceptions of the translators with different levels of experience with CAT tools were also compared through ANOVA tests.
A schematic view of this quantitative data analysis plan is depicted in Figure 7.2.
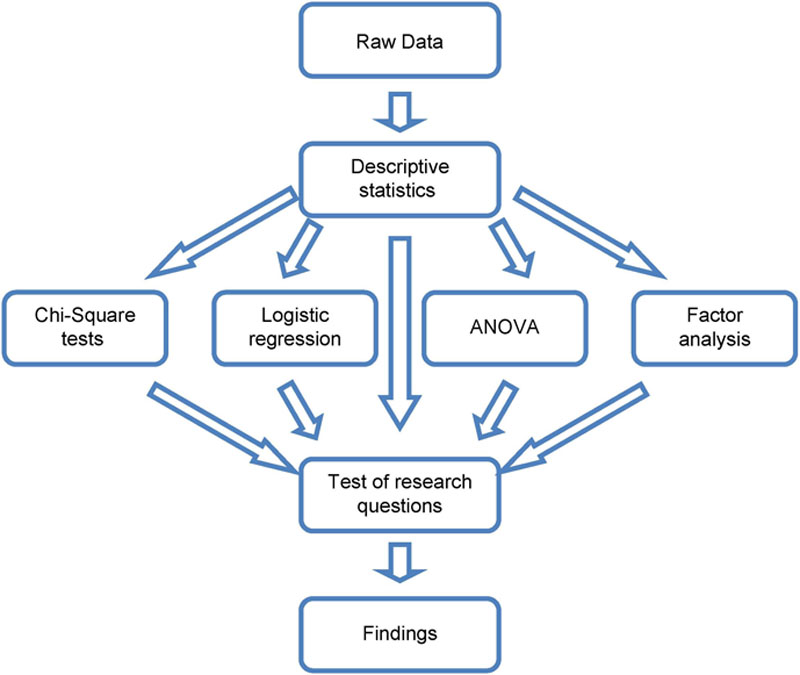
Figure 7.2 Data analysis for an exploratory study
7.5.1.1. Addressing non-response bias and generalisation of results
According to Dillman (2000), there are four possible sources of error in sample survey research. He calls them the “cornerstones for conducting a quality survey” (p. 9). These four sources are sampling error, coverage error, measurement error and non-response error:
• “Sampling error” is the result of surveying only some, and not all, elements of the survey population. This type of error always exists at some level when a random sample is drawn. It can be reduced through larger samples but cannot be eliminated completely unless one conducts a census (Lindner et al., 2001).
• “Coverage error” is the result of not allowing all members of the survey population to have an equal or known nonzero chance of being sampled for population in the survey.
• “Measurement error” is the result of poor question wording or questions being presented in such a way that inaccurate or uninterpretable answers are obtained. Researchers can reduce this type of error by using items that are valid, reliable, and unambiguous to the research subjects (Lindner et al., 2001).
• “Non-response error” is the result of people who respond to a survey being different from sampled individuals who did not respond.
Lambert and Harrington (1990) suggested that potential non-response bias needed to be addressed when response rates fall below 40%, therefore it was important to estimate the effects of non-response bias as it might have affected the generalisability of the survey results.
A variety of ways have been suggested to deal with the potential problem of non-response bias. Amstrong and Overton (1977) and Lindner et al. (2001) discuss extrapolation methods for estimating the response of non-respondents. The extrapolation method is based on the concept that subjects who respond late (either by answering later or by requiring more prodding before answering) have similar characteristics to non-respondents. In this method, known characteristics of groups that respond readily and less readily are compared and extrapolated. If the groups do not differ in their characteristics, it is assumed that there are no systematic differences in their responses, suggesting that the non-response bias is not a significant factor.
In the first survey of this study, the comparison of early to late respondents or “extrapolation method” was adopted to analyse non-response bias. Lindner et al. (2001, p. 52) defined late respondents as those who respond in the last “wave” of respondents in successive follow-ups to a questionnaire. To ensure that the number of late respondents is large enough to be meaningful, both practically and statistically, the respondents were divided into two groups comprising the first 30 and the last 30 responses received. The intermediate respondents were excluded to clearly demarcate early and late respondents. The groups were then compared using some of the main variables measuring the respondents’ characteristics and usage of ICT using the Mann-Whitney test (presented in Appendix 4), which showed that none of the variables tested produced significant differences (at 5% significance level) between early and late respondents. This suggested that, although bias in the response may exist in the sample of questions tested, they were not a significant factor which could affect the conclusions about the variables being studied.
7.5.1.2. Exploring relationships between variables: chi-square, logistic regression and discriminant analysis
The basis of the analysis used to explore the relationship between the adoption of ICT generally and the adoption of CAT tools in particular was an expectation-based adoption model. This model searched for those translators most likely to adopt CAT tools depending on their adoption and degree of experience with other ICT. Logistic regression and discriminant analyses are two statistical methods often used for this kind of classification problem. Logistic regression builds a model to predict which category translators belong to based upon a set of predictors. Discriminant analysis takes the same approach but makes stronger assumptions about the predictor variables, specifically that the values of the variables follow a multivariate normal distribution with identical covariance matrices (Ye, 2003, p. 49). Based upon this, discriminant analysis is seldom appropriate since these assumptions are rarely met in practice. Logistic regression carries fewer assumptions than does discriminant analysis, particularly the ability to include categorical predictors, such as being the user of a particular software application. Logistic regression is used when it is important to predict whether a translator will adopt CAT tools or not based upon certain characteristics of the translator. It is particularly suitable where a binary (zero or one) or dichotomous dependent variable exists (e.g. in this case, translators who did not adopt CAT tools and translators who did adopt them).
Logistic regression estimates the coefficients of a probabilistic model, involving a set of independent variables in order to best predict the value of the dependent variable. A positive coefficient for an independent variable increases the predicted probability, while a negative value decreases the predicted probability of the outcome being in either of the two dependent variable categories (Hair et al., 1998, p. 130). In predicting the probability effects of multiple independent variables on a single dichotomous dependent variable, the model used is:
where:
χi = an independent variable
β0 = an intercept term
βi = the parameter for the independent variable χi
e = the quantity 2.71828 + , the base of natural logarithms
y = the dichotomous dependent variable, here CAT adoption
p(y = 1) = the probability of a translator being classified as a CAT adopter.
The results obtained through the logistic regression model were then compared with those obtained through chi-square tests conducted individually between each of the nominal variables measuring ICT usage and the nominal dependent variable “CAT adopter: Yes/No.”
Chi-square (χ2) is a general test designed to evaluate whether the difference between observed frequencies and expected frequencies under a set of theoretical assumptions is statistically significant or simply random variation. This statistical test is most often applied to problems in which two nominal variables are cross-classified in a bivariate table (Frankfort-Nachmias and Nachmias, 1992, p. 464).
In order to investigate the relationships between the adoption of CAT tools and the level of knowledge of ICT, further chi-square tests were performed. The analysis included each of the nominal variables measuring the degree of familiarity and experience with the ICT available to translators and the nominal dependent variable “CAT adopter: Yes/No.” To obtain a richer picture of the relationship of CAT tool adoption with the level of knowledge of the ICT for the activities in the translator’s workflow, Internet-based ICT was also included in this part of the analysis. Since there were four possible values for the level of knowledge, these chi-square statistics should generally be compared with the chi-square distribution with three degrees of freedom.
In addition, chi-square was used to determine whether relationships existed between each of the characteristics of the sample and the group of CAT tool adopters, that is, between profile nominal variables (e.g. age range, gender, education) and the nominal dependent variable “CAT adopter: Yes/No.”
7.5.1.3. Using factor analysis to measure the perceptions of CAT Tools
In order to achieve a better understanding of the structure of the data and to identify eventual underlying dimensions, factor analysis is a multivariate statistical method that analyses the interrelationships (correlations) among a number of items, and then determines the extent to which each variable is explained by each dimension, known as a factor (Hair et al., 1998, p. 90).
The main objective of factor analysis is to reduce the wide-ranging number of variables into more manageable groups of factors (Lehman, 1989). The technique assumes that there are only a few basic dimensions that underlie attributes of a certain construct to be measured and it then correlates the attributes to identify these basic dimensions (Churchill, 1999). Factor loadings produced from factor analysis are used to indicate the correlation between each attribute and each score, the higher the factor loading the more significant those attributes are in interpreting the factor matrix (Hair et al., 1998, p. 106).
To use factor analysis, a number of requirements need to be met. According to Sproull (1988), variables under study have at least to be of interval scale for factor analysis to be appropriately applied. In this study, the variables used measured the translators’ perceptions of ICT through an ordinal scale. However, this does not preclude the use of factor analysis because an ordinal scale can be treated as an interval scale if one assumes that the distortion introduced by assigning numeric values to ordinal categories is not very substantial (Kim, 1975). Kim and Mueller (1978) indicated that many ordinal variables may be given numeric values without distorting the underlying properties, particularly, as in this case, when numeric values are shown on the questionnaire to guide respondents. Therefore, in this study, it was also assumed that the distortion effect, as a result of assigning numeric values to ordinal data, was not significant.
The Kaiser-Meyer-Olkin (KMO) Measure of Sampling Adequacy test and the Bartlett test of sphericity can be used to test whether it is appropriate to proceed with factor analysis. A small value on the KMO test indicates that the factor analysis may not be a good option. Kinnear and Gray (2000) suggest that the KMO value should be greater than 0.50 for the factor analysis to proceed. Kaiser (1974) suggests that a KMO measure in the 0.90s is considered to be “marvellous” sample adequacy for factor analysis purposes, in the 0.80s to be “meritorious,” in the 0.70s is considered to be “middling,” in the 0.60s is considered to be “mediocre,” in the 0.50s is considered to be “miserable,” and below 0.50s is considered to be “unacceptable.”
The Bartlett test of sphericity and its significance level consider whether the variables are independent (i.e. form an identity matrix) and hence determine whether factor analysis is an appropriate technique to use. If the Bartlett test value is not significant (that is, its associated probability is greater than 0.05), then it is likely that the correlation matrix is an identity matrix (where the diagonal elements are 1 and the off diagonal elements are 0) and is therefore unsuitable for further analysis (Kinnear and Gray, 2000). What is required is that Bartlett’s value for testing sphericity is large and the associated significance is small, that is, less than 0.05. When these criteria are present, the data are suitable for factor analysis.
7.5.1.4. Using ANOVA to compare CAT tool perceptions between adopters and non-adopters
A suitable way of comparing two or more variables for its statistical significance is using the analysis of variance (ANOVA). Its purpose is to determine whether a factor has a significant effect on the variable being used (CAT tool adoption, in our example) by comparing the means from several independent groups (Kvanli et al., 2002, p. 446). In the study, mean values of adopters and non-adopters of CAT tools were compared and their statistical significance assessed using ANOVA at the 0.05 significance level to examine how perceptions of CAT tools differed between these two groups.
7.5.2. A qualitative data analysis approach
A qualitative approach was deemed suitable to analyse the data of the second phase of the research to gain more insights into ICT adoption. More precisely, the qualitative data analysis framework suggested by Miles and Huberman (1994) for cross-case analysis was followed. One of the aims of this method is to draw conclusions from the multiple cases under study to increase generalisability and to reassure the researcher that the events and processes in one well-described setting are not wholly idiosyncratic. This allows developing more sophisticated descriptions and more powerful explanations from the data (idem, p. 172). In order to achieve this, the method involves three major activities: data reduction, data display, and conclusion drawing and verification (idem, p. 10), as represented in Figure 7.3.
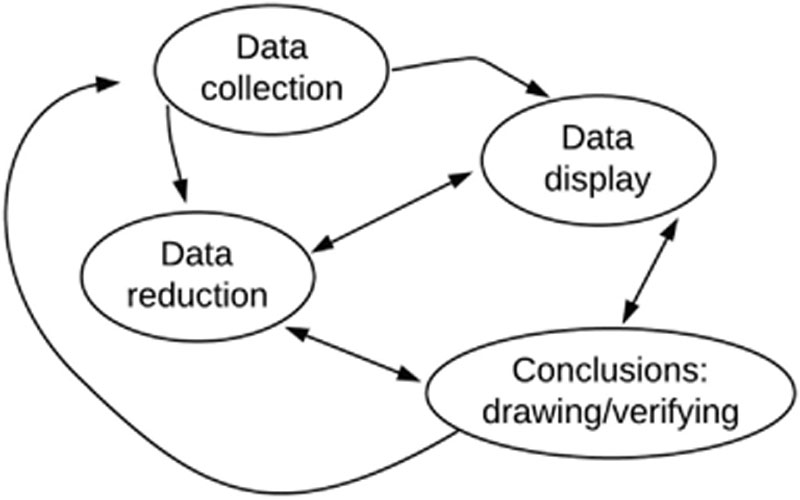
Figure 7.3 Components of Miles and Huberman data analysis method (1994, p. 12)
A schematic view of how Miles and Huberman’s method was applied to the study is presented in Figure 7.4 and an applied sample is included in the more detailed summary of the steps involved for analysing the particular issue of the relationship between continuous training and the use of specialist-purpose ICT in Appendix 5.
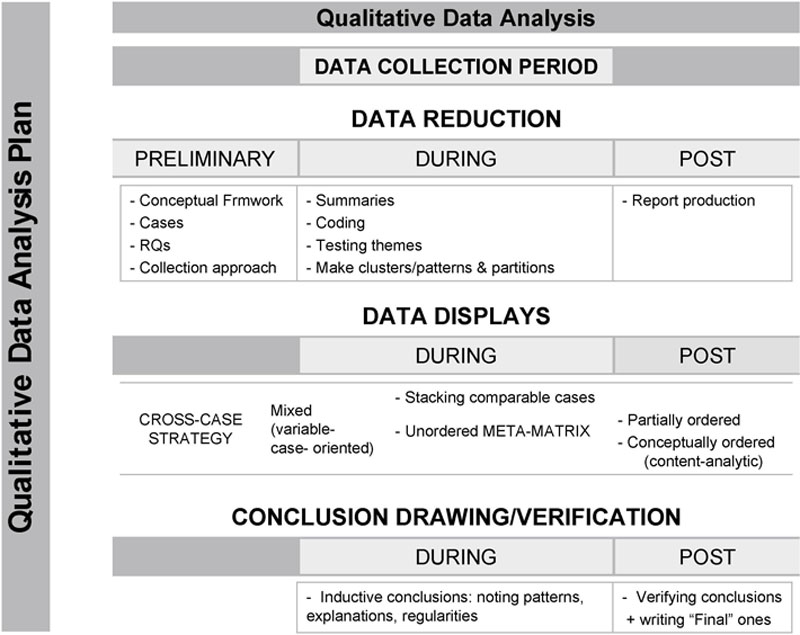
Figure 7.4 Qualitative data analysis plan
7.5.2.1. Data reduction
Data reduction helps to sharpen, sort, focus, discard, and organise the data in a way that allows for “final” conclusions to be drawn and verified. Data can be reduced and transformed through such means as selection, summary, paraphrasing, or through being subsumed in a larger pattern (idem, p. 10).
For each case (i.e. for each translator), the responses obtained for each construct (i.e. relative advantage, compatibility, voluntariness, image, ease of use, result demonstrability, visibility and trialability) were reduced by converting degrees of agreement to the numerical data and averaging them. As well as permitting the exploration of each respondent’s views, the numeric conversion of the scale data facilitated the calculation of the relative frequency with which each issue was present, as well as the intensity with which they were expressed (as the scale values represented ordinal data).
7.5.2.2. Data display
Data display involves taking the reduced data and displaying it in an organised, compressed way so that conclusions can be more easily drawn (idem, p. 11). It allows analysts to understand what is happening and extrapolate enough information to discern systematic patterns and interrelationships. Miles and Huberman identified a number of valid types of display, namely, matrices, graphs, charts and networks, to assemble organised data into an immediately accessible form which facilitates its understanding for conclusion drawing or further analysis.
In this study, cross-case matrix data displays were deemed extremely helpful to show a comprehensive picture of the data collected for each case, i.e. within-case analysis of each translator (idem, p. 174), and to identify patterns across the constructs investigated to determine the factors affecting the adoption of CAT tools, i.e. variable-oriented analysis across the cases (idem, p. 175). The decision to adopt CAT tools was likely to vary from one translator to another, based on factors such as the respondents’ perceptions of the adoption of CAT tools, the translators’ personal characteristics and the differences in the translation businesses.
Each translator who participated represented a case (i.e. the rows of the displays), and the constructs used11 represented the variables under study (i.e. the columns of the displays). A mixed strategy was followed to perform a cross-case analysis, combining case-oriented and variable-oriented approaches, which had been found to be a desirable way of analysing data from multiple cases (idem, p. 176). As noted by Ragin (1987), each approach has pluses and minuses: variable-oriented analysis is good for finding relationships among variables, but poor at handling the complexities of causation; and case-oriented analysis is good at finding specific patterns common to small sets of cases, but its findings often remain particularistic.
One strategy suggested by Miles and Huberman to follow a mixed approach for cross-case analysis is called by them “stacking comparable cases” (1994, p. 176). After series of cases have been entered for a set of variables, matrices are used to analyse each case in depth. When each case has been understood, it is “stacked” in a “meta-matrix,” which presents a further condensed and comparable display. The study being used as an example followed a “stacking comparable cases” strategy to perform cross-case analysis.
7.5.2.3. Conclusion drawing and verification
Conclusion drawing and verification is the activity in which the researcher begins to decide what things mean. He or she does this by noting regularities, patterns, explanations, possible configurations, casual flows and propositions (idem, p. 11).
After the data reduction and data display stages of the cross-case analysis, the last part of the analysis is focused on verifying and validating the quality of the preliminary conclusions drawn during the analysis of the displays. Some tactics can be employed to observe what was expressed by the data (e.g. noting patterns, counting), other tactics can be used to achieve a deeper understanding of what was being observed (e.g. making contrasts/comparisons), and other tactics help the researcher to see relationships more abstractly (e.g. factoring, noting relations between variables).
In this study, the identification of patterns across the cases for all the predictors was a tactic frequently used to see added evidence of recurring regularities, which is especially suitable when the number of cases and the data is large (idem, p. 246). In the matrix displays of the present study different shadings were used to identify the different degrees of importance of each of the predictors examined and to help to note patterns across the cases of each matrix.
Although a basic principle of qualitative research is to go beyond how much there is of something to find out what the essential qualities are, “a lot of counting goes in the background when judgements of qualities are being made” (idem, p. 253). For example, during the identification of patterns, the consistency or recurrence of facts is, in part, estimated by making counts, comparisons, and weights. As Miles and Huberman explain (idem, p. 253), numbers help to see rapidly what you have in a large batch of data; verifying a hunch or hypothesis; and keeping yourself analytically honest, protecting against bias. In the study, scales were converted to numerical scales which helped to use counts as a constant way of evaluating the real weight of patterns, and of ensuring that claims based on impressions were empirically grounded and not just personal intuitions.
Another useful tactic used in the cross-case analysis of this study was making contrasts and comparisons to test conclusions and assess the practical significance of the conclusions drawn. Comparisons and contrasts were especially useful to examine the two adoption settings (translators who had adopted, and translators who had not adopted CAT tools) against each of the predictor variables.
Verification of conclusions is the next step. After making and interpreting findings at different levels of inference, the representativeness and reliability of the findings need to be checked. Although the assessment of the “goodness” of qualitative research does not have a strong tradition as in quantitative research, Miles and Huberman (idem, p. 262) propose a number of tactics to help researchers at the operating level to test and confirm findings.
The representativeness of the data used to draw the conclusions is assessed by checking its quality (i.e. whether a finding is an instance of a more general phenomenon). Miles and Huberman identify three common pitfalls and their associated sources of error in making sure that the data collected is valid (idem, p. 264): “sampling nonrepresentative informants,” “generalising from nonrepresentative events or activities,” and “drawing inferences from nonrepresentative processes.”
In the study, the sampling process involved a number of translators who had previously participated in the earlier fieldwork of the research. No selection process was undertaken to only address to a particular elite of informants (i.e. translators who might be responsive informants because they are experts in the field and thus, their opinions could be biased); on the contrary, the sample for this phase of the study included a relatively large number of individuals (151 translators) who were adopters or non-adopters of CAT tools. With regard to the other two common pitfalls, the use of a validated instrument to measure translators’ perceptions (Moore and Benbasat, 1991), helped to have a number of constructs and processes from which conclusions were drawn, thus avoiding generalisations or drawing inferences from nonrepresentative events or processes.
..................Content has been hidden....................
You can't read the all page of ebook, please click here login for view all page.