
Appendix 5
Qualitative analysis form
QUALITATIVE ANALYSIS DOCUMENTATION FORM
1 Research Issue being explored: Training, Continuous Professional Development (CPD) and successful adoption of TTs Analyst: XG Version: 1/1
2 Aims of analysis: Find relationships between translators' training in TTs, their “Continuous Professional Development” and the successful adoption of TTs (obviously for those translators who have already adopted) + check if comparison/relation can be made/established between AD and NA (finding group of “likely NA for successful adoption”??).
3 Description of procedures:
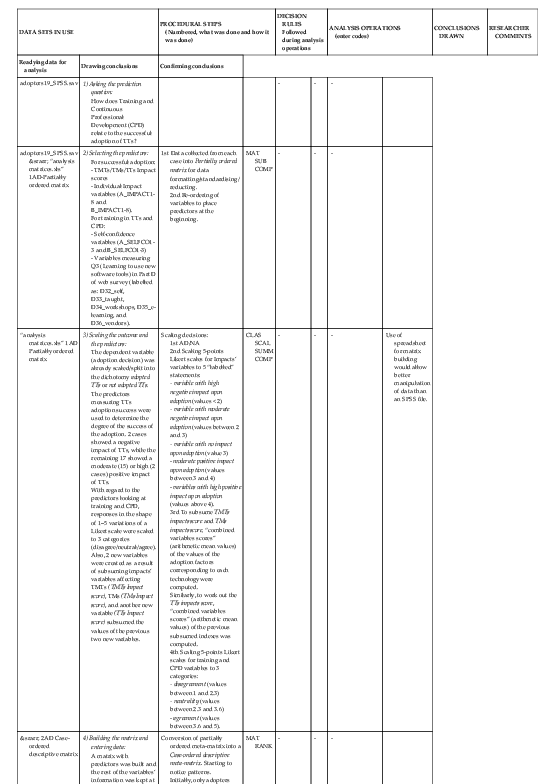
| DATA SETS IN USE | PROCEDURAL STEPS (Numbered, what was done and how it was done) |
DECISION RULES Followed during analysis operations |
ANALYSIS OPERATIONS (enter codes) |
CONCLUSIONS DRAWN | RESEARCHER COMMENTS | ||
| Readying data for analysis | Drawing conclusions | Confirming conclusions | |||||
| adopters19_SPSS.sav | 1) Asking the prediction question:
How does Training and Continuous Professional Development (CPD) relate to the successful adoption of TTs? |
- | - | - | |||
| adopters19_SPSS.sav →“analysis matrices.xls” 1AD-Partially ordered matrix |
2) Selecting the predictors: For successful adoption: - TMTs/TMs/TTs Impact scores - Individual Impact variables (A_IMPACT1-8 and B_IMPACT1-8). For training in TTs and CPD: - Self-confidence variables (A_SELFCO1-3 and B_SELFCO1-3) - Variables measuring Q3 (Learning to use new software tools) in Part D of web survey (labelled as: D32_self, D33_taught, D34_workshops, D35_e-learning, and D36_vendors). |
1st Data collected from each case into Partially ordered matrix for data formatting/standardising/ reducting. 2nd Re-ordering of variables to place predictors at the beginning. |
MAT SUB COMP |
- | - | - | |
| “analysis matrices.xls” 1AD Partially ordered matrix |
3) Scaling the outcome and the predictors:
The dependent variable (adoption decision) was already scaled/split into the dichotomy adopted TTs or not adopted TTs. The predictors measuring TTs adoption success were used to determine the degree of the success of the adoption. 2 cases showed a negative impact of TTs, while the remaining 17 showed a moderate (15) or high (2 cases) positive impact of TTs. With regard to the predictors looking at training and CPD, responses in the shape of 1–5 variations of a Likert scale were scaled to 3 categories (disagree/neutral/agree). Also, 2 new variables were created as a result of subsuming impacts’ variables affecting TMTs (TMTs Impact score), TMs (TMs Impact score), and another new variable (TTs Impact score) subsumed the values of the previous two new variables. |
Scaling decisions: 1st AD/NA 2nd Scaling 5-points Likert scales for Impacts’ variables to 5 “labelled” statements: - variable with high negative impact upon adoption (values < 2) - variable with moderate negative impact upon adoption (values between 2 and 3) - variable with no impact upon adoption (value 3) - moderate positive impact upon adoption (values between 3 and 4) - variables with high positive impact upon adoption (values above 4). 3rd To subsume TMTs impacts score and TMs impacts score, “combined variables scores” (arithmetic mean values) of the values of the adoption factors corresponding to each technology were computed. Similarly, to work out the TTs impacts score, “combined variables scores” (arithmetic mean values) of the previous subsumed indexes was computed. 4th Scaling 5-points Likert scales for training and CPD variables to 3 categories: - disagreement (values between 1 and 2.3) - neutrality (values between 2.3 and 3.6) - agreement (values between 3.6 and 5). |
CLAS SCAL SUMM COMP |
- | - | - | Use of spreadsheet for matrix building would allow better manipulation of data than an SPSS file. |
| → 2AD Case-ordered descriptive matrix |
4) Building the matrix and entering data:
A matrix with predictors was built and the rest of the variables’ information was kept at the end of each case’s row. Colour codes were used for each predictor category’s value (see row above). Once data was entered, a case by case review of the data sets was performed. See comments’ column for details. |
Conversion of partially ordered meta-matrix into a Case-ordered descriptive meta-matrix. Starting to notice patterns. Initially, only adopters would be included in the matrix building process. Later exploration of relationships/comparisons with NA’s perspectives may entail building another matrix for NA. Keep all data from each case, but key analysis variables were located at the beginning of each case, after its id information. Use of colour codes to ease patterns identification. Cases ad02 and ad13 were not using TMTs, thus they did not report any Impact of TMTs. As a consequence, they should be ignored for overall conclusions. |
MAT RANK |
- | - | - | |
| → 3AD5 Case-ordered predictor matrix | 5) Drawing first conclusions:
Search of useful information looking down the columns. |
Conversion of Case-ordered descriptive meta-matrix into Case-ordered predictor-outcome matrix to see whether antecedent variables (training and CPD predictors) account for criterion variable (adoption success). |
- | RANK PAT COUNT CONT |
- | - | |
| → 3AD5 Case-ordered predictor matrix | 6) Testing the prediction:
How does Training and Continuous Professional Development (CPD) relate to the successful adoption of TTs? |
1) Computing “combined variables scores” used to order cases and to help finding relationships. 2) Key RQ related to prediction question: ?? |
COMP | RANK PAT COUNT CONT REL |
TBD | Among adopters of TTs, there was an overall successful adoption of technologies, with diverse degrees of success. The majority of the translators showed overall moderate levels of success, and just two cases showed a highly successful adoption of TTs. The two translators who most successfully adopted TTs* did not feel they needed more training in using them more effectively, although one taught herself to use them and was also confident enough to teach herself to use new ones, and the other (which was the most successful case of TTs adoption) represented a completely opposite case: not self-taught, nor confident to teach herself to use new tools. Translators who had a moderate success in their adoption of TTs, had broadly taught themselves to use them; however, their level of confidence to learn to use new ones was lower than in the previous group, which could be related to the fact that they felt they needed training to use them more effectively. Preferences among successful adopters of TTs with regard to learning to use new TTs ranked workshops specially designed for translators and taught courses as the preferred learning ways. Translators who had not adopted TTs mainly used electronic mailing lists/discussion groups for the purpose of collaborating with their colleagues, or discuss terminology problems with them. On the other hand, for those translators who had adopted TTs, such perceived advantages came only after using electronic mailing lists/discussion groups for keeping up to date in the sector or being aware of the latest developments. Translators with a moderate success in their adoption of TTs seemed to be using online collaboration resources for translators (such as translation marketplaces or translation mailing lists) more extensively than those who had a rather higher success in the adoption of TTs, and seemed to be more eager to keep abreast of new technological developments in TTs and the translation sector. The last two statements could imply that the translators make more use of electronic resources to catch up with new developments as they adopt TTs, and once they reach a considerable level of success in their adoption of TTs, their interest seems to decrease again. |
Conclusions used for abstract of [09_IS] |


CODE LIST FOR ANALYSIS OPERATIONS (Adapted from Miles and Huberman 1994, p. 285)
| Readying data for analysis | Drawing conclusions | Confirming conclusions | |||
| MAT | filling in matrices | PLAUS | seeing “plausibility” only | REPR | checking for representativeness |
| CLAS | classifying, categorising | PAT | noting patterns/themes | RES-EFF | checking for researcher effects |
| RANK | ranking/weighting data | CLUS | clustering | TRI TRI-DATA TRI-METH TRI-CONC TRI-RES | triangulation from different data sources from different methods conceptually (different theories) from different researchers |
| SUMM | summarising phrases, generating key words | MET | making metaphors | WT | weighting the evidence |
| SUB | subsuming data under higher level variable | COUNT | counting/frequencies | OUT | use of outliers, exceptions |
| SCAL | scaling, summing indices | CEN | establishing central tendencies | EXTR-SIT | extreme situation verification |
| COMP | computing | CONT | making contrasts/comparisons | EXTR-BIAS | extreme bias verification |
| SPLT | splitting one variable into two | FAC | establishing factors | SURP | following up surprises |
| PAR | partitioning | REL | establishing relationships between variables/sets of variables | EMP | empirical evidence from elsewhere |
| AGG | aggregating | INTV | establishing intervening/linking conditions | NONEG | absence of negative evidence |
| LOG | logical chain of evidence | IF-THEN | testing if-then relationships | ||
| COH | making conceptual/theoretical coherence | FALSE-REL | checking false relation due to third variable | ||
| REPL | replication | ||||
| RIV | test of rival explanation | ||||
| FEEDB | corroboration from informant feedback | ||||

TTs, Translation Technologies; TMT(s), Terminology Management Tool(s); TM(s), Translation Memory(-ies)
..................Content has been hidden....................
You can't read the all page of ebook, please click here login for view all page.