
In this section, we will work with Apache JMeter, a free, open source load-testing tool for analyzing and measuring the performance of web applications. JMeter not only simulates the load, but there are numerous response verifications that can be performed. The tool also enables server monitoring and the graphical analysis of results. It can also execute use cases where certain steps need to take place.
JMeter offers the following varied features:
- Loads varied test systems, such as the Web (HTTP/HTTPS), SOAP, FTP, JMS, e-mail (SMTP/POP3/IMAP), native commands, TCP, and so on
- Based on GUI
- Completely based on Java (thus portable across various operating systems)
- Multithreading framework (allows us to simulate concurrent users)
- Used in a distributed manner (simulating loads from different machines simultaneously)
- Large catalog of plugins offering various capabilities
- Offline analysis and replaying of tests
The tool is plugin-based and has a large catalog of existing plugins. It can be extended to perform additional tasks. In short, the tool is a Swiss Army knife for developers, where they can perform different kinds of testing using it.
JMeter is easy to install. It can be downloaded from http://jmeter.apache.org/. The site provides an archive in the .tgz and .zip formats. You can download either of them and extract them to a location. At the time of writing the book, version 2.12 is the latest version available to download.
The extracted archive will have the following structure:
bin: This contains the JMeter executable, examples, and templates.docs: This contains Javadocs for the JMeter code baseextras: This contains miscellaneous items that are add-ons to JMeter, such as Antlib: This contains all the required librarieslicenses: This contains licenses bundled for libraries used in JMeterprintable_docs: This contains the user guide and other help documentsREADME,LICENSE, andNOTICEfiles
Before we can start running JMeter, we need to make sure that Java is available on the box.
JMeter requires a Java runtime to be available. The runtime version has to be 6 or above. Check whether Java is available using the following code:
$ java --version
If Java is not available, install the OpenJDK runtime available using apt-get:
$ sudo apt-get update
$ sudo apt-get install default-jdk
This will install OpenJDK on the box. However, if you want to install Oracle JDK, you have to use the following commands:
$ sudo apt-get install python-software-properties
$ sudo add-apt-repository ppa:webupd8team/java
$ sudo apt-get update
This will install a third-party apt-get repository, from where the package will be installed as Oracle does not provide a repository for this. Now, you can install JDK using the following command:
$ sudo apt-get install oracle-java6-installer
Once a version of Java is installed on the box, you need to set the JAVA_HOME environment variable. This can be done by finding the path of the Java installation and then adding the variable to /etc/environment.
Determine the Java location using update-alternatives as follows:
$ sudo update-alternatives --config java
This lists all the Java installations available on your box, as shown in the following output:
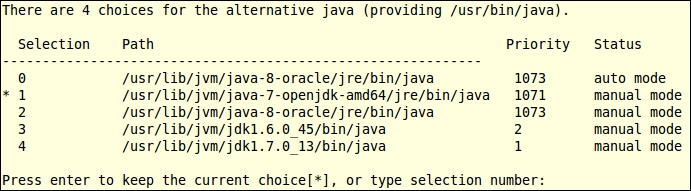
Copy the path from your preferred installation, and then edit /etc/environment to add JAVA_HOME variable:
JAVA_HOME="YOUR_PATH"
Now, reload the /etc/environment configuration:
$ source /etc/environment
Verify the change by executing the following command:
echo $JAVA_HOME
The bin folder in the JMeter installation offers all the scripts to run it. The tool can be executed in any of the following modes:
GUI mode:
- To run the JMeter UI, execute
jmeter.sh, which is available in thebinfolder under the JMeter installation path. You could do several things there:- Create test plans.
- Run the proxy server to record test plans.
- Execute test plans.
- See the live status of a running test.
- Analyze existing results and many more things.
- The UI is quite intuitive; play with it to get to know it better. Going further, we will work in the GUI mode to build test plans and analyze results.
Non-GUI mode:
- JMeter can also be run in a non-UI mode. The tool can run existing test plans and log outputs. This mode is quite helpful when the tool runs in the distributed mode. Run the
jmeter.shcommand with the-nand-toptions. Use the-land-joptions to specify the files to which the results and JMeter logs are saved. The following code shows this:$ ./jmeter.sh -n -t test-plan -j test.log - In addition to this, the
binfolder contains the following scripts to control the non-GUI JMeter instance:shutdown.sh: This is used to gracefully shut down the non-GUI instancestoptest.sh: This is used to abruptly shut down the non-GUI instance
Server mode:
- This mode is used when simulating load from multiple machines. All the machines run a server component by executing the
-soption or thejmeter-server.shscript in thebinfolder. All these servers are controlled via a master client running the JMeter GUI.
If your network has proxy server settings, then you may want to pass this additional information to the JMeter engine. In order to do so, use the following options:
JMeter tests are composed of several elements. These elements are responsible for making requests, verifying responses, doing analyses, generating graphs, simulating loads, and so on. Similar types of elements are grouped together to define JMeter components. In the following section, we will discuss the important components required to build a test.
This is the starting point of a test. The thread component defines the pool of users that will execute the load in the particular test. The steps that need to be performed are grouped under the threads element. The element provides options to simulate load in various ways, for example, all in one go, increasing with time, and so on. The component also allows you to schedule tests for a later time.
The sampler elements are responsible for making actual requests. JMeter supports loads of protocols, such as FTP, HTTP, JDBC, and so on. There are samplers for each of them. Each sampler provides options to configure the requests that it makes.
Configuration elements are used to set up values and variables that can be used by samplers. If the test contains multiple samplers, then instead of setting common values in each of them, add a relevant configuration element.
These are used to verify the validity of the response. Each sample has assertions that perform checks to validate the response received. Unless an assertion is added under the sampler, which would mean it only applies to the particular sampler; it is applicable to all the samplers that are part of the test.
Listeners gather all data from tests. There are various listeners that can analyze the test results and build graphs and tables out of them. All listeners allow us to save data in the CSV or XML format for later reference.
All the preceding elements are grouped together under the test plan element. The plan can set up the variables required in the test. The plans provide additional settings for tests, such as simulating users one by one instead of in parallel, adding JARs to the test's classpath, and so on.
Besides the preceding components, JMeter provides various kinds of components, such as preprocessors, postprocessors, timers, logic controllers, and so on. The chapter only covers the components required to build basic tests.
Note
For a complete description of the uses of components, refer to the JMeter documentation at http://jmeter.apache.org/usermanual/.
In order to define a test, we need to build requests and validate and analyze the response received. Instead of adding HTTP request samplers, we can run a proxy server, packed in JMeter, and record all samples.
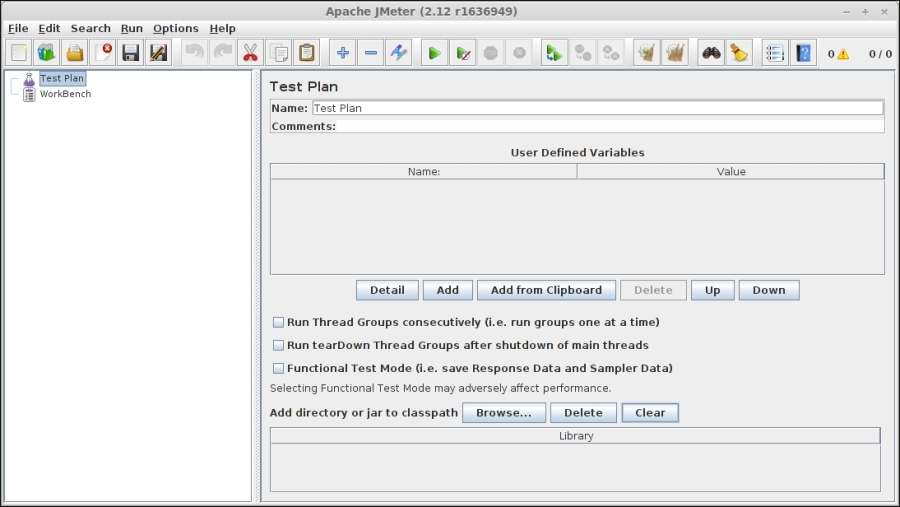
Let's start building a simple test plan by starting JMeter in GUI mode, as shown here:
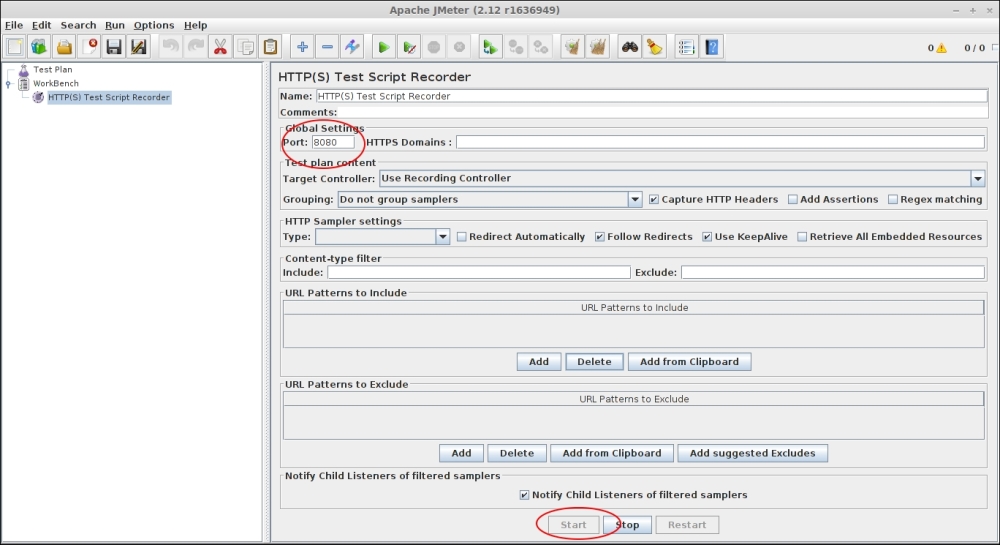
The next step is to start the proxy server and point the browser to it. The option is available under Workbench. Navigate to Workbench and right-click on Add | Non Test Elements | HTTP(S) Test Script Recorder.
Take a note of the port on which the proxy server will run; by default, it will run on 8080. Click on Start to run the server, as shown here:
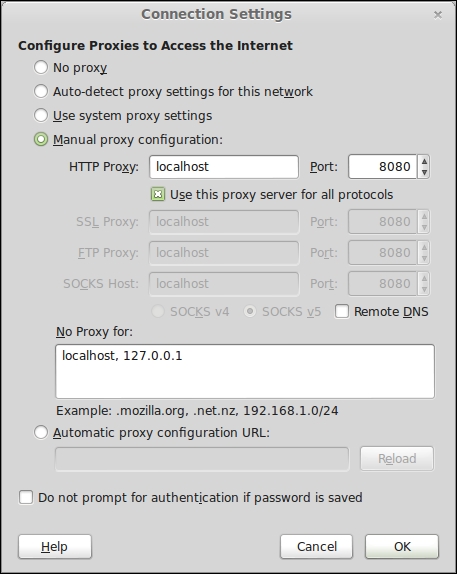
The proxy server is now running on 127.0.0.1:8080. Apply these settings in your browser under
Network | Settings. The following screenshot is the result of these steps:
Now, when you open a web page in the browser, the request will be recorded in JMeter. We will use these recorded requests to generate our test plan. Access the Hello world! page developed in the previous chapter using the IP address of your machine, for example, http://192.168.2.100/hello/. This will record requests in the JMeter proxy server, which we will use in our tests.
JMeter tests are grouped as users, so add Thread Group under Test Plan by navigating to Test Plan and right-clicking on Add | Threads | Thread Group.
The Thread Group element has a couple of useful fields. The fields for Number of Threads, Loop Count, and Ramp up Period can be used to simulate the required load.
Now, select and drag all the requests generated under HTTP Test Recorder to Thread Group. This adds the selected requests to the test.
The test needs to verify and analyze the responses received for the requests initiated. To see the complete list, navigate to Thread Group and right-click on Add | Assertions.
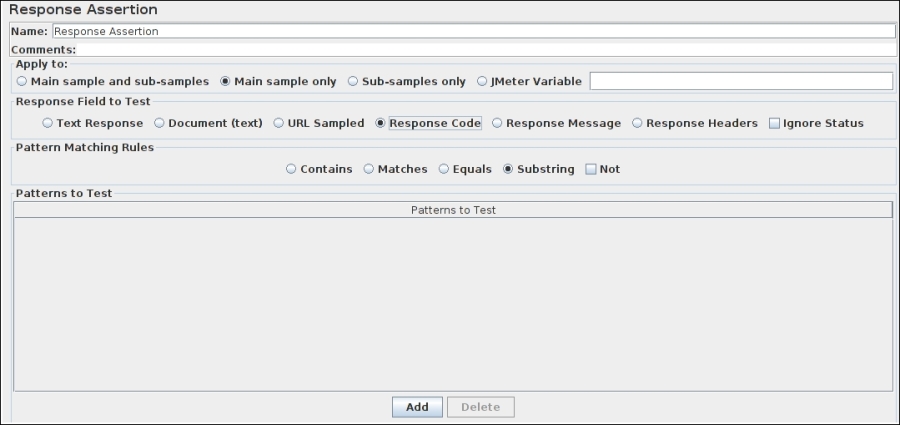
For our purposes, we will use the Response Assertion component. The panel enables us to compare various fields of the response. Using this, we can verify the response text, response code, response headers, and so on.
Add Response Assertion under all requests using the right-click options. In each of the assertions, select Response Code and add 200 under Patterns To Test.
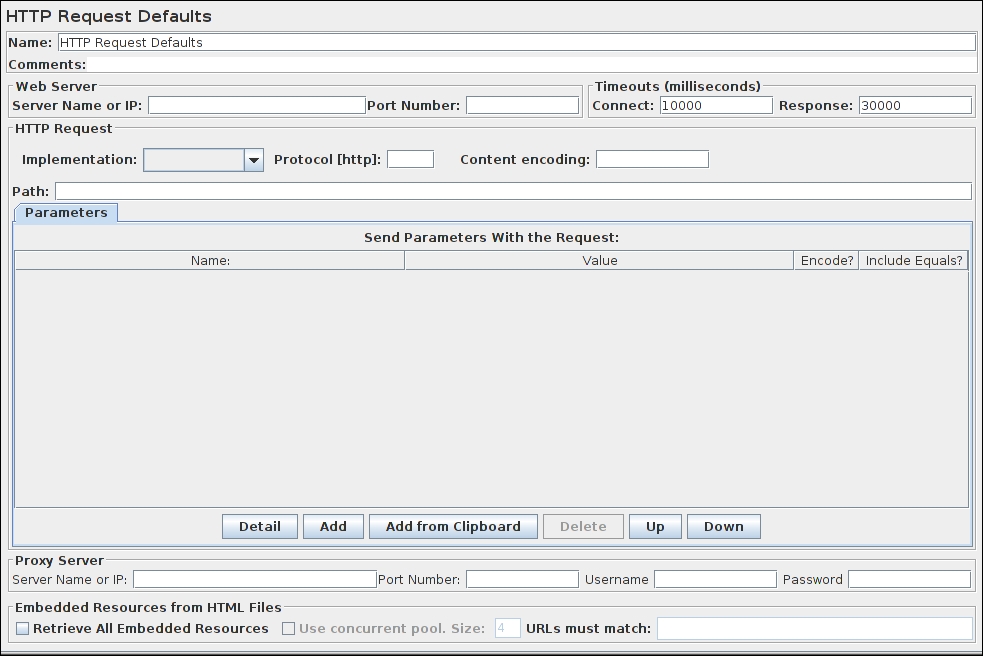
We need to control timeouts to determine the error rate and the throughput. For each request, JMeter allows us to set a connection timeout and a response timeout. The HTTP Request component contains fields for both of these options. Optionally, we could add the Http Requests Defaults component available upon navigating to Thread Group and right-click on Add | Config Element. The values defined in this component will remain the same for all requests. As in Siege, put a small value in the connection timeout as well as the response timeout:
Next, to analyze the result, we need to add Listener by right-clicking on Add options on Thread Group. For our purposes, we will use the Aggregate Report component. The component aggregates the response information and provides the request count, minimum, maximum, average, error rate, approximate throughput (request/second), and kilobytes per second for each request.
Along with the Aggregate Report component, add the View Results Tree component. The component will show all responses in the form of a tree. It also allows you to inspect response codes, the time taken, headers, and so on. The component can selectively show errors, success messages, or all requests. It is quite helpful to get error requests in the component as you can analyze the response to see what has caused the issues.
We are done with all the components that are required; now run the test by clicking on the Start button on the toolbar. The toolbar offers handy buttons, such as Toggle Log Viewer for error logs and Clear all to remove previous results. Also, once the test starts, the tool will enable the Stop button to stop the test. Post the test execution, Aggregate Report should display the numbers we want to know.
During or after test execution, Aggregate Report will display the results. The table shows all the metrics that are required to create our baseline. The aggregated response at the bottom is either the sum or the average of different components. We should be looking at the metrics of each request, which will give us more relevant information.
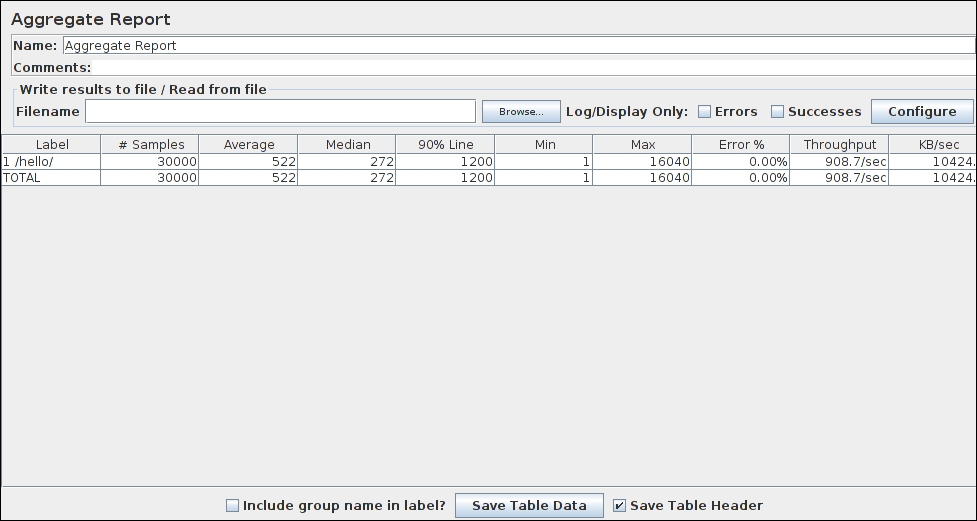
The preceding figure shows the metrics values as follows:
- Throughput: 908.7 requests/second.
- Error rate: JMeter makes this metric readily available.
- Response time: Since the tests are running on the local network, the latency is next to nothing. The average response time is shown as 522 milliseconds.
If there are any errors reported, navigate to the View Results Tree component. It will show the error requests in red. Click on any of them to see the response received. If the test contains assertions, then expand the request tree to see the assertions that have failed.