
2
Economics of building and operating offshore wind farms
Abstract
In a number of countries, offshore turbines are taking on an increasingly important role in the development of wind power, particularly in the north-western part of Europe. Expectations are that a total offshore wind capacity of 43 GW will be implemented in the European Union by 2020. This chapter focuses on the economics of building and operating offshore wind farms, addressing the key economic drivers, investments, operating costs and levelised cost of energy. The main emphasis is on the costs of offshore wind farms and how these costs have developed over time.
Keywords
Investments; Key economic drivers; Offshore wind; Operating costs2.1. Introduction
2.1.1. Expectations to offshore wind power
Expectations of the development of offshore wind power are high, especially in Europe. According to the National Renewable Energy Allocation Plans (NREAPs) prepared by European Union (EU) member states, a total offshore wind capacity of 43 GW is expected to be implemented in the EU by 2020 (Green and Vasilakos, 2011). However, in reality the development thus far has not been that fast. By the end of 2014 a total offshore capacity of 8759 MW was installed worldwide, the vast majority in Europe (8045 MW or 91%) (GWEC, 2015) – still a long way to go if the NREAP target for 2020 is to be reached. Faced with this fact the European Wind Energy Association (EWEA) has recently downgraded its 2020 expectations from being in line with the NREAP target to a significantly lower level, ranging between 19.5 and 27.8 GW by 2020. To reach these levels a growth rate of between 20% and 27% p.a. is required, much in line with the realised growth rates of recent years, 33% in 2012, 31% in 2013 and 23% in 2014.
2.1.2. Development of offshore wind power
In a number of countries, offshore turbines are taking on an increasingly important role in the development of wind power, particularly in the north-western part of Europe. Without a doubt, the main reasons are that on-land sitings are limited in number and the utilisation of these sites, to a certain extent, is exposed to opposition from the local population. This, seen in relation to a significantly higher level of energy production from offshore turbines compared to on-land sitings, has paved the way for strong interest in offshore development.
As for onshore turbines, the wind regime, where the offshore turbines are sited determining the production of power, is the single most important factor for the cost per generated unit of electricity. In general, the wind regime offshore is characterised by higher average wind speeds and more stability than onshore wind. At the Danish Horns Reef wind farm, a wind speed corresponding to a utilisation time of more than 4200 h per year was measured (adjusted to a normal wind year), thus giving a capacity factor close to 50%, which is comparable to many relatively small conventional power plants. For most offshore wind farms, a utilisation time of more than 3000 h per year is to be expected, significantly higher than that for on-land sited turbines and, therefore, to a certain extent compensating for the additional costs of offshore plants.
Offshore development is dominated by a handful of countries, most located in Western Europe. In Fig. 2.1, the cumulated offshore capacity and the growth in 2014 clearly indicate the countries driving the development: the UK installed 47% of the new capacity in 2014, followed by Germany (31%), China (13%) and Belgium (8%). The UK seems set to maintain its leading position in the years to come as quite a number of new offshore wind farm installations are either under construction or in the planning process.
Although onshore wind power is being developed fast in China, offshore development has not reached the same pace, despite that a strong potential for offshore wind does exist there. With 230 MW installed in 2014, total offshore wind capacity in China has reached 658 MW (GWEC, 2015). China has an offshore target of 5 GW by 2015, and although a number of new offshore projects are on the way it seems most unlikely that this target will be met.
2.2. Investment costs
2.2.1. Development in investment costs
Offshore wind farms are capital-intensive. Upfront investment costs make up approximately 75% of the total lifetime cost of an offshore wind farm, which is extremely high in comparison to other electricity generation technologies – typically investment costs constitute around 40% of the cost of energy from a conventional power plant. From the investment per MW point of view, offshore wind is still some 50% more expensive than onshore wind. The higher capital costs of offshore are due to the larger structures and complex logistics of installing the towers. The costs of offshore foundations, construction, installations, and grid connection are significantly higher than for onshore. Typically, offshore turbines are 20% more expensive, and towers and foundations cost more than 2.5 times the price for a project of similar size onshore.
As shown in Fig. 2.21 the specific investment costs of offshore wind farms (M€/MW) have in general been increasing, despite significantly larger wind farms and thus the expected economies of scale. The main reasons for this are to be found in increasing distances to shore and water depths. Also, in the late 2000s, supply bottlenecks and increasing component prices occurred. Overall, the specific investment cost of offshore wind power has not decreased at the same pace as previously seen for onshore turbines.


Worth noticing also is that some countries are in general found to have significantly lower investment costs than others, see Fig. 2.3. Belgium is found to be the country with the highest specific investment costs, followed by Germany and the Netherlands. Sweden2 is the country with the lowest specific investment costs in the past, followed by Denmark. Some divergence between countries can be explained by differences in the age of wind farms, in the size of turbines, in water depth and distance to shore.
2.2.2. Investment costs split into cost components
The investment cost of an offshore wind farm is typically split into a limited number of cost components, including the turbine itself, foundation, cabling etc. Table 2.1 shows a way to categorise these costs and explains what is included.
Turbines are the most costly element of an offshore wind project, accounting for between 40% and 60% of the total investment cost. Turbine blades and towers make approximately half the total turbine costs (Ports, 2014). Installation is typically the largest cost item after the turbines themselves, with roughly a quarter of the total investment cost. Installation costs are however often not visible in cost breakdowns, as they often are shown as an integrated part of turbine, foundation and cable costs, respectively. The third-largest cost component, foundations, accounts for approximately 20% of the investment costs.
Overall, approximately one third of the total investment cost is labour costs, another third is materials and the last third comprises services, insurance and other overheads (RAB, 2010). Key commodities in the material cost are fibreglass, steel, iron and copper, which make upto 90% of the material cost of a turbine (RAB, 2010).
Table 2.1
Investment costs split into a number of cost components
| Cost components | Examples for detailed cost items |
| Development and project management | Design, management, consenting, consultancy fees |
| Turbines | Tower, rotor blades, rotor hub, rotor bearings, main shaft, main frame, gear box, generator, yaw system, pitch system, power converter, transformer, brake system, nacelle housing, cables |
| Foundations | Foundations, transition piece |
| Electrical installations (offshore) (including balance of plant) | Collection system, integration system, offshore substation. Transmission system, reactive power compensation system, electrical devices, export cable (main cable to coast) |
| Grid connection (onshore) | Dedicated cables onshore, isolators, switchgear under control of onshore network operator |
| Installation (of turbines, foundations, cables and electrical equipment) | Transportation cost, vessel chartering costs, labour cost |
| Financial costs | Financing, bank fees, securities |
| Miscellaneous | Services, insurance and other overheads |
The split into cost components will of course vary considerably between wind farm projects. However, to illustrate more thoroughly the shares of these cost components in total costs, two examples are given: (1) an average of the two Danish offshore wind farms, Horns Reef I and Rødsand I and (2) the Swedish offshore wind farm, Lillgrunden.
Horns Reef I, completed in 2002, is located approximately 18 km off the west coast of Jutland (west of Esbjerg). It is equipped with 80 × 2 MW machines, a total capacity of 160 MW. Rødsand I, completed in 2003, is located south of the isle of Lolland – 11 km from the shore – and consists of 72 × 2.3 MW turbines, a total capacity of 165 MW. Both wind farms have their own transformer station located at the sites, which through transmission cables are connected to the high-voltage grid at the coast. The farms are operated from onshore control stations and no staff is required at the offshore sites.
Lillgrunden is located south of the Øresund-bridge connecting Copenhagen and Malmö, approximately 8 km off the Swedish coast. Lillgrunden is equipped with 48 × 2.3 MW turbines, in total 110 MW. The average investment costs related to the above-mentioned wind farms, split into main components, are shown in Table 2.2.
The total cost of each of the two Danish offshore farms is close to 260 million €, while the Swedish cost around 215 million €.
Table 2.2
Average investment costs per MW related to offshore wind farms at Horns Rev, Nysted and Lillgrunden (split into main components)
| Horns Reef I and Rødsand I | Lillgrunden | |||
| Investments 1000 €/MW | Share % | Investments 1000 €/MW | Share % | |
| Turbines ex work, including transport and erection | 872 | 49 | 1074 | 57 |
| Transformer station and main cable to coast | 289 | 16 | 244 | 13 |
| Internal grid between turbines | 91 | 5 | – | – |
| Foundations | 375 | 21 | 361 | 19 |
| Design, project management | 107 | 6 | 60 | 3 |
| Environmental analysis etc. | 54 | 3 | – | – |
| Other contractors | – | – | 80 | 4 |
| Miscellaneous | 11 | <1 | 54 | 3 |
| Total | 1798 | ∼100 | 1873 | ∼100 |
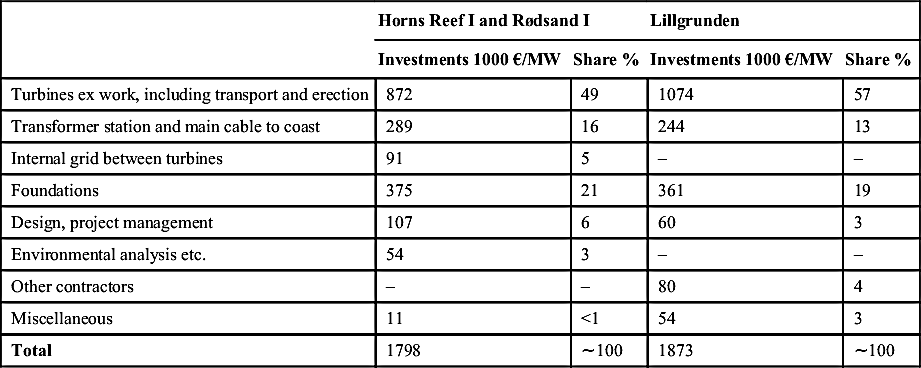
Compared to land-based turbines the main differences in the cost structure are related to two issues:
• Foundations are considerably more costly for offshore turbines. The costs depend on both the sea depth and the chosen principle of construction.3 For a conventional turbine sited on land, the share of the total cost for the foundation normally is approximately 5–9%. As an average of the three above-mentioned projects, this percentage is 20% (cf. Table 2.2), and thus considerably more expensive than for on-land sites.
• Transformer station and sea transmission cables. Connections between the turbines and the centrally located transformer station and from thereon to the coast cause additional costs compared with on-land sites. For Horns Reef I, Rødsand I and Lillgrunden wind farms, the average cost share for the transformer station and subsea transmission cables is between 13% and 21% (cf. Table 2.2). For Horns Reef I and Rødsand I a minor share of this, amounting to 5%, is related to the internal grid between turbines.
2.3. Operating costs
Next to investment cost, operation and maintenance (O&M) costs constitute a sizeable share of the total costs of an offshore wind turbine. Thus, O&M costs may easily make up 25–30% of the total levelised cost per kWh produced over the lifetime of the turbine. If the turbine is fairly new, the share may only be 20–25%, but this might increase to at least 30–35% by the end of a turbine's lifetime. As a result, O&M costs are attracting greater attention, as manufacturers attempt to lower these costs significantly by developing new turbine designs that require fewer regular service visits and less turbine downtime, which is especially important for offshore turbines. Condition monitoring is also being developed as a technology that can be added to existing and new designs.
Offshore O&M costs are related to a limited number of cost components, including:
• Insurance;
• Regular maintenance;
• Repair;
• Spare parts;
• Access to platform and turbines; and
• Administration.
For offshore wind farms, part of these O&M costs is rather difficult to estimate. Due to weather-related access restrictions and longer distances to offshore turbines, labour-related costs tend to be significantly higher and less predictable than for onshore plants. Whereas standard long-term contracts for insurance and regular maintenance can be obtained for onshore turbines, this is not necessarily the case for offshore turbines. Finally, costs for repair and related spare parts are always difficult to predict. Although all cost components tend to increase as the turbine gets older, costs for repair and spare parts are particularly influenced by turbine age, starting low and increasing over time.
In the past, lifetime average O&M cost have been estimated spanning a broad range from 15 to 49 €/MWh. Table 2.3 shows several different O&M estimations from the literature. Here, it has to be noted that existing data on O&M for offshore wind farms are clouded by a series of required and expensive retrofits on some of the early offshore wind farms, partly invisible costs covered in the CAPEX through warranty periods and politically driven pricing of early service agreements (RAB, 2010, p. 17).
Table 2.3
Estimates of O&M costs for offshore turbines (all prices converted to Euros, real 2012)
| O&M cost (€/MWh) | |
| Operating farms, EU, 2002–2009 (Morthorst et al., 2009) | 18 |
| Danish technology data catalogue, 2015 (DEA, 2014) | 19 |
| German projects, 2010 (KPMG, 2010) | 27 |
| Offshore farms in Europe (IRENA, 2012) | 25–49 |
Specific O&M costs depend heavily on the distance to shore, which affects the location of service staff and methods of transfer, both connected to significant health and safety considerations (RAB, 2010). For distances of more than 50 km from the port, sea-based maintenance concepts may become more efficient than land-based maintenance (Hohbohm et al., 2013).
Thus, O&M costs for offshore wind farms tend to be highly specific for the considered plant and average-cost estimates are very uncertain and should be used with caution.
2.4. Key economic drivers for offshore wind energy
As discussed above, the cost of offshore wind energy can be broadly separated into (1) capital expenditures and (2) O&M expenditures. Other costs, such as fuel costs and cost of CO2 emissions that may be substantial cost drivers of fossil-fuelled power plants, are not relevant for offshore wind. In this, the economics of offshore wind (and other fuel-free technologies) is fundamentally different from the economics of fossil-fuelled power plants.
To make different energy conversion technologies comparable, often the indicator of levelised cost of energy (LCOE) is used (see also Section 2.5). For this, all different cost elements of a technology throughout the lifetime of a project are aggregated into a simple per-unit measure (eg, €/MWh). These LCOE measurements do not however often comprise the full price of introducing offshore wind (or any other technology) into the power system. Integration of wind power into the overall energy system implies additional costs, dominated by two main aspects: balancing needs and grid infrastructure (Krohn et al., 2009). Finally, offshore wind also has a price-decreasing effect on the wholesale market.
Focusing on the aspects relevant for the project developer, the economics of offshore wind are affected by several different cost drivers. Intrinsic drivers include project size, project location (water depth and distance to shore), turbine design, lifetime of the components, planning and consent etc. These drivers can be mostly influenced by offshore wind developers through technology or managerial choices. External drivers include cost of finance, exchange rates, commodity prices and support schemes. These drivers are mostly influenced by external developments and actors, such as policy makers.
In a study of the major price increases between 2005 and 2010 in the UK, UKERC (2010) identify the major drivers as (in descending order of impact): (1) materials, commodities, labour costs; (2) currency movements; (3) increasing prices for turbines (in addition to cost of materials), due to supply chain constraints, market conditions, and engineering issues; (4) increasing water depth and distance to shore; (5) supply chain constraints (in vessels and ports); and (6) planning and consenting delays.

In the following, we present some major drivers for European offshore wind over the last 15 years.
2.4.1. Project size
The size of an individual project is of significant importance, because some cost components are (largely) independent from size (see further below). Thus, it is to be expected that the bigger the wind farms, the lower the specific investment costs in m€/MW, other things being equal. Economies of scale can thus decrease the overall costs of an offshore wind farm significantly.
Commercial offshore wind farms in Europe have increased significantly in size over time. Whereas the average project size was 88 MW (with projects between 10 and 209 MW) in the first decade of this century, the past 5 years saw a sharp increase of project sizes. This is illustrated in Fig. 2.4. The average size of offshore wind farms installed in Europe between 2010 and 2014 was 244 MW, with projects ranging between 48 and 630 MW, the latter being London Array 1, which was at the time of completion in 2013 the largest offshore wind farm in the world and the largest wind farm in Europe.
An attempt has been made to estimate the economics of scale by applying regression analyses. Using the specific investment cost (m€/MW) as the dependent variable and the capacity, distance from shore, water depth and a dummy4 as explaining variables, economies of scale are estimated to be around −0.08, implying that a 10% increase in capacity of the given wind farm would decrease cost by 0.8%. However, the capacity-coefficient is barely significant, so this estimate is quite uncertain.
2.4.2. Turbine capacity
The size of the individual turbine is a crucial driver for the economics of offshore wind. Past reductions in wind energy generation costs were derived mainly from scaling up turbine capacity (EEA, 2009).
In the commercial offshore wind farms in Europe installed to date, turbine sizes between 2.0 and 6.15 MW have been used. Fig. 2.5 shows the applied turbine sizes on a time horizon. The first offshore wind farms in Denmark and the UK all used either Siemens or Vestas turbines in the 2–3 MW class. Larger turbines were first installed in Belgium in the Thornton Bank projects and in Germany in the Alpha Ventus and Nordsee Ost projects from 2009 onwards, first with 5 MW and then 6.15 MW turbines (both Repower).
As the economic consequences of larger turbines go hand in hand with larger wind farm projects, we have not tried specifically to estimate the value of this parameter.
2.4.3. Project lifetime
At sea, wind conditions are less turbulent than on land. Hence, offshore wind turbines are often certified to last 25–30 years on offshore sites (Krohn et al., 2009). Also, in view of the high installation costs at sea, life extension is a possibility. To date, re-powering of existing offshore wind farms has not yet been relevant.
2.4.4. Distance to shore and water depth
Most commercial offshore wind farms to date in Europe are installed within 20 km of the shore at a water depth of no more than 20 m. The average distance to shore of the 45 large commercial wind farms in Europe is 18.8 km, and the average water depth 15.0 m. Of the currently operating wind farms, the project BARD Offshore 1 stands out with it being 90 km from shore at a water depth of 40 m. Fig. 2.6 shows the development of the two indicators for all European offshore wind farms.


Distance to shore and water depth affects both the investment costs and the O&M costs. Fig. 2.7 shows the relationship for investment costs.
Fig. 2.7 shows two aspects: distance to shore and water depth are connected. Usually, the farther from shore, the deeper the waters. It also shows, by the size of the circle, the specific investment cost per MW installed. The cost tends to be larger the higher the distance to shore and water depth.
Increasing distance to shore affects mostly installation costs and grid connection costs: Installation costs, because of greater travelling time from the holding port to the site and because of tougher weather conditions making the installation more difficult – ‘weather downtime’, where offshore operations are at a standstill, is usually 20–30% (EEA, 2009). Grid connection costs increase because of increased length of the export cable. Export cable costs (including installation) are estimated at 0.5–1 m€/km, with a linear relationship (EEA, 2009).
Increasing water depth affects mostly foundation costs. Foundation costs (including installation) are estimated at around 1.5–2 m€/MW in shallow waters and to rise exponentially with increasing water depth (EEA, 2009).
Utilizing regression analysis, a significant relationship is found for the two variables together, distance to shore and water depth. For both, the coefficient is around 0.1, indicating that a 10% increase in either water depth or distance to shore will imply a 1% increase in specific investment costs. In general, the coefficient for water depth is the best determined, as it is statistically significant. However, due to multi-collinearity between the two variables it is not possible to separate them.


Utilising the data-base for simple partial calculations, Table 2.4 is established, indicating quite strong increases in cost due to further distance to shore and/or increased water depth. Note that due to the partial nature of these calculations, several other parameters influence the results and the big differences cannot be related to the distance to shore and water depth only. For the same reason, they cannot be directly compared to the results of the statistical analyses mentioned above.
2.5. Levelised cost of energy
The total cost per kWh produced (unit cost) is calculated by discounting and levelising investment and O&M costs over the lifetime of the turbine, and then dividing them by the annual electricity production; this is called the levelised cost of energy (LCOE). Thus, LCOE is calculated as an average cost over the turbine's lifetime. In reality, actual costs will be lower than the calculated average at the beginning of the turbine's life, due to low O&M costs, and will increase over the period of turbine use. The turbine's power production is the single most important factor for the cost per unit of power generated. The profitability of a turbine depends largely on whether it is sited at a good wind location.
The costs for offshore wind farms are considerably higher than for onshore turbines. However, this is to a certain degree moderated by higher total electricity production (capacity factor) from the turbines due to higher offshore wind speeds. For an on-land installation utilisation time is normally around 2000–2300 h per year, while a typical offshore installation has a utilisation time of 3000 h per year or above.
As an example the calculated costs per kWh of electricity generated as a function of the wind regime at the chosen sites are shown in Fig. 2.85 where the turbine's investment cost is treated on a sensitivity basis (left), together with a sensitivity analysis on the used discount rate (right). The sensitivity analysis covers investment costs for offshore wind farms ranging from 3200 US$/kW to 5000 US$/kW using a discount rate of 7% p.a. (left figure). The sensitivity analysis on the discount rate ranges from 3% p.a. to 10% p.a. using the average investment cost of 3900 US$/kW (right figure).
As shown, LCOE changes considerably depending on the capacity factor and thus how windy the chosen site is. For an offshore standard installation with an investment cost of 3900 US$/kW the cost ranges from approximately 15 UScent/kWh (13.5 c€/kWh) at sites with average offshore wind speeds (capacity factor of 35%) to approximately 11–12 UScent/kWh (10–11 c€/kWh) at excellent offshore sites (capacity factor of 50%). The Danish wind farm Horns Reef I has a capacity factor of 50%. The sensitivity analysis on investment cost shows that investments ranging from 3200 to 5000 US$/kW imply that LCOE ranges from approximately 13 UScent/kWh (11.5 c€/kWh) to approximately 18 UScent/kWh (16 c€/kWh). The level of the discount rate also has a significant influence; increasing the discount rate from 3% to 10% p.a. increases the LCOE from approximately 12 UScent/kWh (10.5 c€/kWh) to almost 18 UScent/kWh (16 c€/kWh) with a capacity factor of 35%.
As shown in Fig. 2.8 the cost of energy from offshore turbines exceeds the cost for onshore turbines considerably. At good coastal positions, onshore turbines can produce at approximately 6–7 UScent/kWh (5–6 c€/kWh). In Europe coastal positions such as these are mostly to be found on the coasts of the UK, Ireland, France, Denmark and Norway.
The cost of balancing the power production from the turbines is not included in the above-mentioned estimates, normally these costs are borne by the farm owners. According to previous Danish experience, balancing requires an equivalent cost of approximately 3.5 UScent/kWh (3 c€/MWh). Also, balancing costs are subject to high uncertainty and might differ substantially between countries.
The above-mentioned costs are calculated as simple national economic ones, thus these costs will not be those of a private investor, which will have higher financial costs, and require a risk premium and a profit. How much a private investor will add on top of the simple costs will, among other things, depend on the perceived technological and political risk of establishing the offshore wind farm and on the competition between manufacturers and developers.

Figure 2.8 Estimated levelised cost of on- and offshore wind energy, 2009: (left) as a function of capacity factor and investment cost and (right) as a function of capacity factor and discount rate. Wiser, R., Yang, Z., Hand, M., Hohmeyer, O., Infield, D., Jensen, P.H., Nikolaev, V., O'Malley, M., Sinden, G., Zervos, A., 2012. Wind energy. In: Edenhofer et al. (Eds.), Renewable Energy Sources and Climate Change Mitigation, p. 588 (Chapter 7, Figure 7.23).
2.6. Future cost of offshore wind
While future costs are hard to predict and previous expectations about cost reductions from the late 1990s and early 2000s have given way to actual cost increases (UKERC, 2010), the offshore wind industry is still optimistic, expecting significant cost reductions during the next 10 years: An industry survey (Ports, 2014) with 200 executives from the European offshore industry revealed that investment cost reductions of on average 23% are expected until 2023. In several addresses at the EWEA Offshore in 2013, it was argued that the industry is on track to achieve the targets of 40% cost reduction by 2020. A study for the German offshore wind sector (Hobohm et al., 2013) came to the conclusion that cost reductions of up to 39% of the levelised costs can be achieved over the next 10 years in optimum market conditions.
The most important drivers for future cost reductions in the offshore wind supply chain are economies of scale, higher-capacity turbines and technology innovation (Ports, 2014). Additionally, improvements in logistic infrastructure, such as geographic concentration of the supply chain and faster ships, can play a role (Hobohm et al., 2013).
All these factors will create reductions in different cost components. Looking at the investment cost components, it is expected that the three largest elements (turbines, installation, foundations) are also the ones with the highest cost reduction potentials, namely–5–7% each in the short term (Ports, 2014). Turbine costs will mostly be reduced through economies of scale, amongst other things from higher-capacity turbines. Above, we show the previous development of turbine sizes in European offshore wind farms, with the largest installed turbines of 6.15 MW (by the end of 2014). In the near future, we expect to see 8 MW and even 10 MW turbines being installed in European waters. Also, some greater competition in the offshore wind turbine sector is expected. Regarding installation costs, it is expected that a more efficient installation process alone could result in a 1.65% decrease in the total investment cost of an offshore wind farm (Ports, 2014). Furthermore, larger projects and higher-capacity turbines will contribute to the reduction of per MW installation costs. Foundation costs are expected to be reduced through economies of scale, higher-capacity turbines, technology innovation and standardization of foundation designs (Ports, 2014). Also, a holistic design optimisation can contribute to minimising overall costs. Recently developed jacket-based foundations can, for example, be installed within 12 h, rather than in up to 5 days, which are typically required for a monopole foundation (Ports, 2014). Thus, foundation design can significantly influence installation costs as well. Longer-term cost reduction options in investment costs are HVDC connections to shore and even offshore grid networks, which will benefit multiple offshore wind farms at a time.
On the operations side, potentials for O&M cost reduction and performance optimisation are expected to come from three main drivers: reliability, maintainability and operations management (RAB, 2010). The reliability of offshore wind farms is expected to improve from advanced condition monitoring and failure avoidance. Concepts for increasing the maintainability could, for example, include a minimisation of the need for the use of jack-ups for repairs. Improvements in operations management could include condition-based maintenance and scheduling of activity. Due to the highly specific O&M cost for offshore wind farms, cost reduction potentials are difficult to quantify on a general basis.
2.7. Conclusions
Expectations for the development of offshore wind power are high, especially in Europe, where a total offshore wind capacity of 43 GW is expected to be implemented in the EU by 2020. At present the offshore development is dominated by a handful of countries, most of these located in Western Europe. However, in reality the development until now has not been that fast, mainly because considerable cost reductions are still needed.
Offshore wind farms are capital-intensive. Upfront investment costs make up approximately 75% of the total lifetime cost of an offshore wind farm, which is extremely high in comparison to other electricity generation technologies – typically investment costs constitute around 40% of the cost of energy from a conventional power plant. From the investment per MW point of view, offshore wind is still some 50% more expensive than onshore wind. The higher capital costs of offshore are due to the larger structures and complex logistics of installing the towers. The costs of offshore foundations, construction, installations and grid connection are significantly higher than for onshore. However, looking into the LCOE, the higher investment costs are to a certain degree moderated by higher production for offshore wind turbines. For a standard offshore installation with a capacity factor of 35%, LCOE typically ranges from approximately 13 UScent/kWh (11.5 c€/kWh) to approximately 18 UScent/kWh (16 c€/kWh). In comparison a standard on-land installation with a capacity factor of 25%, LCOE typically ranges from approximately 7 UScent/kWh (6 c€/kWh) to approximately 11 UScent/kWh (10 c€/kWh). So there is still quite a long way to go before offshore wind can compete economically on its own.
However, significant potential seems to exist for further cost developments of offshore installations and it is important to analyse how this potential can best be exploited.
..................Content has been hidden....................
You can't read the all page of ebook, please click here login for view all page.