
16
Hydropower flexibility and transmission expansion to support integration of offshore wind
Abstract
In 2013, offshore wind grew over 50%. This increase, concentrated in a relatively small geographical area, can lead to an increased variability of the power produced by offshore wind. The variability is one of the key issues, along transmission, in integrating offshore wind power. Hydro power is one of the fast responding sources of electricity, thus power systems with considerable amounts of flexible hydro power can potentially offer easier integration of offshore wind power. The interaction between offshore wind and hydro power can be benefic, especially when looking at how the flexibility of hydro generation can match the variability of offshore wind, allowing for larger shares of variable generation to be integrated in the power systems without decreasing its stability. The analysis includes two interrelated models, a market model and a flow-based model. The results show that hydropower systems are a very good option for balancing the natural variability of wind power production, especially when installed offshore. The flexibility of hydropower systems allows power systems with a high share of RES to maintain stability. The analysis presented indicates that the value of hydropower flexibility to the European power system is significant, consequently justifying the investment costs for transmission expansion.
Keywords
Hydro power; Offshore wind power; Technology; Transmission system16.1. Introduction
As weather-driven generation, wind power varies naturally with fluctuations in wind pattern. The variations are driven on longer timescales by atmospheric pressure gradients associated with weather patterns and on shorter scales by turbulent eddies. This variability is one of the key issues, along transmission, in integrating offshore wind power. While the geographical cross-correlation of wind generation generally decreases with distance, and therefore tends to be smoothed with an increasing number of turbines spread over wider areas, in the case of massive offshore wind power deployment, as planned for the North Sea in Europe, the smoothening is significantly less due to the concentration of wind power in a relatively small geographical area. Offshore wind grew over 50% annually in 2013, reaching a total installed capacity of almost 7 GW worldwide (BTM, 2014). Hydro power is one of the fast-responding sources of electricity, thus power systems with considerable amounts of flexible hydro power can potentially offer easier integration of offshore wind power.
The objective of this chapter is to present the interaction of offshore wind and hydro power and the chapter also analyzes how the flexibility of hydro generation can match the variability of offshore wind, allowing for larger shares of variable generation to be integrated in the power systems without decreasing its stability.
16.2. Technologies
16.2.1. Offshore wind power
Offshore application is one of the main drivers in the development of large, modern wind turbines. Almost all offshore wind turbines operating today have a rated power of 2 MW or above. Already, in 2013, the first demonstration offshore wind farm with 6-MW wind turbines was put in operation.1 It is generally agreed to divide wind turbines into four types (1–4 or A–D) according to the main electrical design (Hansen, 2012).
For offshore applications, the most commonly used wind turbine uses the type 4 configuration shown in Fig. 16.1. It is characterised by the full-scale back-to-back converters (machine side converter (MSC) and grid side converter (GSC)). The use of the full-scale converter makes it possible to use a multipole generator and thus omit or reduce the gearbox, which has caused significant maintenance costs in some offshore wind power plants.
The power collection grid in an offshore wind power plant collects the power from the individual turbines and transmits it to a transformer station, which is usually placed on an offshore platform, but can also be onshore if the distance to shore is short and/or the wind power plant is not very large.
The vast majority of existing and planned offshore wind power plants use a power collection grid with a voltage level of 33–36 kV, and none of the wind power plants with more than 50-MW capacity has used a voltage level above 36 kV. However, several studies have shown that higher voltage levels for power collection are economically advantageous, especially in future GW-size wind power plants (Mc Dermott, 2009; Saez et al., 2012).

A major advantage of using higher voltage is the reduction in investment costs. Another advantage is that it is possible to construct much larger arrays (Mc Dermott, 2009). Also, the reliability can be improved because lower short-circuit levels make it possible to design the collection grid with a more reliable and cost-effective ring topology (Saez et al., 2012). Finally, there is a potential for reducing the losses, but this will depend on the final design.
Still, wind turbine manufacturers have been reluctant to offer wind turbines with voltage levels above 36 kV. Among the reasons are that dry transformers are not commercially available above 36 kV, which is an issue of installation cost, reliability and safety and environment concerns (Mc Dermott, 2009). Other issues are the switchgear inside the turbine, which will increase in size as the voltage increases, and the need for higher qualification of the maintenance staff.
The possibility to use DC in wind power plant collection grids has been studied in a number of research projects (Max, 2007; Roshanfekr, 2013). The idea is to omit the grid side converter in Fig. 16.1, and connect the machine side converter directly to a DC grid. This is particularly interesting if it is combined with high-voltage direct current (HVDC) transmission described later.
The use of DC power collection has a longer-term perspective compared to the use of higher AC voltages. A key bottleneck here is the commercial development of reliable and efficient DC/DC converters to step up the voltage from the individual wind turbine to the collection grid, and from the collection grid to the HVDC transmission line.
16.2.2. Hydro power
Hydro generation has ideal characteristics for providing balancing resources. This is because of its high regulation speed and relatively low operational cost. Hence, hydro generation can add flexibility and reserve to the power system in order to compensate for the uncertainty introduced by variable renewable power generation.
16.2.2.1. The existing flexibility of the Nordic hydro system
The existing flexibility in the Nordic system is based on import from adjacent countries in periods with low prices and export in periods with high prices such that the net energy exchange on average is approximately zero. Since there is hardly any pumping capacity in the Nordic system, the import to the region is solely balanced by reducing the hydropower production and storing the water. The actual available flexibility will vary a lot from winter to summer, from working-day to weekend and from peak hours to off-peak hours. Due to such uncertainties, the “flexibility” of a system is rather difficult to quantify, but some underlying values are possible to provide, see Table 16.1.
The electricity production of hydropower plants connected to reservoirs can be controlled rather well and they are able to provide flexibility. The total installed capacity of these types of power stations adds up to about 35 GW. Furthermore, the available hydro storage sums up to about 125 TWh, whereas the discharge time for some of the biggest reservoirs is several years.
The actual flexibility is determined by the concurrent demand level in the Nordic area. In addition the operation of the hydropower system is limited by discharge constraints as well as maximum and minimum reservoirs levels due to environmental regulations. Furthermore, these flexibility estimations can be limited by the bottlenecks in the transmission system within the Nordic region or between the Nordic region and other countries.

16.2.2.2. The future flexibility of the hydro system
In the future, the flexibility of the Nordic hydro system is expected to change as a result of various factors:
1. Changes in the hydropower system, such as increase in production capacity or installation of pumping.
2. Stricter rules on hydro operation due to environmental regulations.
3. Changes in the amount of inflow/inflow pattern because of climate change.
The increase in flexibility is primarily expected to be provided by the increase in generation capacity. NVE2 estimates a possible increase of 16.5 GW in western and southern Norway (NVE, 2011). The Centre for Environmental Design of Renewable Energy (CEDREN)3 estimates a potential increase of up to 18.2 GW in southern Norway, without violating current environmental constraints (Solvang et al., 2012). These increases solely include the construction of new power plants, pumps as well as water ways, but no new reservoirs.
16.2.3. Transmission system
Bringing the electricity produced by offshore wind farms to the onshore grid can be done in two ways, based on the technology used: high-voltage alternating current (HVAC) and HVDC, with the latter being further split into line commutated converter (LCC) and voltage source converter (VSC). The transmission infrastructure typically consists of (Fig. 16.2): (a) an offshore transformer platform that collects the power from the wind farm and increases the voltage; (b) a sea cable that transports the power ashore; and (c) a transformer station onshore. For HVDC connections, the transformer stations also accommodate the AC/DC converter.

The main limiting factor for the HVAC cable is the production of large amounts of reactive power, which can partially be overcome using compensation at one or both ends of the cable. In general, for distances up to 50–100 km from shore, the better solution – at least from power losses point of view – is HVAC (Barberis Negra et al., 2006). In AC connections, the power losses are proportional to the square of the current, while the transferred power is proportional to the square of the voltage. Therefore, it is desirable to have as high a voltage as possible. The main limiting factor in increasing the voltage of the transmission circuit is the size of the transformer.
LCC-HVDC is a proven technology used for many years for bulk transport of power. The main advantage of this technology is the proven track record – although this is only for onshore applications and not with wind power – and the relatively high overall conversion efficiency, ie, in the range of 97–98%, while the main disadvantages are the requirement for a relatively strong network, both offshore and onshore, and the comparatively large offshore substation converter (Ackerman et al., 2012).
VSC-HVDC is a much newer technology that is considered to have several significant advantages over LCC-HVDC. The main advantage would be that it does not require a strong offshore or onshore AC network and it can control independently the active and reactive power supply (Ackerman et al., 2012). The main disadvantage – besides the lack of track record and field experience, especially regarding offshore wind power – is represented by the comparatively larger losses in the converters, due to the high switching frequency and high on-state voltage drop of the power electronics semiconductor elements. Nevertheless, the performance of VSC-HVDC is constantly improving, with the losses in the converters being reduced to as low as 1% per converter station (Callavik et al., 2011).
16.3. Summary – case study
16.3.1. Models
The analysis includes two interrelated models – a market model and a flow-based model.
The market model optimises the strategic utilisation of hydro energy in the day-ahead market. It includes a detailed modelling of water courses and hydro production. Since there is no significant operation cost for hydro power, but a limited amount of water stored in the reservoirs and seasonal inflow patterns, an optimal and robust strategy for hydropower production has to be determined (Flatabø et al., 1998; Belsnes et al., 2009).
The results of the market model are verified by a flow-based simulation, including a more detailed grid description (Korpås et al., 2007; Farahmand et al., 2014). This simulation step computes the optimal generation dispatch and flow along lines consistent with the linear approximation of the power flow equations (also called DC power flow) (Wood and Wollenberg, 1996). A detailed analysis on the effect of different offshore grid structures and onshore grid constraints is considered.
16.3.1.1. Strategic exploitation of hydro power using a transport model and area-based representation
The first step in the analysis focuses on the optimal strategy of the hydropower production, given the stochastic inflow to the reservoirs as well as the intermittent production from other renewable energy sources. The market model includes different power system characteristics, considering the distinguishing features of the thermal dominated system in Continental Europe and the hydrothermal system in the Nordic area.
The model is a fundamental optimisation model for the mid- and long-term simulation of hydrothermal power systems. The market model has its strength in the strategic exploitation of hydro energy stored in reservoirs. Stochastic dynamic programming (SDP) is employed to calculate water values. The optimisation is stochastic due to the natural variation in climate variables such as temperature, wind speed and inflow, and dynamic since the utilisation of hydro reservoirs couples dispatch decisions in time. The water values reflect the expected marginal value of the water stored in the reservoirs, when substituting hydro power with other production sources (Wolfgang et al., 2009). To represent the seasonal as well as annual variation of renewable energy sources (RES), several climatic years (75 years in this case) are taken into account. At the same time a high temporal resolution is used in the model in order to account for the short-term variation of RES. Fig. 16.3 shows the aggregated inflow of all 75 climatic years to the Norwegian hydropower system.
In addition to the renewable energy sources, thermal power production is modelled by individual power plants. The inputs to this model include the generation capacity and marginal cost for thermal production, as well as wind production, solar production, electricity consumption, transmission capacity, and information about historical climate variables such as inflow, wind speed, solar radiation and temperature.

The model is divided into several market areas, based on a transport model. The exchange between areas is modelled as transport corridors with a capacity equal to the net transfer capacities (NTCs) between areas. A more detailed description of the model can be found in Wolfgang et al. (2009), while the underlying dataset is described in Jaehnert and Doorman (2014).
16.3.1.2. Detailed grid impact on dispatch of wind and hydro using power flow analysis and nodal representation
In order to achieve efficient utilisation of all the available energy resources, especially RES located far away from load centres, and access flexible resources, transmission systems play a pivotal role. Therefore, the next simulation step is related to detailed techno-economic assessment of transmission bottleneck impacts on wind penetration and usage of hydropower flexibility. The simulations are based on flow-based power market simulations using DC optimal power flow (DCOPF) with a detailed grid model.
The tool used in this simulation step is SINTEF's Power System Simulation Tool (PSST) (Korpås et al., 2007; Farahmand, 2012). PSST considers a detailed grid model and computes the optimal generation dispatch and flow along transmission lines for each hour of the simulation year. The optimal solution for each hour is found by minimising the operating cost that essentially expresses the cost of generation based on different marginal generation costs of available power stations. The scenarios and data for generation portfolio and demand in PSST are consistent with those of the EMPS model.
The distinguishing feature that makes the methodology different from the existing DCOPF algorithm is the modelling of hydro generation and reservoirs. Despite the constant marginal cost of thermal generators, the marginal cost of hydro units (water values) is dependent upon the reservoir level and thus on the amount of water that is available for energy production. The hydro generation is coupled in time by the use of water values and reservoir hydro levels, and PSST is run for the entire year (8760 consecutive hours). This enables the simulation to capture the effect of inflow variation and reservoir hydro level variation related to the hydro generators. At each simulation step, the hydro levels of reservoirs are updated according to the generation and pumping level in the last period and inflow scenario in that time period. The water values are determined based upon the reservoir level and the time of the year. As explained in EMPS model, water values are imported as exogenous inputs from the EMPS model simulation, which is targeted to strategic utilisation of available hydro resources.
16.4. Scenarios
16.4.1. Geographical area (EMPS – the Northern European system and PSST Continental Europe with focus on Northern Europe)
16.4.1.1. EMPS model overview
The Northern European power market model implemented in EMPS includes a detailed system description for Norway, Sweden, Finland, Denmark, Germany, the Netherlands, Belgium and Great Britain. Furthermore, the exchange to neighbouring countries is considered in the simulations. Within the model, Norway, Sweden, Denmark, Germany and Great Britain are split into several areas, accounting for water courses (specifically in the Nordic countries) and bottlenecks in the transmission system. The resulting model area division is shown in Fig. 16.4.
16.4.1.2. PSST model overview
The PSST model covers the Continental European grid. The European transmission grid model consists of five synchronous regions – the Nordic region, RG4 Continental Europe, Great Britain, Ireland and the Baltic region. The total size of the model for each synchronous area, as they are implemented in the model, is shown in Table 16.2.
The model encompasses many countries in Continental Europe listed in Table 16.3.

Figure 16.4 Geographic overview of the EMPS dataset. Farahmand, H., Jaehnert, S., Aigner, T., Huertas-Hernando, D., 2013. TWENTIES Task 16.3. Nordic Hydro Power Generation Flexibility and Transmission Capacity Expansion to Support North European Wind Power: 2020 and 2030 Case Studies. SINTEF Energy Research. D 16.3.

Table 16.3
Countries included in TWENTIES study
| Albania | Denmark | Hungary | Netherlands | Slovenia |
| Austria | Estonia | Ireland | Norway | Spain |
| Belgium | Finland | Italy | Poland | Sweden |
| Bosnia-Herzegovina | France | Latvia | Portugal | Switzerland |
| Bulgaria | Germany | Lithuania | Romania | Ukraine |
| Croatia | Great Britain | Macedonia | Serbia | |
| Czech Republic | Greece | Montenegro | Slovak Republic |

16.4.1.3. Generation mix (2030)
The following case study uses the projected state of the European power system in 2030. The according generation mix for the 2030 scenario is mainly based on the outlook of the EU energy trends to 2030 (EU, 2009) and assumptions made in the IEE-EU OffshoreGrid project (Woyte et al., 2011). The existing generation portfolio is adapted by the decommissioning of aging generators and the installation of new generators in order to match the predicted generation mix. In this future scenario for 2030, fuel costs are assumed to be constant, while the CO2 emission price is expected to increase from 13 €/tonne CO2 (2010) up to 44 €/tonne CO2 (2030) according to the assumptions made in the IEE-EU OffshoreGrid project (Woyte et al., 2011). In addition, the development of nuclear capacity is assumed in accordance with current policies in various countries, specifically regarding the nuclear phase-out in Germany (2011).
In order to achieve representative simulation results, a benchmark scenario (2010) is calibrated to represent the generation mix reported from ENTSO-E.5 A comparison of the generation mix from the calibrated model and the reported data is shown in Fig. 16.5. The calibration is performed by adjusting the availability factors for the different technologies of thermal power plants. See Jaehnert and Doorman (2014) for further explanations of the calibration process. Apart from Germany, the figures are rather consistent. The difference in Germany is due to the utilisation of the power production on all grid levels in the market model, while ENTSO-E solely reports that for the transmission grid level.
16.4.1.4. Offshore wind power per area
Offshore wind power has experienced considerable growth in the last years, reaching 5111 MW installed capacity at the end of 2012, the vast majority of which is in Northern Europe (BTM, 2014). This growth is expected to increase even further, reaching estimated installed capacities between 40 and 56 GW (depending on the scenario) by 2020 (Moccia and Arapogianni, 2011; Cutululis et al., 2012b) and between 110 and 141 GW in 2030 (Cutululis et al., 2012a).

Figure 16.5 Generation mix from the market model results for Northern Europe. (a) EMPS data and (b) ENTSO-E data. Reproduced from: Farahmand, H., Jaehnert, S., Aigner, T., Huertas-Hernando, D., 2015. Nordic hydropower flexibility and transmission expansion to support integration of North European wind power. Wind Energy 18 (6), 1075–1103.
The vast majority of the future offshore wind power will be located in the North and Baltic Seas, hence concentrated in a relatively small geographical area. An illustration is given in Fig. 16.6, including the wind farms planned by 2030 (blue).
The installed capacities, per country, are given in Table 16.4 (Cutululis et al., 2012a)
16.4.1.5. Hydro expansion scenario
Stronger interconnections combined with large-scale development of wind power production in neighbouring countries that are connected to Norway increase the potential for flexible hydropower production, eg, to provide balancing services. Increased hydro generation capacity will have a serious impact on the local ecosystem due to increased variations of the hydro reservoir level and river regulations. Tougher restrictions on the operation of hydropower stations, based upon local environmental impacts, may lead to more limited utilisation of the hydro reservoirs. In this context CEDREN has conducted a study of potential hydro expansion (Solvang et al., 2012). The CEDREN report comprises several case studies for the expansion of hydropower production capacity as well as pumping capacity in southern Norway. It includes 19 specific power plants in southern Norway, which are combined in three different scenarios. These scenarios range from a capacity increase of about 11.2 GW up to an increase of 18.2 GW. These hydro expansion scenarios do not require new regulated reservoirs, and they do not violate the existing environmental restrictions including the limits for the highest and the lowest regulated water level.

Table 16.4
Offshore wind power development scenarios per country
| Country | MW installed by the end 2020 | MW installed by the end 2030 | ||
| Baseline | High | Baseline | High | |
| Belgium | 2156 | 2156 | 3956 | 3956 |
| Denmark | 2811 | 3211 | 4611 | 5811 |
| Estonia | 0 | 0 | 1695 | 1695 |
| Finland | 846 | 1446 | 3833 | 4933 |
| France | 3275 | 3935 | 5650 | 7035 |
| Germany | 8805 | 12,999 | 24,063 | 31,702 |
| Ireland | 1155 | 2119 | 3480 | 4219 |
| Latvia | 0 | 0 | 1100 | 1100 |
| Lithuania | 0 | 0 | 1000 | 1000 |
| Netherlands | 5298 | 6298 | 13,294 | 16,794 |
| Norway | 415 | 1020 | 3215 | 5540 |
| Poland | 500 | 500 | 500 | 500 |
| Russia | 0 | 0 | 500 | 500 |
| Sweden | 1699 | 3129 | 6865 | 8215 |
| UK | 13,711 | 19,381 | 39,901 | 48,071 |
| TOTAL | 40,671 | 56,194 | 113,663 | 141,071 |

In the CEDREN study, it is assumed that no new reservoir is built, whereas the new power stations are constructed with new tunnels between existing reservoirs. Scenario 1 (11 GW) includes 12 new power stations, where five are “pump storage power stations” with a combined installed capacity of 5.2 GW and the remainder are “hydro storage power stations.” The pump storage power stations have reversible pump turbines, pumping water between two reservoirs, while hydro storage power stations are not equipped with such pump turbines.
One of these potential expansions is located in Tonstad in Norway, where a new pump storage power station is expected. Two cases were analysed in connection with Tonstad as follows:
• A1 Tonstad pumped storage power station (Homstølvatn – Sirdalsvatn)
• A2 Tonstad pumped storage power station (Nesjen – Sirdalsvatn)
The new tunnels in these two cases and associated reservoirs are shown in Fig. 16.7. The detailed results for the water level regulation in the upstream and downstream reservoirs as well as all other cases are explained in Solvang et al. (2012).
For the analysed power system scenario of 2030, scenario 1, with an increase of 11.2 GW of hydro generation capacity, is chosen. It is distinguished between new power generation and pumping capacity.
The expansion in the Norwegian hydropower system is solely an expansion of generation and pumping capacity, with no additional inflow. However, the hydro expansion in Sweden is expected to be in the form of small-scale hydropower facilities. The hydro generation capacity in Sweden is expected to increase by 1 GW. No expansion of hydropower production is assumed for Finland or Great Britain.
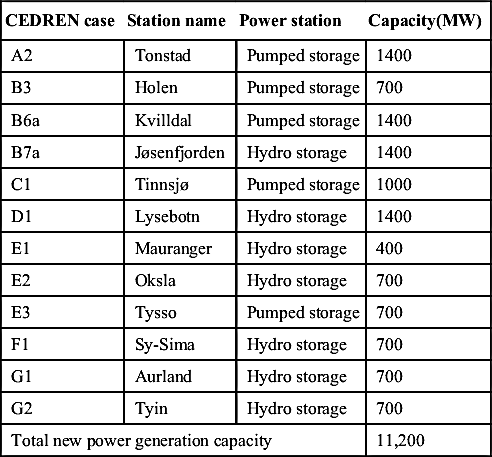
The PSST model likewise distinguishes between the expansion of installed production capacity and the expansion of pumping capacity. When the pumping capacity is increased, the hydro production capacity is increased by the identical capacity. The expanded capacity is proportionally divided among generators in one water course based on their capacity. The overview of capacity expansion is presented in Table 16.5 (Solvang et al., 2012).

Table 16.5
Hydro power expansion and pumping in southern Norway (11.2 GW) in Solvang et al. (2012)
| CEDREN case | Station name | Power station | Capacity(MW) |
| A2 | Tonstad | Pumped storage | 1400 |
| B3 | Holen | Pumped storage | 700 |
| B6a | Kvilldal | Pumped storage | 1400 |
| B7a | Jøsenfjorden | Hydro storage | 1400 |
| C1 | Tinnsjø | Pumped storage | 1000 |
| D1 | Lysebotn | Hydro storage | 1400 |
| E1 | Mauranger | Hydro storage | 400 |
| E2 | Oksla | Hydro storage | 700 |
| E3 | Tysso | Pumped storage | 700 |
| F1 | Sy-Sima | Hydro storage | 700 |
| G1 | Aurland | Hydro storage | 700 |
| G2 | Tyin | Hydro storage | 700 |
| Total new power generation capacity | 11,200 | ||
16.5. Results
16.5.1. Transmission expansion and the impacts on the provision of hydropower flexibility
Fig. 16.8 illustrates the geographical distribution of the new hydropower stations throughout southern Norway, which coincide with the current largest installed hydropower plants. Solid arrows in Fig. 16.8 indicate power stations that can, in principle, be linked directly to HVDC cables, since they are located close to the sea. As shown, most of the new stations can be directly connected to HVDC cables without the need for reinforcement of the central transmission grid within Norway. However, in order to maintain the exchange with the international grid in the case when one or some of the external links are out of service, it is necessary to upgrade the internal grid. The dotted lines in Fig. 16.8 between the new stations can be the part of the internal grid in Norway that requires to be upgraded.
This will call for the construction of new 420-kV links and upgrading to 420 kV at several points on the relevant routes. According to Statnett's grid development plan, the Norwegian south-west corridor reaching from Aurland down to the southern tip is planned to be upgraded. The existing plans for new links and voltage upgrades in the central transmission grid are described in Statnett (2013).

Figure 16.8 Geographical distribution of the new power stations. Solvang, E., Harby, A., Killingtveit, Å., 2012. Increasing Balance Power Capacity in Norwegian Hydroelectric Power Stations (A Preliminary Study of Specific Cases in Southern Norway). SINTEF Energy Research, CEDREN Project, Project No. 12X757.
The power station installation at Tinnsjø may represent the greatest challenge with regard to grid capacity since the distance to appropriate international links is the longest here. The size of the installation will also determine which alternatives are possible. There will be several connection points in the central transmission grid which are appropriate for a new or upgraded 420-kV link from the Tinnsjø area. These may be located to the north towards Nore or to the east and south-east towards Flesaker and Rød/Hasle. The south-west link is a possible exchange route linking onwards to Europe.
In periods when power from Tinnsjø can relieve (take over) the power transmission between western Norway and the south-eastern region, the need for grid expansion will be less than if this power is being supplied in addition to this transmission from west to east. However, it is not certain that this fact will be of significance when assessing grid capacity requirements.
The above discussion shows that for a provision of flexibility of the Norwegian hydro system to Continental Europe, not only hydro generation and pumping capacity is necessary, but also appropriate transmission capacity.
16.5.2. EMPS results
16.5.2.1. Strategy for using hydro power
Since there is a limited amount of water stored in the hydro reservoirs, its long-term utilisation has to be optimised. The dual values of the weekly reservoir balance constraint are regarded as the water values. The water values reflect the expected marginal value of water stored in the reservoirs, when substituting hydro power with other production sources (Wolfgang et al., 2009). The water values are calculated in the market model and are an exogenous input to power-flow model. The resulting water values matrix is a function of the reservoir level and the week within a year. Fig. 16.9 shows the water value matrix for a reservoir in southern Norway.
The water values are used as the marginal production cost for hydro power. Given these production costs as the optimal strategy, the hydropower system is used to balance fluctuating energy inflow, in the short term as well as in the long term.
16.5.2.2. Hydro production and reservoir handling
The large share of hydropower production in the Nordic area is considered to provide an essential share of production flexibility to the continental power system in order to be able to integrate large amounts of variable power production from RES into the power system.

Figure 16.9 Calculated water values for a reservoir in southern Norway (Farahmand et al., 2014). Farahmand, H., Jaehnert, S., Aigner, T., Huertas-Hernando, D., 2014. Nordic hydropower flexibility and transmission expansion to support integration of North European wind power. Wind Energy 18 (article in press).
Figs 16.10 and 16.11 show the accumulated reservoir handling (reservoir trajectories) and hydropower production in Norway for all hours in all 75 climatic years. Plotted are the percentiles for all 75 climatic years in order to display the annual variability.
In the 2010 scenario, the reservoir handling (Fig. 16.10a) is characteristic for the Nordic countries, with depletion during the winter and early spring as well as filling during the rest of the year. Assessing the reservoir handling for the 2030 scenario (Fig. 16.11a) shows minor differences. It can be observed that the reservoir levels become higher in general, while the seasonal reservoir storage capability is utilised less. This means that percentiles of the reservoir handling become more spreadout and flatter. It also indicates a change of the reservoir utilisation from a longer-term perspective as compared to shorter term.
The aggregated hydropower production for Norway illustrates that significant changes in the hydro production pattern can be expected. In 2010 (Fig. 16.10b) there is a rather stable seasonal production trend, with higher production during winter and lower production during the summer, according to the demand in the Nordic area. In addition there is a diurnal pattern, resulting from the differences in demand during day and night as well as the weekend.
The stable seasonal pattern vanishes and more volatile hydropower production occurs in the 2030 scenario (Fig. 16.11b). These changes are due to the significant integration of wind power production in the future power system.
16.5.2.3. Electricity prices and transmission
The following figures (Figs 16.12 and 16.13) give a geographic overview of the simulation results for the benchmark case (2010) and the 2030 scenario. Shown are average area prices as well as the marginal profit (congestion rent) of the transmission corridors, which indicate the congestions in the system. The area prices are given as the average over all 75 climatic years. The marginal profit is the annual average over all 75 climatic years as well.
In 2010 (Fig. 16.12), low prices in the north and high prices in the south are observed, with two minor exceptions, southern Sweden and eastern Germany. The congestion rent is highest on the interconnectors between the Nordic area and Continental Europe, especially on the NorNed cable (about 60 €/kW per annum). Rather low area prices can be observed in the UK, which is due to a high generation capacity of base load power plants.
In the 2030 scenario (Fig. 16.13), prices increase significantly in Continental Europe, while there is a certain price decrease in the Nordic area and the UK. This price development is due to the decommissioning of a high share of thermal generation capacity in Continental Europe. On the other side large capacities of wind power productions are expected to be commissioned in the Nordic area (Sweden) as well as the UK (Scotland).

Figure 16.10 Reservoir handling/hydropower production in Norway 2010. (a) Reservoir handling and (b) hydro production. Reproduced from: Farahmand, H., Jaehnert, S., Aigner, T., Huertas-Hernando, D., 2013. TWENTIES Task 16.3. Nordic Hydro Power Generation Flexibility and Transmission Capacity Expansion to Support North European Wind Power: 2020 and 2030 Case Studies. SINTEF Energy Research, D 16.3.

Figure 16.11 Reservoir handling/hydropower production in Norway 2030. (a) Reservoir handling and (b) hydro production. Reproduced from: Farahmand, H., Jaehnert, S., Aigner, T., Huertas-Hernando, D., 2013. TWENTIES Task 16.3. Nordic Hydro Power Generation Flexibility and Transmission Capacity Expansion to Support North European Wind Power: 2020 and 2030 Case Studies. SINTEF Energy Research, D 16.3.

Figure 16.12 Geographic overview 2010. (a) Area prices and (b) marginal transmission profit. Reproduced from: Farahmand, H., Jaehnert, S., Aigner, T., Huertas-Hernando, D., 2013. TWENTIES Task 16.3. Nordic Hydro Power Generation Flexibility and Transmission Capacity Expansion to Support North European Wind Power: 2020 and 2030 Case Studies. SINTEF Energy Research, D 16.3.

Figure 16.13 Geographic overview 2030. (a) Area prices and (b) marginal transmission profit. Reproduced from: Farahmand, H., Jaehnert, S., Aigner, T., Huertas-Hernando, D., 2013. TWENTIES Task 16.3. Nordic Hydro Power Generation Flexibility and Transmission Capacity Expansion to Support North European Wind Power: 2020 and 2030 Case Studies. SINTEF Energy Research, D 16.3.
The connections between the Nordic area and Continental Europe are still most congested, whereas the marginal profit is more than doubled compared to 2010. In addition, increasing congestions can be observed on the corridor between England and Scotland. These large marginal profits on the transmission corridors show the need as well as the potential for a further expansion of those transmission corridors.
The development of the average electricity prices in the future scenarios is mainly influenced by two factors, the additional power production from RES and the expected increase of production costs of thermal power plants.
16.5.3. PSST results
The case study for this analysis covers the whole European transmission grid model consisting of five synchronous regions: the Nordic region, RG Continental Europe6, Great Britain, Ireland, and the Baltic region. The grid model of the Nordic power system is taken from the Norwegian Water Resources and Energy Directorate (NVE) transmission dataset. The model determines the topology of the grid, and the distribution of loads and generation units. For RG Continental Europe ENTSO-E UCTE study model “winter in 2008”, has been used. The grid model represents a snapshot of the power system for that period of year while the demand and generation portfolio are provided by other sources (Woyte et al., 2011; ADAPT, 2008). Network data for Great Britain describing the transmission system, the demand and the generation by fuel type, are available from the 2009 Seven Year Statement on the National Grid Website (National Grid, 2011). For Ireland, no data describing the network have been made available to the project. However, as this is a fairly small network, a two bus equivalent, one for the Republic of Ireland and the other for Northern Ireland, was assumed to be adequate for the purpose of this study. For the Baltic countries, Estonia, Latvia and Lithuania, a reduced equivalent model as in Korpås et al. (2007) is adapted.
16.5.3.1. Offshore grid alternatives to export Nordic hydro flexibility to Continental Europe
In this analysis, our main focus is to perform a detailed techno-economic analysis to find out the impact of the grid, both onshore and offshore, to exploit the RES generation and flexibility of the Nordic hydro production. Hence, several grid case studies are investigated for different offshore grid topologies and onshore grid constraints for the 2030 scenario.
In order to study the optimal offshore grid topology, the optimal offshore grid topology introduced in IEE-EU OffshoreGrid project (Woyte et al., 2011) is considered as a basis. The increased capacity of hydro power in southern Norway is considered in our simulation for 2030 (Solvang et al., 2012). In addition to the assumptions in the IEE-EU OffshoreGrid project (Woyte et al., 2011), it is important to consider further alternatives for offshore grid topologies in order to exploit the potential additional hydropower production in an optimal way. In this respect, three different offshore grid structures are considered, including:
• “Case A”: Original offshore grid according to the IEE-EU OffshoreGrid project without any connection between the Ægir offshore wind farm in Norway and the other parts of the grid (Fig. 16.14a).
• “Case B”: Offshore grid with connection between the Ægir offshore wind farm and Eemshaven, a seaport in northern Netherlands (Fig. 16.14b).
• “Case C”: Offshore grid with connection between the Ægir wind farm and the Gaia offshore wind farm in Germany (Fig. 16.14c).
Fig. 16.14 shows different offshore grid alternatives in this study. “Case A” is the design proposed in IEE-EU OffshoreGrid project. A rather limited hydro capacity expansion was considered in Norway by 2030 in Woyte et al. (2011). However, the scenarios for hydro capacity expansion considered in Solvang et al. (2012), motivate the introduction of new offshore grid alternatives “Case B” and “Case C”. In “Case B”, there is a direct connection between the Norwegian offshore node and the onshore grid in the Netherlands, which allows transfer of hydropower flexibility and offshore wind power directly to the onshore grid. In “Case C” the offshore grid is closed in a loop between Norway, Great Britain and Germany offshore nodes. In this offshore grid configuration, power flows circulate among the countries around the North Sea. This configuration facilitates circulation of power, use of hydropower flexibility from the Norwegian system and penetration of installed offshore wind power to the onshore grid.

Figure 16.14 Proposed offshore grid alternatives. (a) Case A, (b) Case B and (c) Case C. Reproduced from: Farahmand, H., Jaehnert, S., Aigner, T., Huertas-Hernando, D., 2013. TWENTIES Task 16.3. Nordic Hydro Power Generation Flexibility and Transmission Capacity Expansion to Support North European Wind Power: 2020 and 2030 Case Studies. SINTEF Energy Research, D 16.3.
In order to study the effect of onshore constraints, we superimpose scenarios for onshore grid constraints on the proposed offshore grid alternatives. The scenarios for onshore grid constraints are clustered in three categories including:
• No Constraint (NC)
• Internal Constraint (IC)
• Internal Constraint with Expansion (ICE)
The “NC” scenario represents the case without internal constraints in the EU grid. In this case, the internal grid in each country is considered as a copper plate, whereas cross-border grid constraints are considered by limiting the transmission capacity for each individual cross-border transmission line and NTC values for the corridors linking countries and areas inside Germany. The NTCs used between areas inside Germany are taken from the dena Grid study-II (dena, 2010).
The “IC” scenario considers the onshore grid with today's internal grid limitations in the German, the Dutch, the British and the Scandinavian systems.
The “ICE” scenario represents a situation, where the grid in “IC” scenario is expanded. In Norway, the expansion includes the grid reinforcements according to Statnett's Network Development Plan (Statnett, 2013), which includes a transmission corridor connecting the proposed hydropower stations located in southern Norway from the CEDREN study (Solvang et al., 2012). In central Europe the grid is expanded according to the Ten-Year Network Development Plan (ENTSO-E, 2012).
Table 16.6 presents the annual operating cost taking into account the proposed onshore constraints (“NC”, “IC” and “ICE”), and proposed offshore grid cases. The onshore grid constraints in the German and the Dutch systems limit the transmission of wind and hydro production to the load centres inland, hence increasing the operating cost. The comparison indicates that “NC” is always the solution with the lowest operating cost since the highest penetration of offshore wind is possible into the system. In this scenario, “Case B” of the offshore grid (a direct connection between the Norwegian offshore node and the onshore grid in the Netherlands) results in the lowest operating cost.
For “IC” and “ICE” scenarios, the results show a different picture with respect to offshore grid topologies. The optimal offshore grid topology appears to be “Case C”, where the offshore grid is closed in a loop between Norway, Great Britain and Germany offshore nodes.
According to investment estimation in L'Abbate and Migliavacca (2011), the investment cost for offshore HVDC grid is expected to be 1700 €/(MW km). The distance between the Norwegian and the German offshore wind farms is roughly assumed to be 350 km. The distance between the Norwegian offshore wind farm and Eemshaven in the Netherlands is assumed to be approximately 500 km. The connection capacity is expected to be 1000 MW. In this respect, the investment costs for the extra tie-line in “Case B” and “Case C” with respect to “Case A” are approximated to be 850 MEUR and 600 MEUR, respectively. Taking into account 100 MEUR for the costs of DC/AC converters, switchgears and transformers (L'Abbate and Migliavacca, 2011), the overall cost of the interconnections are roughly expected to be 950 MEUR and 700 MEUR for “Case B” and “Case C”, respectively. The life time factor (LFT) for the lifetime of 30 years and 5% discount rate is  . This factor allows a comparison of the operational savings accumulated throughout the life time of grid project, which is annual savings × 15.3725. The accumulated savings for “NC-Case B”, “IC-Case C” and “ICE-Case C” are ∼1225 MEUR, ∼936 MEUR and ∼1005 MEUR, respectively. The reference offshore case for this saving is “Case A” (original offshore grid according to the IEE-EU OffshoreGrid project). Comparing these numbers with investment for all expanded corridors indicates that all accumulated savings are greater than investment cost for each corridor. Therefore, it turns out that making investments in those corridors is profitable in comparison with the accumulated savings throughout the lifetime of the corridors.

16.5.3.2. Case study in Tonstad to assess the correlation between wind and pumping profile
The internal grid bottlenecks in the continental system limit the transmission of wind energy from offshore wind facilities in the North Sea to the load centres. Thus, surplus power production is redirected towards the Nordic system largely affecting the production behaviour and the reservoir levels where the pump storage facilities are expected to be installed in southern Norway. This impact has been observed in our simulation in the simulated reservoir trajectory at Tonstad hydropower station. The reservoir is expected to serve as a host for a new pump storage unit according to Solvang et al. (2012). Furthermore, Tonstad will be directly connected to the planned HVDC cable to Germany (NordLink). The NordLink HVDC link will link southern Norway to northern Germany. Moreover, two offshore wind production facilities in Germany, the offshore wind farms DanTysk and NordseeOst, are both planned to be connected to the grid point at the German terminal of NordLink cable. Thus, the NordLink cable is connected at one end to Tonstad pump hydro station and at the other end to two offshore wind farms.
Fig. 16.15 illustrates the correlation between the Tonstad pumping pattern and the German offshore wind production at wind facilities connected to NordLink HVDC cable. The figure shows that pumping at the Tonstad hydropower station is highly correlated with the variation in wind production at DanTysk and NordseeOst. These results illustrate that in the future power system with a large penetration of wind energy and high level of interconnections, the pumping strategy in the Nordic region will not only be influenced by seasonal inflows but also by the variability of wind production around the North Sea in case of offshore interconnectors in the form of point-to-point HVDC links between countries and a meshed offshore grid.

Figure 16.15 Wind power production of the German offshore facilities connected to the NorGer HVDC cable versus pumping pattern in Tonstad. Reproduced from: Farahmand, H., Jaehnert, S., Aigner, T., Huertas-Hernando, D., 2014. Nordic hydropower flexibility and transmission expansion to support integration of North European wind power. Wind Energy (article in press).
16.6. Conclusions
Hydropower systems are a very good option for balancing the natural variability of wind power production, especially when installed offshore. The flexibility of hydropower systems allows power systems with a high share of RES to maintain stability. However, the flexibility of hydropower systems is not unlimited and is determined by the concurrent demand level in the Nordic area. In addition, the operation of the hydropower system is limited by discharge constraints as well as maximum and minimum reservoir levels due to environmental regulations. Furthermore, transmission bottlenecks can also limit the flexibility of hydropower systems.
The analysis presented indicates that the value of hydropower flexibility to the European power system is significant, consequently justifying the investment costs for transmission expansion. The results illustrate that in the future power system with a large penetration of wind energy and high level of interconnections, the pumping strategy in the Nordic region will not only be influenced by seasonal inflows but also by the variability of wind production around the North Sea in case of offshore interconnectors in the form of point-to-point HVDC links between countries and a meshed offshore grid.
..................Content has been hidden....................
You can't read the all page of ebook, please click here login for view all page.