
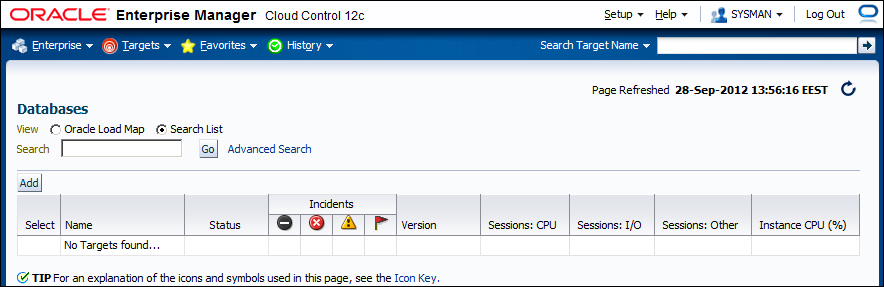
- We have a Data Guard configuration of one primary, one physical standby, and one logical standby database. The hosts in the Data Guard configuration were added as targets to Cloud Control. Now the first thing we need to do is add the databases as targets. Log in to the Cloud Control interface, and on the main page click on Targets and then Databases. See the following screenshot showing no database targets. Click on Add to create a database target.
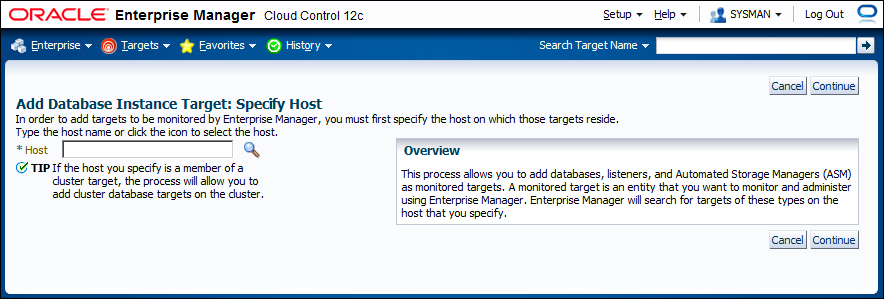
- The next page will ask for the host that runs on the database. First add the primary database as the target, so type the hostname of the primary database server and click on Continue.
- Cloud Control will discover all the databases running on the specified host, including ASM instances, if they exist. Select the primary database and click on the configure button that is shown with a wrench icon:

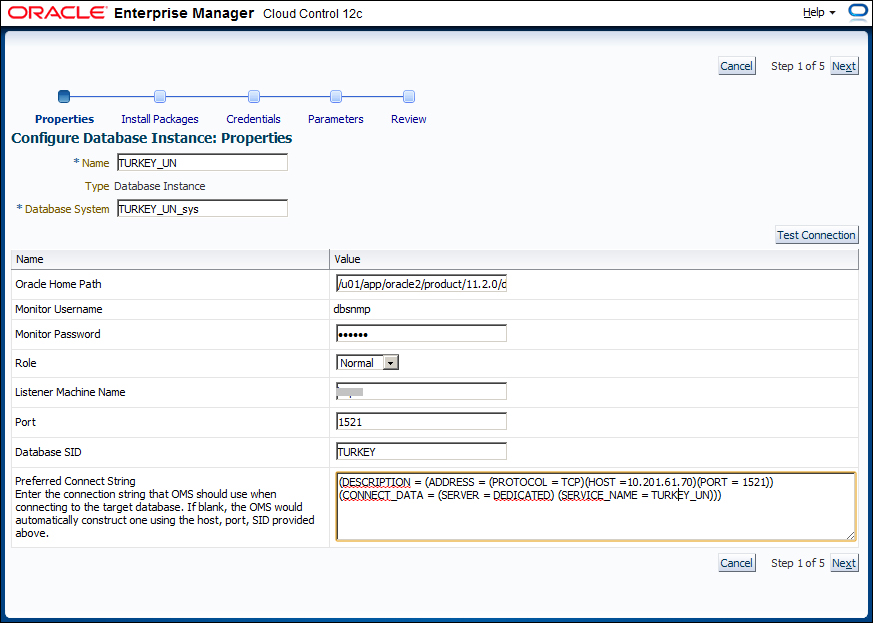
- On the database configuration screen shown in the following screenshot, control the autofilled fields; type the password of the DBSNMP user and also the connect string for the database. We can click on Test Connection to check if Cloud Control is able to connect to the database. Click on Next to continue. A review screen will show up; check the information and click on OK.
- After completing the configuration of the database target, turn back to the screen showing the discovered databases. Click on Finish and then on the Summary page; then click on Save. The primary database will be added to the database target list.
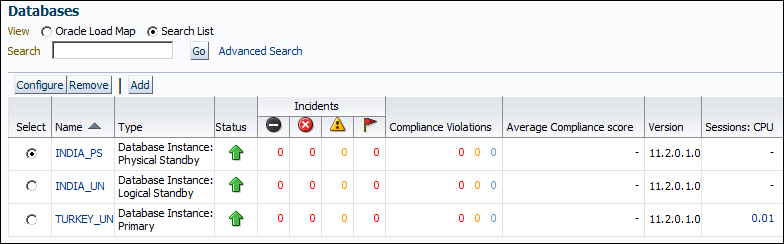
- Repeat the same steps to add all the standby databases to the target database list. At the end, we'll be able to see all the databases of the Data Guard configuration as targets on the database targets screen:
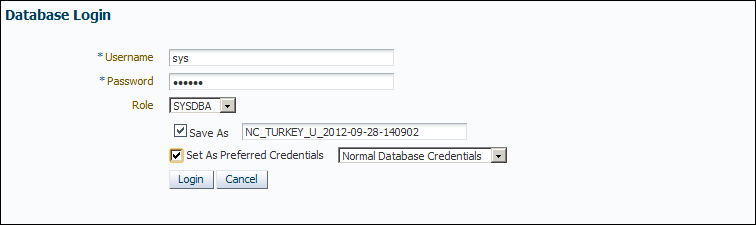
- All the databases are listed, but Cloud Control is not aware yet that these databases are in the same Data Guard configuration. In order to complete the integration, click on the name of the primary database. On the database home screen, click on Availability and then click on Add Standby Database. We'll see a database login screen as shown in the following screenshot. We need to connect to the primary database as SYSDBA to add a standby database. So type the login information for the sys user and select the SYSDBA role. We can save this login information for logging in again in the future, and also set it as a preferred credential as shown in the following screenshot. Click on Login to continue.
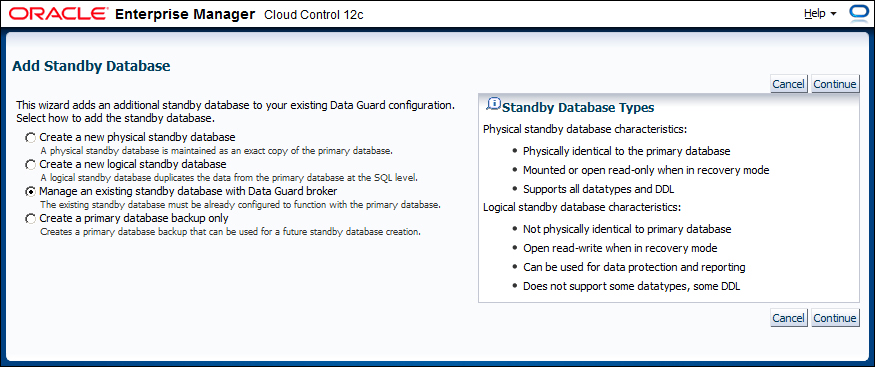
- We'll see the Add Standby Database wizard screen. Besides adding an existing standby to Cloud Control, it's also possible to create a new standby database with this wizard. Now select the Manage an existing standby database with Data Guard broker option and click on Continue:
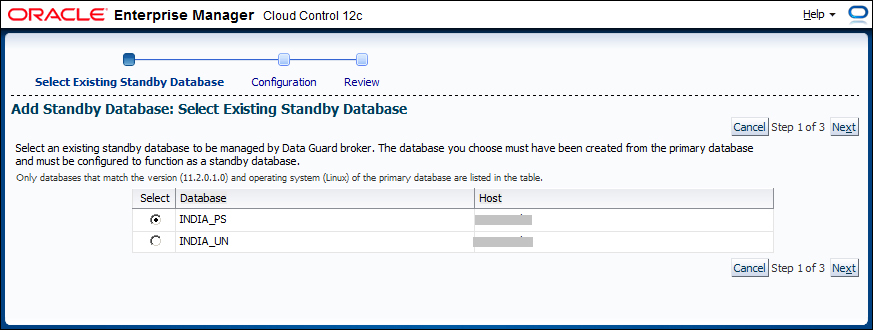
- Now we can see the two standby databases. Select one of them and click on Next. If there is only one standby database, just click on Next:
- Enter the login credential in the next step and click on Next.
- The next step will show the standby archive location and Data Guard connect identifier. If FRA is enabled, the standby archive location will be shown as
USE_DB_RECOVERY_FILE_DEST. In the connect identifier, it's possible to select the connect descriptor used by Enterprise Manager for the standby database or use an existing net service name, which is the same as the example used in our book. Click on Next to continue: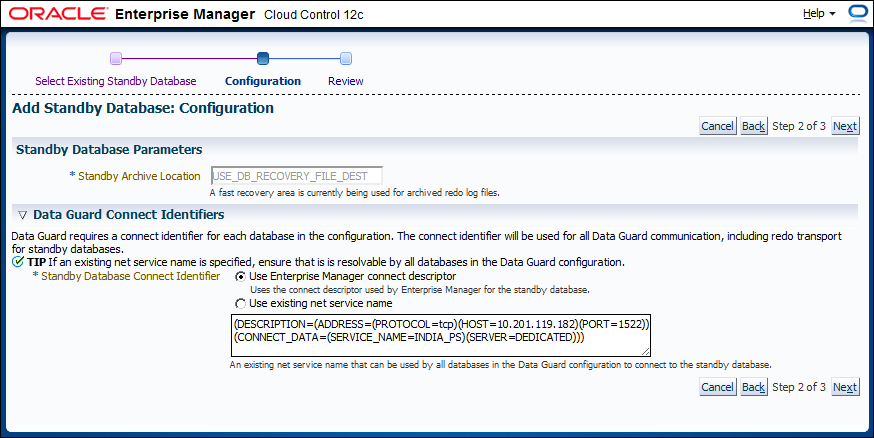
- A review screen will show up. Check the information and click on Finish to complete integrating the standby database with the primary database.
Tip
After this step, Enterprise Manager will execute several
ALTERcommands on the primary and standby databases. This is a reconfiguration of the Data Guard parameters in order to guarantee a properly integrated Data Guard environment. Check the primary and standby database alert logs to see theALTERcommands.
We've now completed integrating the existing Data Guard environment with Enterprise Manager Cloud Control, and we're able to benefit from the Data Guard monitoring and management properties of Cloud Control.
Add the logical standby database, if it exists, with the same steps. Note that physical and logical standby databases have no difference when integrating with the primary database on Cloud Control.
We can access the Data Guard administration home page, shown in the following screenshot, by clicking on Availability and then on Data Guard Administration on the database home page of any of the databases in the Data Guard configuration. It's possible to monitor and manage Data Guard properties using this screen.

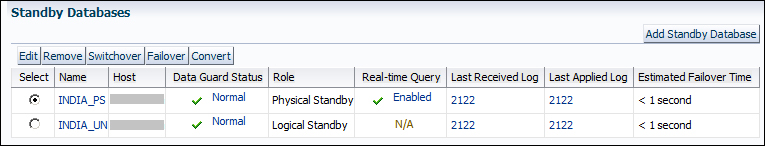
This screen provides general information about the status of Data Guard. We can see the member databases and roles of the Data Guard configuration, the protection mode, Active Data Guard, and the fast-start failover status, the transport and apply lags, if they exist, the last received and applied log sequences, and the estimated failover time on this screen. So it provides a lot of useful information at a single glance.
Whereas a lot of this information can also be gathered easily with other interfaces, it's very practical to access it all in one screen. The Estimated Failover Time information shows the approximate number of seconds required for the failover to this standby database. It is very useful to compare the current Data Guard status with Recovery Time Objective (RTO), which is the disaster recovery element specifying the duration of time within which a business process (database in our case) must be restored after a disaster.
Besides monitoring the Data Guard configuration, this screen also provides links to change the Data Guard properties, which is covered in the next section. We will use the Data Guard Administration interface of Cloud Control to modify the configuration.
The Data Guard Administration home page offers quick links to change a property when showing its current value. For example, in the Overview section, the Protection Mode field shows Maximum Performance; when we click on the Maximum Performance link, we can access the Change Protection Mode screen. Also, Fast-Start Failover shows Disabled, and when we click on Disabled, we see the Fast-Start Failover: Configure screen.
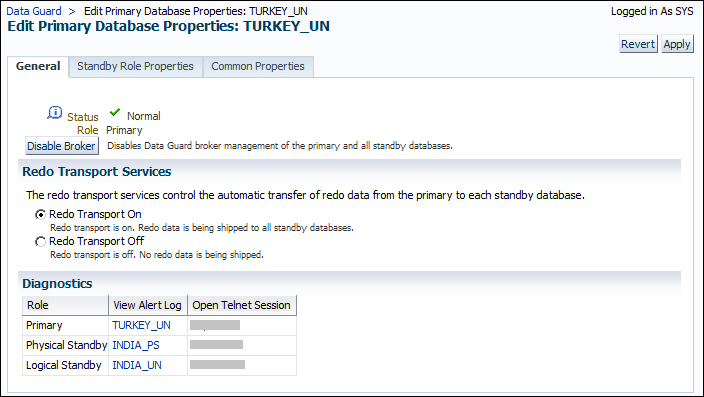
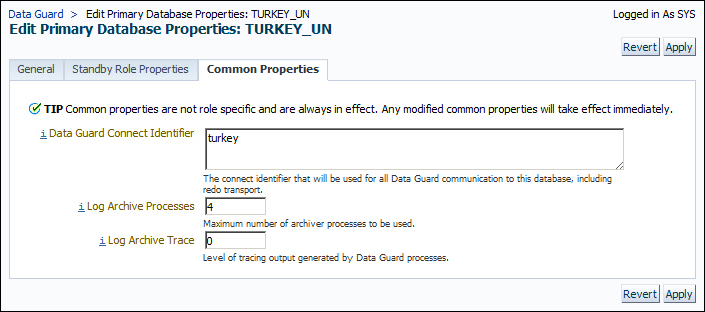
You can edit primary database properties by clicking on Edit in the Primary Database section. The screen will offer three tabs to change the properties:
- General: Using this tab, we can stop/start the redo transport services, view the alert logs of all the databases in the configuration, open the telnet session for the database hosts and disable/enable the Data Guard broker.
- Standby Role Properties: This tab enables us to set the standby role properties that will be valid after a role change. We can set the Redo Transport Mode field to SYNC or ASYNC, enable/disable redo compression, set the timeout and delay, choose an archive log location for the standby role, and specify the filename convert parameters.

- Common Properties: In this tab, there are some properties that are not role-specific, such as the connect identifier, number of archiver processes, and level of tracing output generated by the Data Guard processes.
At the bottom of the Data Guard Administration home page, we have buttons to perform the following tasks:
- To edit the standby database properties, which offer similar options to the primary database
- To start a switchover or failover to a target standby
- To convert a physical standby into a snapshot standby database
- To add a new standby database to the Data Guard configuration
We can also enable/disable Active Data Guard using the link under Real-time Query. If we click on the sequence numbers of the last received and applied archive logs, we'll see the Log File Details screen that lists the log files that have not been received and those that have been received but not applied by the standby databases in the Data Guard configuration.
Now let's try changing a Data Guard property. The following section will show how to enable or disable the fast-start failover.