
There are three areas of monitoring that an Oracle SOA Suite 12c administrator typically focuses on. They are as follows:
- Transactions
- Instance state and performance
- Infrastructure
This chapter covers these three areas in detail, providing a comprehensive handle on all aspects of environment monitoring in general. The ultimate goal as an administrator is to ensure that the infrastructure executes transactions reliably and efficiently.
Transactional monitoring involves the following:
- Reviewing faulted instances to take action (retry, replay, or ignore).
- Searching log files for additional log information on faulted instances.
- Searching through composite sensors if the end user complains of a particular business transaction not going through (if composite sensors are implemented in the code).
- Enabling selective tracing, which allows you to change the trace level for a defined scope. Examples of a scope are a particular logged-in user, deployed application, or BPEL composite.
Monitoring instance state and performance involves the following:
Infrastructure monitoring involves the following:
- Reviewing filesystem log files for system and application errors
- Monitoring the Oracle WebLogic Server managed servers for the overall health
- Monitoring the JVM for appropriate sizing and garbage collection frequency
- Monitoring Java Message Service (JMS) destinations, such as queues and topics to ensure that messages are being processed
- Monitoring data sources to preemptively identify any issues
- Monitoring threads
- Monitoring operating to system-level parameters
Once you understand all areas of monitoring, it might make sense to invest in a tool that helps with the automation of the monitoring activities, an area we do not discuss in this book as there are many options available on the market. Oracle's standard monitoring solution for Oracle SOA Suite 12c is Oracle Enterprise Manager Cloud Control with the SOA Management Pack.
When monitoring instances, the goal is to achieve two purposes: to identify transactions that have not been completed successfully to determine further action and ensure that the transactions do not experience poor performance.
When a message is received by the SOA Infrastructure, it may pass through multiple components within your infrastructure and may even traverse multiple external systems as well. For example, an order may be received by an OSB service which then passes it on to a BPEL process for further processing before finally placing it into a queue. Afterwards, it may be consumed by a third-party application that processes this order before sending it back to a Mediator service that routes it to the final order management application.
If one of the six steps in this particular integration fails, how can you identify the location of the message? It would also be important to know the duration of execution by the component to determine whether they are within the defined SLAs.
In this section, which focuses primarily on SOA composites (not OSB services), we provide you with the tools necessary for effective transaction monitoring across the server. OSB monitoring is described later in the chapter.
To monitor SOA composite instances, you should first understand a few key concepts, which are as follows:
- Every instance displayed on Fusion Middleware Control is a composite instance. Each composite instance is designated a unique composite instance ID.
- Every SOA composite may consist of one or more components (for example, BPEL, BPMN, human workflow, Mediator, and so on). You must navigate to the composite instance and drill down to the component to view its details. Every component has its own component instance ID.
- The Flow ID is the ID that is used throughout SOA Suite to tie together all composite and component instances. Related to this, though not the same, is the Execution Context ID (ECID), a global, unique identifier of a particular transaction. It is injected into the header of the payload when the instance is first created and is included throughout the lifecycle of the payload. Thus, the ECID may appear in multiple composites and components. The ECID should not be confused with any of the instance IDs described earlier.
- Every composite instance and component instance has metadata that includes the creation time, last updated time, and state of the instance.
One of the more common activities that an administrator performs is retrieving a list of faulty or rejected SOA composite instances and getting the necessary information to troubleshoot them.
In SOA Suite 12c, this has been simplified. To access the new fault screen, click on soa-infra and then click on the Error Hospital tab. This screen provides a unified method to review and recover the faulted instances. Faults can be searched for based upon instance start times and fault times. Additionally, they can be grouped by Composite, Partition, and Fault Code to name a few. This can be helpful for getting a quick glance at issues that occur in the infrastructure and sometimes provides the ability to act on them.
Unfortunately, the fault shown on the console may not contain enough information to effectively handle the error and a review of the log files may be necessary. Later in this chapter, we discuss how to identify and view log file information as well as how to increase the logger levels to provide more details.
Composite sensors are added to the SOA composite at design time by the developer. They are not specific to BPEL or Mediator but are instead captured at the composite level. They provide a method of implementing traceable fields on messages.
For example, composite sensors can be used to capture business indicators, such as a customer ID or an order number, and persist this data in the database, which then becomes searchable via the Fusion Middleware Control console.
If the composite is not designed to capture composite sensors, you will not be able to search on them. Refer to the following screenshot to get a look at a composite sensor:
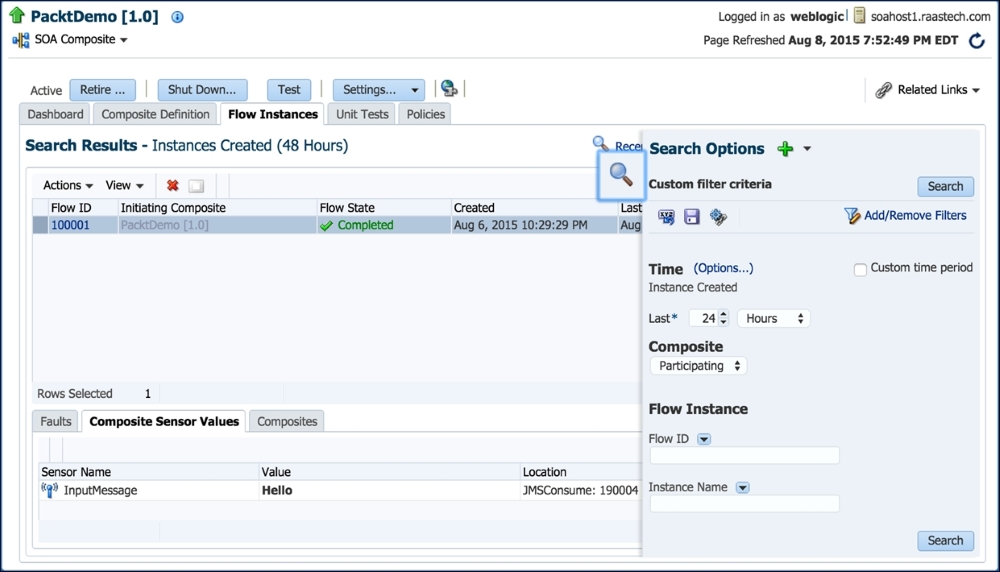
Figure 6.1: Searching by composite sensors
To search for a composite sensor, perform the following steps:
- Click on the Flow Instances tab and confirm that the Flow Instance header exists. If it does not, then click on Add/Remove Filters, check the box next to Flow Instance, and click on the OK tab.
- Now, click on the Add Sensor Values tab, and you should be able to choose a Sensor Name field and corresponding value. Figure 6.1 shows that the PacktDemo[1.0] composite has an InputMessage sensor name with the value Hello.
- When selected, a new search field is added, allowing you to search by that particular composite sensor on this page.
Remember, composite sensors can technically capture any type of data defined by the developer at design time. When searching by a particular composite sensor, a list of instances will be retrieved that contain that particular sensor value.
You can view all composite sensors and their values for an instance by clicking on an instance row and then clicking on the Composite Sensor Values tab, as shown in the previous screenshot.
Developers are encouraged to implement composite sensors. This allows the administrator to search a particular business field such as an order number or customer ID. There is also no limit on the number of composite sensors that can be added to a composite. You can also query the COMPOSITE_SENSOR_VALUE table in the database to retrieve composite sensor data.
Another useful set of information is available from the Sensors tab of your BPEL process. BPEL process sensors are somewhat similar in concept to composite sensors, though they come in three types. BPEL sensors capture the values of activity, variables, and fault sensors, if any, that are configured at design time.
Sensors are very important means of instrumentation in business processes as they record key business or process analytics information. Take a look at Figure 6.2 and you will see how a Variable Sensors field records the value of the MessageID variable.
Sensors are another means of making sure that business processes are executed with all the checks and balances in place. Only sensors with a Sensor action of the Publish Type field of Database will appear on the page.
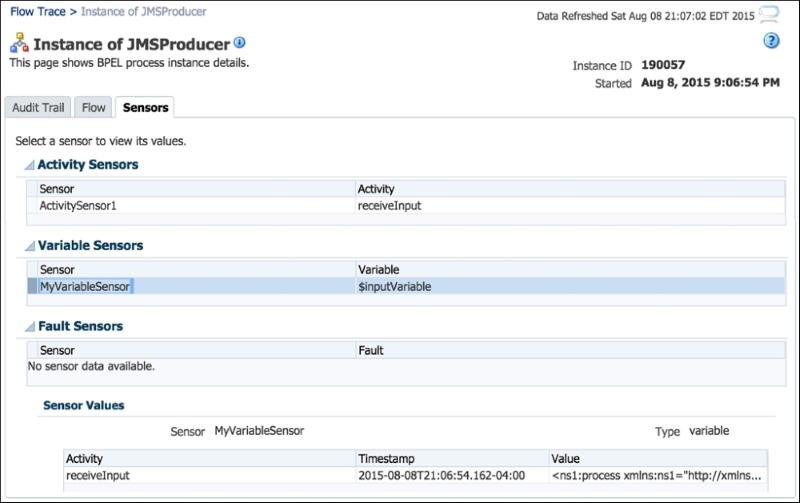
Figure 6.2: Viewing the sensors defined in a BPEL process
The metadata information for process sensors is stored in the dehydration store database. You can find the sensor configuration information for each type in their corresponding dehydration store tables ACTIVITY_SENSOR_VALUES, VARIABLE_SENSOR_VALUES, and FAULT_SENSOR_VALUES in the [PREFIX]_SOAINFRA schema. The data in these tables is also stored in clear text.
To effectively perform transaction monitoring, it helps to understand the difference between the various IDs. Every individual component instance has an Instance ID, and these are largely inconsequential. The exception is when you hunt down the correct execution, for example, in the event of a transactional JMS execution where a single component may be executed multiple times due to connectivity failures.
Every composite instance has a unique Instance ID, which is commonly referred to as the composite instance ID. The Flow ID, on the other hand, is a sequential numeric identifier and is the primary means of navigating instances through the console. It is also the internal way that SOA Suite 12c ties all individual component executions together in a single transactional flow.
Finally, the ECID is a global, unique identifier of a particular transaction. It has a one-to-one correlation with the Flow ID, making it relatively unused for internal purposes. However, as a message is passed from a composite to another, the ECID is passed with each message. This allows the correlation of a message across different components, even when the message leaves Oracle SOA Suite 12c and comes back!
An ECID is generated when Oracle Fusion Middleware first processes the request. If it exists in the message header, no new ECID is generated. The following is an example of an ECID:
00575SHJjdD5e_xaw9rY6G0000QD0004Sq
In the following sample integration design, we have a BPEL process that produces a message in to an external JMS queue. Afterwards, this message is consumed asynchronously by another BPEL process that passes it on to a Mediator service, which in turn invokes a final BPEL process.

Figure 6.3: The design of our sample integration
Each component instance has its own Instance ID (refer to the Instance IDs 190057, 190060, 190061, and 190062 in the flow in Figure 6.4). Upon the instantiation of the first composite, an ECID is generated. As shown in the figure, the first composite instantiated includes the BPEL component JMSProducer with an Instance ID of 190057.
The Flow ID is shown in the top-right corner of the flow trace of the figure. The ECID related to this Flow ID is inserted as a property in the message as it is passed onto the next composite. What does that do you may ask? All composites and components within this single flow maintain the same ECID, allowing us to tie the execution of the transaction into a single flow, as shown in the following screenshot:

Figure 6.4: Composite instance correlation is achieved by the ECID
Querying the database also confirms this. We can query the SCA_FLOW_INSTANCE table for this particular Flow ID:
SELECT flow_id, ecid, created_time
FROM   sca_flow_instance
WHERE  ecid = '0000KwiWDQP5e_xaw9rY6G1Ln9XS00000M';
The following screenshot shows two composite instances associated with this ECID:

Figure 6.5: Querying the SCA_FLOW_INSTANCES table
Each of these composites has a single component. Thus, we can query the CUBE_INSTANCE table to also retrieve a similar flow, but at the component level:
SELECT flow_id, composite_name, component_name, componenttype, state, and creation_date
FROM   cube_instance
WHERE  ecid = '0000KwiWDQP5e_xaw9rY6G1Ln9XS00000M';
Once again, the two components are displayed alongside their types, states, and creation times, as shown in the following screenshot:

Figure 6.6: Querying the CUBE_INSTANCE table
Querying the product database tables is perhaps the quickest and simplest mechanism to retrieve detailed instance information. Chapter 8, Managing the Database will cover more details about the key database tables that maintain runtime data.
There are several means available to help you assist in the viewing of SOA composite instance performance. You can view the details of a single instance through the console or you can rely on several out-of-the-box graphs and metrics. In this chapter, you will also have access to key SQL queries to obtain more detailed performance metrics.
What is often confusing about the console is that most of the timestamps shown are actually the last update time of the transaction and not the time it was created. Keep this in mind as sometimes the timestamps may appear out of order, particularly in flows that are linked together via the ECID and are completed at different times.
Let's say that in Figure 6.4, you clicked on the JMSProducer BPEL component. You will then be taken to the BPEL component details, as shown in Figure 6.7. Timestamps can often give you a good idea on the duration time to execute specific activities. For example, the Wait activity shown in the following screenshot took 3 seconds to complete, indicated by having started at 11:44:14 AM and ended at 11:44:17 AM:

Figure 6.7: The BPEL component audit trail
By clicking on the Flow Trace link on the top-left side of Figure 6.7, you are taken back to the flow trace shown in Figure 6.4. Clicking on the Mediator component named ChoiceMediator gives you Figure 6.8. Likewise, the difference in timestamps can give you an idea of how long a specific routing rule, transformation, assignment, or invocation has taken. For example, the entire execution of the Mediator has taken 4 seconds, as indicated by the start time of 11:44:14 AM and end time of 11:44:18 AM in the following screenshot:

Figure 6.8: The Mediator component audit trail
On the navigator, expand SOA, right-click on soa-infra, and navigate to Monitoring | Performance | Summary. The Performance Summary page is displayed, as shown in Figure 6.9. On the right-hand side of this page is the Metric Palette section where you can pick and choose the metrics you want to display. We have chosen the following metrics to be displayed for the composite named PacktDemo:
- Average processing time for successful instances
- Average incoming message processing time
As you can see in Figure 6.9, the average processing time for successful instances (but not failed instances) is steady at the subsecond time: 0.004 seconds for the InterestingBPEL BPEL component and just a shade over 0.15 seconds for the JMSConsumer BPEL component.
However, we see that the average incoming message processing time, which is the time it took for the BPEL process to consume the message from the JMS queue, experienced a slight dip from over 0.02 seconds to around 0.015 seconds, potentially indicating that our system has seen a reduction in the overall load, as shown in the following screenshot:

Figure 6.9: The Performance Summary page
On the navigator, expand SOA, right-click on soa-infra, and navigate to Monitoring | Request Processing. The Request Processing page is displayed, revealing the Service Engines, Service Infrastructure, and Binding Component metrics. The following screenshot shows the Service Engines metrics on this page. These are high-level metrics at the service engine level. Clicking on the service engine Name takes you to the service engine home dashboard, allowing you to drill down the statistics, instances, faults, deployed composites, and recovery of the service engine.

Figure 6.10: The Service Engines metrics on the Request Processing page
The CUBE_INSTANCE table can be queried to obtain performance metrics on BPEL and BPMN processes, specifically the duration that each component took. Figure 6.11 shows you the output of the following query, which displays a list of all BPEL component instances, their state, average, minimum, and maximum durations, as well as total count:
SELECT domain_name,
       component_name,
       state,
       TO_CHAR(AVG((TO_NUMBER(SUBSTR(TO_CHAR(MODIFY_DATE-CREATION_DATE),12,2))*60*60) + (TO_NUMBER(SUBSTR(TO_CHAR(MODIFY_DATE-CREATION_DATE),15,2))*60) + TO_NUMBER(SUBSTR(TO_CHAR(MODIFY_DATE-CREATION_DATE),18,4))),'999990.000') Avg,
       TO_CHAR(MIN((TO_NUMBER(SUBSTR(TO_CHAR(MODIFY_DATE-CREATION_DATE),12,2))*60*60) + (TO_NUMBER(SUBSTR(TO_CHAR(MODIFY_DATE-CREATION_DATE),15,2))*60) + TO_NUMBER(SUBSTR(TO_CHAR(MODIFY_DATE-CREATION_DATE),18,4))),'999990.000') Min,
       TO_CHAR(MAX((TO_NUMBER(SUBSTR(TO_CHAR(MODIFY_DATE-CREATION_DATE),12,2))*60*60) + (TO_NUMBER(SUBSTR(TO_CHAR(MODIFY_DATE-CREATION_DATE),15,2))*60) + TO_NUMBER(SUBSTR(TO_CHAR(MODIFY_DATE-CREATION_DATE),18,4))),'999990.000') Max,
       COUNT(1) count
FROM   cube_instance
GROUP BY domain_name, component_name, state
ORDER BY component_name, state
In the following screenshot, we can see that there are three successfully completed instances of the BPELProcess1 BPEL process in the default partition. These three instances took an average of 202.6 seconds and a maximum of 606.9 seconds to complete.

Figure 6.11: Performance metrics obtained from the CUBE_INSTANCE table
This query provides a single, consolidated snapshot of all BPEL/BPMN high-level performance metrics.
To those who are familiar with Oracle Service Bus 11g, using 12c for the first time will seem a little different when trying to monitor OSB instances. While the concept is the same, Oracle is increasingly bringing OSB more into the fold in terms of how to monitor it. The monitoring functions of OSB have all been moved into Fusion Middleware Control.
Because OSB is designed to be a stateless system, no instance states are captured and maintained unlike SOA composite instances. In fact, no runtime data is stored in the database except for reporting and resequencing functionality (if enabled). Thus, the reliance on the filesystem log files becomes necessary when monitoring OSB instances.
Chapter 4, Managing Services, highlighted some of OSB's operational settings, but here we will delve into several of them in a little more detail, namely:
- Monitoring
- Message tracing
- SLA Alerts
- Reports
- Logging
- Execution tracing
On the navigator in Fusion Middleware Control, expand SOA and then service-bus and click on the OSB service you would like to monitor.
In the following screenshot, we navigated to our HelloWorldOSB service. Click on the Operations tab. The settings described earlier can be changed dynamically at runtime from here:
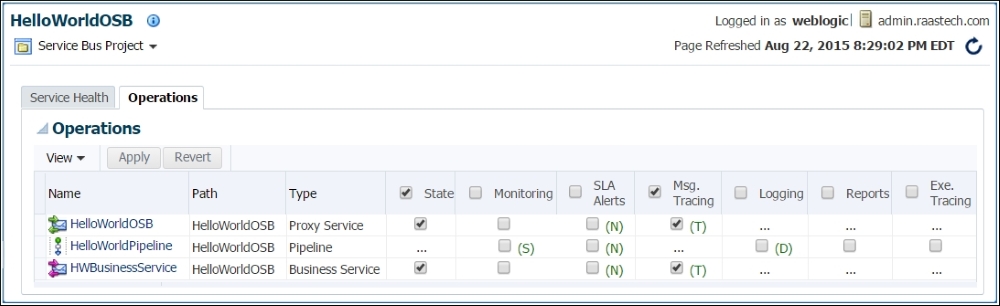
Figure 6.12: Manipulating the operation settings of on OSB service
All the captured information described in the remainder of this section is logged to the osb_server1-diagnostic.log file located under the $DOMAIN_HOME/servers/osb_server1 directory.
When the Monitoring operational setting is enabled, if you click on the service's Service Health tab, it begins to reveal statistics related to that OSB service (as shown in the following screenshot) such as the average response time, the number of invocations (via the Messages column), errors, SLA alerts, and pipeline alerts. Detailed information on the OSB service is not provided here aside from counts and average response time.

Figure 6.13: Reviewing the OSB service's health after enabling monitoring
Message tracing is only enabled at either the proxy service or business service levels. Enabling it on the business service, for example, reveals a little bit more information, namely ECID, Flow ID, and URI, as shown in the logs:
[2015-08-22T20:39:32.643-04:00] [osb_server1] [NOTIFICATION] [OSB-398202] [oracle.osb.resources.service.service] [tid: [ACTIVE].ExecuteThread: '4' for queue: 'weblogic.kernel.Default (self-tuning)'] [userId: <anonymous>] [ecid: abc31d2b-f294-4f7c-9a35-a05f988ff385-0002e6a7,0] [APP: Service Bus Publish] [FlowId: 0000KxNzjjo5e_xaw9rY6G1Loe2z000013] [[
 [OSB Tracing] Outbound request was sent.

 Service Ref = HelloWorldOSB/HWBusinessService
 URI = http://soahost1.packt.com:8001/soa-infra/services/default/HelloWorldSOA/client_ep
]]
Refer to the section titled Managing OSB service operations in Chapter 4, Managing Services. SLA Alerts are defined at design time and can be enabled/disabled at runtime.
Refer to the section titled Managing OSB service operations in Chapter 4, Managing Services. Reports are defined at design time and can be enabled/disabled at runtime. Reports can only be defined within a pipeline.
Logging is an activity that can be defined at design time. The following screenshot shows that a variable is configured to be captured and an annotation with the text My Input Element is also logged. The developer can also define the severity level at which this log should take effect.

Figure 6.14: Setting logs during OSB design time
When the logging operational setting is enabled, the following entry is shown in the diagnostic log. The ECID and Flow ID are shown as well as the annotation and variable being defined at design time:
[2015-08-22T20:40:28.490-04:00] [osb_server1] [NOTIFICATION] [] [oracle.osb.logging.pipeline] [tid: [ACTIVE].ExecuteThread: '21' for queue: 'weblogic.kernel.Default (self-tuning)'] [userId: <anonymous>] [ecid: abc31d2b-f294-4f7c-9a35-a05f988ff385-0002e6b4,0] [APP: Service Bus Logging] [FlowId: 0000KxNzxOT5e_xaw9rY6G1Loe2z000016] [PipelinePairNode1, PipelinePairNode1_request, stage1, REQUEST] My Input Element: < hel:input xmlns:hel="http://xmlns.oracle.com/Packt/HelloWorldSOA/HelloWorld" xmlns:soapenv="http://schemas.xmlsoap.org/soap/envelope/">Florapaz</hel:input>
Logging is an action that can only be defined within a pipeline.
Execution tracing can only be applied at the pipeline level, and this is perhaps the most valuable troubleshooting setting available for OSB instances.
In our simple HelloWorldOSB example, execution tracing created 497 extra lines in the log file for a total of 28 KB of additional log data for a single instance! So, exercise caution when enabling this setting.
The value of execution tracing is that every step is captured in detail, allowing us to perform thorough monitoring and troubleshooting. We have taken the entire dump of our log and filtered it to list the [OSB Tracing] entries only for the purpose of identifying the steps being logged:
[OSB Tracing] Entering proxy HelloWorldOSB/HelloWorldPipeline with message context:
[OSB Tracing] Entering pipeline pair PipelinePairNode1 with message context:
[OSB Tracing] Entering pipeline PipelinePairNode1_request with message context:
[OSB Tracing] Entering stage stage1 with message context:
[OSB Tracing] Exiting stage
[OSB Tracing] The following variables are added:
[OSB Tracing] The following variables are changed:
[OSB Tracing] Exiting Pipeline
[OSB Tracing] Exiting pipeline pair
[OSB Tracing] Echoing request
[OSB Tracing] Exiting HelloWorldOSB/HelloWorldPipeline
We now display a condensed snippet of only one of the preceding trace entries. Here, the actual step we are in is shown (for example, Entering pipeline pair PipelinePairNode1), and the invoked URI (for example, /HelloWorldOSB), the operation called (example, process), and the entire payload is logged including all its header information:
[2015-08-22T20:41:41.861-04:00] [osb_server1] [NOTIFICATION] [OSB-382162] [oracle.osb.pipeline.kernel.router] [tid: [ACTIVE].ExecuteThread: '9' for queue: 'weblogic.kernel.Default (self-tuning)'] [userId: <anonymous>] [ecid: abc31d2b-f294-4f7c-9a35-a05f988ff385-0002e715,0] [APP: Service Bus Kernel] [FlowId: 0000KxO0FIo5e_xaw9rY6G1Loe2z000017] [[
[OSB Tracing] Entering pipeline pair PipelinePairNode1 with message context:
 [MessageContextImpl  body="<soapenv:Body xmlns:soapenv="http://schemas.xmlsoap.org/soap/envelope/" xmlns:hel="http://xmlns.oracle.com/Packt/HelloWorldSOA/HelloWorld">
  <hel:process>
    <hel:input>Florapaz</hel:input>
  </hel:process>
</soapenv:Body>"
 operation="process"
 messageID="N53e0d4be.N7b469f38.12.14f57e189f6.N7ffc"
 attachments="<con:attachments xmlns:con="http://www.bea.com/wli/sb/context"/>"
 outbound="null"
 fault="null"
 inbound="<con:endpoint name="ProxyService$HelloWorldOSB$HelloWorldOSB" xmlns:con="http://www.bea.com/wli/sb/context">
  <con:service>
    <con:operation>process</con:operation>
  </con:service>
  <con:transport>
    <con:uri>/HelloWorldOSB</con:uri>
    <con:mode>request-response</con:mode>
    <con:qualityOfService>best-effort</con:qualityOfService>
    <con:request xsi:type="http:HttpRequestMetaData" xmlns:http="http://www.bea.com/wli/sb/transports/http" xmlns:xsi="http://www.w3.org/2001/XMLSchema-instance">
      <tran:headers xsi:type="http:HttpRequestHeaders" xmlns:tran="http://www.bea.com/wli/sb/transports">
        <http:Accept-Encoding>gzip,deflate</http:Accept-Encoding>
        <http:Connection>Keep-Alive</http:Connection>
        <http:Content-Length>310</http:Content-Length>
        <http:Host>admin.raastech.com:4011</http:Host>
        <http:SOAPAction>"process"</http:SOAPAction>
      </tran:headers>
      <http:http-method>POST</http:http-method>
    </con:request>
]
]]