How about starting by saying Hello to the World? Not original but enough for a very first practical exercise. Here is how you do it:
- Create a folder named
pdi_labsunder the folder of your choice. - Open Spoon.
- From the main menu select File | New Transformation.
- At the left-hand side of the screen, you'll see a tree of Steps. Expand the Input branch by double-clicking it.
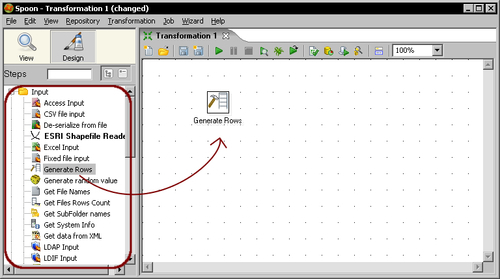
- Left-click the Generate Rows icon.
- Without releasing the button, drag-and-drop the selected icon to the main canvas. The screen will look like this:
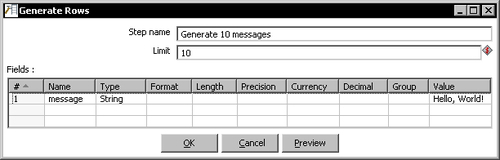
- Double-click the Generate Rows step that you just put in the canvas and fill the text boxes and grid as follows:
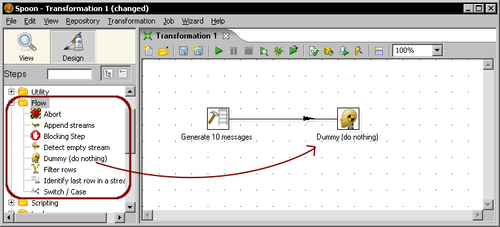
- From the Steps tree, double-click the Flow step.
- Click the Dummy icon and drag-and-drop it to the main canvas.
- Click the Generate Rows step and holding the Shift key down, drag the cursor towards the Dummy step. Release the button. The screen should look like this:
- Right-click somewhere on the canvas to bring up a contextual menu.
- Select New note. A note editor appears.
- Type some description such as Hello World! and click OK.
- From the main menu, select Transformation | Configuration. A window appears to specify transformation properties. Fill the Transformation name with a simple name as hello_world. Fill the Description field with a short description such as My first transformation. Finally provide a more clear explanation in the Extended description text box and click OK.
- From the main menu, select File | Save.
- Save the transformation in the folder
pdi_labswith the namehello_world. - Select the Dummy step by left-clicking it.
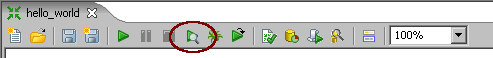
- Click on the Preview button in the menu above the main canvas.
- A debug window appears. Click the Quick Launch button.
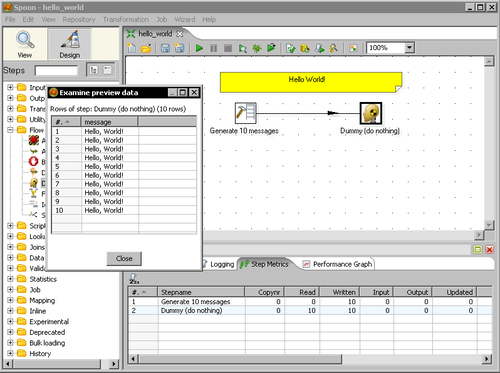
- The following window appears to preview the data generated by the transformation:
- Close the preview window and click the Run button.
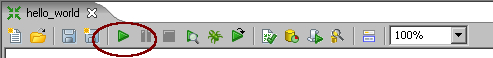
- A window appears. Click Launch.
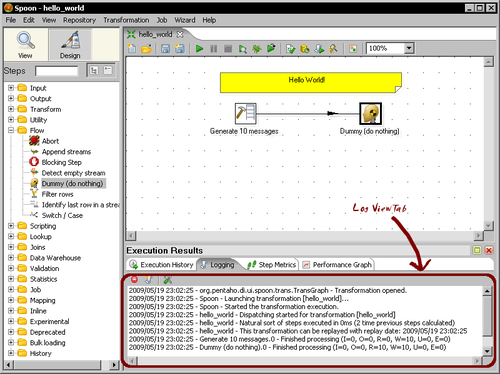
- The execution results are shown in the bottom of the screen. The Logging tab should look as follows:
You've just created your first transformation.
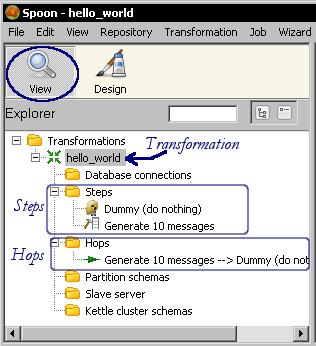
First, you created a new transformation. From the tree on the left, you dragged two steps and drop them into the canvas. Finally, you linked them with a hop.
With the Generate Rows step, you created 10 rows of data with the message Hello World!. The Dummy step simply served as a destination of those rows.
After creating the transformation, you did a preview. The preview allowed you to see the content of the created data, this is, the 10 rows with the message Hello World!
Finally, you ran the transformation. You could see the results of the execution at the bottom of the windows. There is a tab named Step Metrics with information about what happens with each steps in the transformation. There is also a Logging tab showing a complete detail of what happened.
As shown in the following diagram, transformation is an entity made of steps linked by hops. These steps and hops build paths through which data flows. The data enters or is created in a step, the step applies some kind of transformation to it, and finally the data leaves that step. Therefore, it's said that a transformation is data-flow oriented.
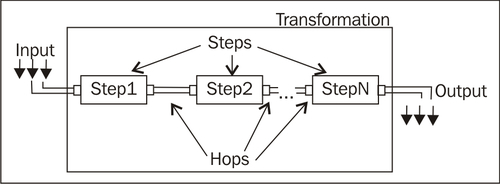
A transformation itself is not a program nor an executable file. It is just plain XML. The transformation contains metadata that tells the Kettle engine what to do.
A step is the minimal unit inside a transformation. A big set of steps is available. These steps are grouped in categories such as the input and flow categories that you saw in the example. Each step is conceived to accomplish a specific function, going from reading a parameter to normalizing a dataset. Each step has a configuration window. These windows vary according to the functionality of the steps and the category to which they belong. What all steps have in common are the name and description:
|
Step property |
Description |
|---|---|
|
Name |
A representative name inside the transformation. |
|
Description |
A brief explanation that allows you to clarify the purpose of the step. It's not mandatory but it is useful. |
A hop is a graphical representation of data flowing between two steps—an origin and a destination. The data that flows through that hop constitutes the output data of the origin step and the input data of the destination step.
As you just saw, the Spoon is the tool using which you create, preview, and run transformations. The following screenshot shows you the basic work areas:
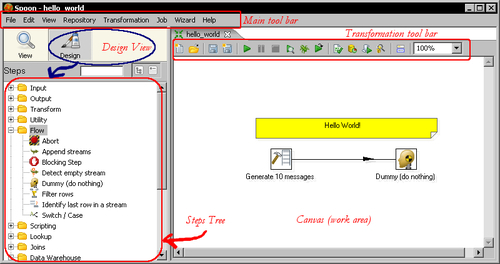
The Preview functionality allows you to see a sample of the data produced for selected steps. In the previous example, you previewed the output of the Dummy Step. The Run option effectively runs the whole transformation.
Whether you preview or run a transformation, you'll get an execution results window showing what happened. Let's explain it through an example.