
Can you recollect the exercise about examinations you did in the previous chapter? You created an incremental file with examination results. The final file looked like the following:
---------------------------------------------------------
Annual Language Examinations
Testing writing, reading, speaking and listening skills
---------------------------------------------------------
student_code;name;writing;reading;speaking;listening;file_processed;process_date
80711-85;William Miller; 81;83;80;90;C:pdi_filesinputfirst_turn.txt;28-05-2009
20362-34;Jennifer Martin; 87;76;70;80;C:pdi_filesinputfirst_turn.txt;28-05-2009
75283-17;Margaret Wilson; 99;94;90;80;C:pdi_filesinputfirst_turn.txt;28-05-2009
83714-28;Helen Thomas; 89;97;80;80;C:pdi_filesinputfirst_turn.txt;28-05-2009
61666-55;Maria Thomas; 88;77;70;80;C:pdi_filesinputfirst_turn.txt;28-05-2009
...
Now you want to convert all grades in the scale 0-100 to a new scale from 0 to 5. Also, you want to take the average grade to see how the students did.
- Create a new transformation, give it a name and description, and save it.
- By using a Text file input step, read the
examination.txtfile. Give the name and location of the file, check the Content tab to see that everything matches your file, and fill the Fields tab as here: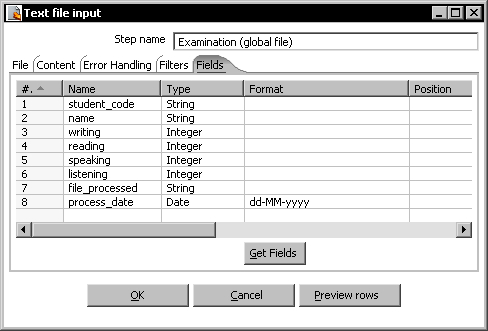
- Do a preview just to confirm that the step is well configured.
Tip
Notice that you have several lines as header. Because the names of the fields are not in the first row, you won't be able to use the Get Fields button successfully. You will have to write the fields manually, or you can avoid it by doing the following: Configure the step with a copy of the file that doesn't have the extra heading, just the heading row with the names of the fields. Then, restore the name of your file in the File tab, adjust the number of headings in the Content tab, and your step is ready.
- Use the Select values step to remove the fields you will not use—
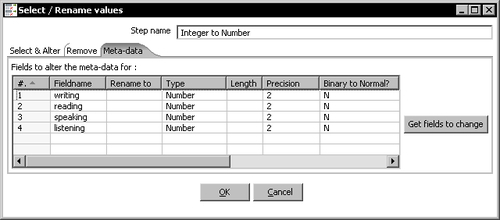
file_processedandprocess_date. - Drag another Select values step to the canvas. Select the Meta-data tab and change the meta-data of the numeric fields like here:
- Near the upper-left corner of the screen, above the step tree, there is a textbox for searching. Type
calcin the textbox. While you type, a filter is applied to show you only the steps that contain, in their name or description, the text you typed. You should be seeing this:
- Among the steps you see, select the Calculator step and drag it to the canvas.
- To remove the filter, clear the typed text.
- Create a hop from the Text file input step to the Calculator step.
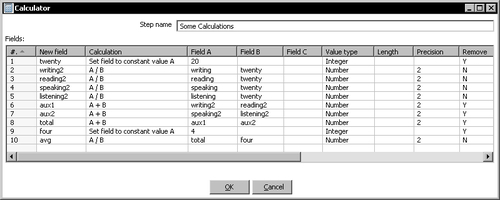
- Edit the Calculator step and fill the grid as follows:

- To fill the Calculation column, simply select the operation from the list provided. Be sure to fill every column in the grid like shown in the screenshot.
- Leave the Calculator step selected and click the Preview this transformation button followed by the Quick Launch button. You should see something similar to the following screenshot:
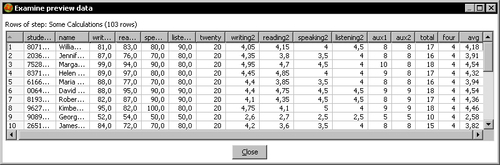
The numbers may vary according to the contents of your file.
- Edit the calculator again and change the content of the Remove column like here:
- From the Transform category of steps, add a Sort rows step and create a hop from the Calculator step to this new step.
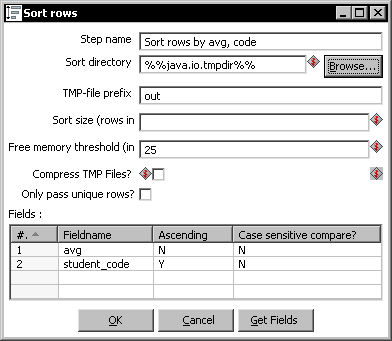
- Edit the Sort rows step by double-clicking it, click the Get Fields button, and adjust the grid as follows:
- Click OK.
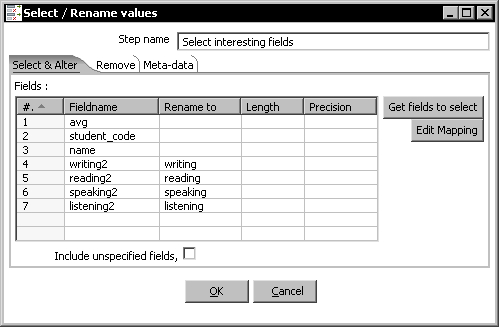
- Drag a third Select values step, create a hop from the Sort rows step to this new step, and use it to keep only the fields by which you ordered the data:
- From the Flow category of steps, add a Dummy step and create a hop from the last Select values step to this.
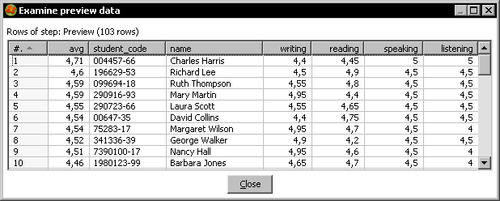
- Select the Dummy step and do a preview.
- The final preview looks like the following screenshot:
Tip
If you get an error or a different result, review the explanation and make sure that you followed the instructions correctly. Do a preview on each step to discover in which one you have the problem. If you realize that the problem is in any of the steps that read the input files, please refer to the Troubleshooting reading files section in Chapter 2.
You read the examination.txt file, and did some calculations to see how the students did. You did the calculations by using the Calculator step.
First of all, you removed the fields you didn't need from the stream of data.
After that, you did the following calculations:
By dividing by 20, you converted all grades from the scale 0-100 to the scale 0-5.
Then, you calculated the average of the grades for the four skills—writing, reading, listening, and speaking. You created two auxiliary fields, aux1 and aux2, to calculate partial sums. After that, you created the field total with the sum of aux1 and aux2, another auxiliary field with the number 4, and finally the avg as the division of the total by the field four.
In order to obtain the new grades, as well as the average with two decimal positions, you need the result of the operation to be of a numeric type with precision 2. Therefore, you had to change the metadata, by adding a Select values step before the Calculator. With the Select values you changed the type of the numeric fields from integer to number, that is, float numbers. If you didn't, the quotients would have been rounded to integer numbers. You can try and see for yourself!
The first time you edited the calculator, you set the field Remove to N for every row in the calculator grid. By doing this, you could preview every field created in the calculator, even the auxiliary ones such as the fields twenty, aux1, and aux2. You then changed the field to Y so that the auxiliary fields didn't pass to the next step.
After doing the calculations, you sorted the data by using a Sort rows step. You specified the order by avg descending, then by student_code ascending.
Tip
Sorting data
For small datasets, the sorting algorithm runs mainly using the JVM memory. When the number of rows exceeds 5,000, it works differently. Every five thousand rows, the process sorts them and writes them to a temporary file. When there are no more rows, it does a merge sort on all those files and gives you back the sorted dataset. You can conclude that for huge datasets a lot of reading and writing operations are done on your disk, which slows down the whole transformation. Fortunately, you can change the number of rows in memory (5,000 by default) by setting a new value in the Sort size (rows in memory) textbox. The bigger this number, the faster the sorting process.
Note that a sort size that works in your system may not work in a machine with a different configuration. To avoid that risk, you can use a different approach. In the Sort rows configuration window, you can set a Free memory threshold (in %) value. The process begins to use temporary files when the percentage of available memory drops below the indicated threshold. The lower the percentage, the faster the process.
Tip
As it's not possible to know the exact amount of free memory, it's not recommended to set a very small free memory threshold. You definitely shouldn't use that option in complex transformations or when there is more than one sort going on, as you could still run out of memory.
The two final steps were added to keep only the fields of interest, and to preview the result of the transformation. You can change the Dummy step for any of the output steps you already know.
Tip
You've used the Dummy step several times but still nothing has been said about it. Mainly it was because it does nothing! However, you can use it as a placeholder for testing purposes as in the last exercise.
Note that in this tutorial you used the Select values step in three different ways:
- To remove fields by using the Remove tab.
- To change the meta-data of some fields by using the Meta-data tab.
- To select and rename fields by using the Select tab.
Besides calculation, in this tutorial you did something you hadn't before—searching the step tree.
Tip
When you don't remember where a step is in the steps tree, or when you just want to find if there is a step that does some kind of operation, you could simply type the search criterion in the textbox above the steps tree. PDI does a search and filters all the steps that have that text as part of their name or description.
In this tutorial you used the Calculator step to create new fields and add them to your dataset. The Calculator is one the many steps that PDI has to create new fields by combining existent ones. Usually you will find these steps under the Transform category of the steps tree. The following table describes some of them (the examples refer to the examination file):
|
Step |
Description |
Example |
|---|---|---|
|
Split Fields |
Split a single field into two or more. You have to give the character that acts as separator. |
Split the |
|
Add constants |
Add one or more constants to the input rows |
Add two constants: |
|
Replace in string |
Replace all occurrences of a text in a string field with another text |
Replace the - in the student code by a |
|
Number range |
Create a new field based on ranges of values. Applies to a numeric field. |
Create a new field called |
|
Value Mapper |
Creates a correspondence between the values of a field and a new set of values. |
Suppose you calculated the average grade as an integer number ranging from 0 to 5. You can map the average to Old value: Old value: Old value: Old value: |
|
User Defined Java Expression |
Creates a new field by using a Java expression that involves one or more fields. This step may eventually replace any of the above but it's only recommended for those familiar with Java. |
Create a flag (a Boolean field) that tells if a student passed. A student passes if his/her average grade is above The expression to use could be: |
Any of these steps when added to your transformation, are executed for every row in the stream. It takes the row, identifies the fields needed to do its tasks, calculates the new field(s), and adds it to the dataset.
For details on a particular step, don't hesitate to visit the Wiki page for steps: http://wiki.pentaho.com/display/EAI/Pentaho+Data+Integration+v3.2.+Steps
The Calculator step you used in the tutorial, allows you to do simple calculations not only on numeric fields, but also on data and text. The Calculator step is not the only means to do calculations, but it is the simplest. It allows you to do simple calculations in a quick fashion.
The step has a grid where you can add all the fields you want to. Every row represents an operation that involves from one up to three operands (depending on the selected operation). When you select an operation, the description of the operation itself tells you which argument it needs. For example:
- If you select Set constant field to value A, you have to provide a constant value under the column name A.
- If you select A/B, the operation needs two arguments, and you have to provide them by indicating the fields to use in the columns named A and B respectively.
The result of every operation becomes a new field in your dataset, unless you set the Remove column to Y. The name of the new field is the one you type under the New field column.
For each and every row of the data set, the operations defined in the Calculator are calculated in the order in which they appear. Therefore, you may create auxiliary fields and then use them in rows of the Calculator grid that are below them. That is what you did in the tutorial when you defined the auxiliary fields aux1 and aux2 and then used them in the field total.
Just like every grid in Kettle, you have a contextual menu (and its corresponding shortcuts) that lets you manipulate the rows by deleting, moving, copying and pasting, and so on.