
Let's forget the examinations for a while, and retake the World Cup tutorial from the previous chapter. The file you obtained from that tutorial was a list of results of football matches. These are sample rows of the final file:
Match Date;Home Team;Away Team;Result
02/06;Italy;France;2-1
02/06;Argentina;Hungary;2-1
06/06;Italy;Hungary;3-1
06/06;Argentina;France;2-1
10/06;France;Hungary;3-1
10/06;Italy;Argentina;1-0
...
Now you want to take that information to obtain some statistics such as the maximum number of goals per match in a given day. To do it, follow these instructions:
- Create a new transformation, give it a name and description, and save it.
- By using a Text file input step, read the
wcup_first_round.txtfile you generated in Chapter 2. Give the name and location of the file, check the Content tab to see that everything matches your file, and fill the Fields tab. - Do a preview just to confirm that the step is well configured.
- From the Transform category of step, select a Split Fields step, drag it to the work area, and create a hop from the Text file input to this step.
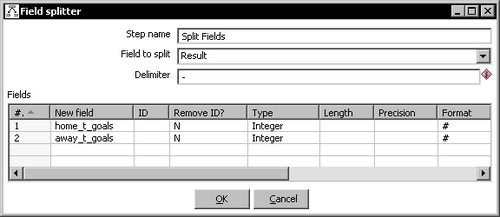
- Double-click the Split Fields steps and fill the grid like done in the following screenshot:
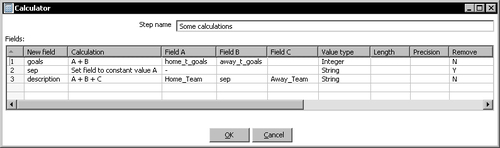
- Add a Calculator step to the transformation and create a hop from the Split Fields step to this step and edit the step to create the following new fields:
- Add a Sort rows step to the transformation, create a hop from the Calculator step to this step, and sort the fields by
Match_Date. - Expand the Statistics category of steps, and drag a Group by step to the canvas. Create a hop from the Sort rows step to this new step.
- Edit the Group by step and fill the configuration window as shown next:

- When you click the OK button, a window appears to warn you that this step needs the input to be sorted on the specified keys—the
Rangefield in this case. Click I understand, and don't worry because you already sorted the data in the previous step. - Add a final Dummy step.
- Select the Dummy and the Group by steps, left-click one and holding down the Shift key, left-click the other.
- Click the Preview this transformation button. You will see the the following:
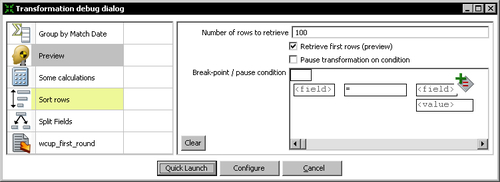
- Click Quick Launch. The following window appears:
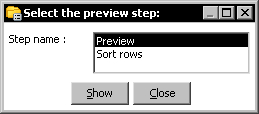
- Double-click the Sort rows step. A window appears with the data coming out of the Sort rows step.
- Double-click the Dummy step. A window appears with the data coming out of the Dummy step.
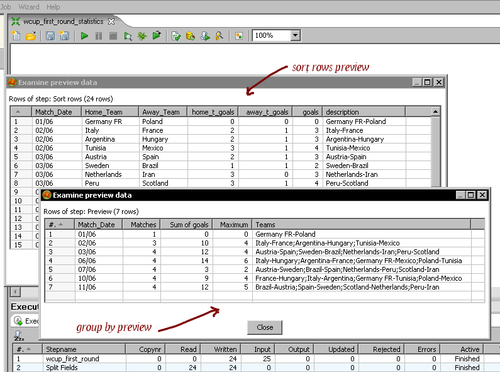
- If you rearrange the preview windows, you can see both preview windows at a time, and understand better what happened with the numbers. The following would be the data shown in the windows:
You opened a file with results from several matches and got some statistics from it.
In the file, there was a column with the match result in the format n-m, with n being the goals of the home team and m being the goals of the away team. With the Split Fields step, you split this field in two—one with each of these two numbers.
With the Calculator you did two things:
- You created a new field with the total number of goals for each match.
- You created a description for the match.
Note
Note that in order to create a description, you used the
+operator to concatenate string rather than add numbers.After that, you ordered the data by match date with a Sort rows step.
In the preview window of the Sort rows step, you could see all the calculated fields: home team goals, away team goals, match goals, and description.
Finally, you did some statistical calculations:
- First, you grouped the rows by match date. You did this by typing
Match_Datein the upper grid of the Group by step. - Then, for every match date, you calculated some statistics. You did the calculations by adding rows in the lower grid of the step, one for every statistic you needed.
Let's see how it works. Because the Group by step was preceded by a Sort rows step, the rows came to the step already ordered. When the rows arrive to the Group by step, Kettle creates groups based on the field(s) indicated in the upper grid—the Match_Date field in this case. The following drawing shows this idea:
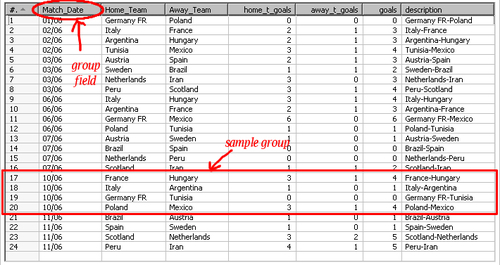
Then, for every group, the fields that you put in the lower grid are calculated. Let's see, for example, the group for the match date 03/06. For the rows in this group, Kettle calculated the following:
- Matches: The number of matches played on
03/06. There were4. - Sum of goals: The total number of goals converted on
03/06. There were 3+2+3+4=12. - Maximum: The maximum number of goals converted in a single match played on 03/06. The maximum among 3, 2, 3, and 4 was 4.
- Teams: The descriptions of the teams which played on 03/06, separated by
; : Austria-Spain; Sweden-Brazil; Netherlands-Iran; Peru-Scotland.
The same calculations were made for every group. You can verify the details by looking in the preview window.
Look at the Step Metrics tab in the Execution Results area of the screen:
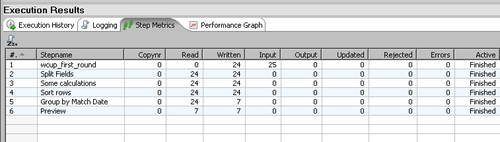
Note that 24 rows entered the Group by step and only 7 came out of that step towards the Dummy step. That is because after the grouping, you no longer have the detail of matches. The output of the Group by step is your new data now—one row for every group created.
The Group by step allows you to create groups of rows and calculate new fields over those groups.
In order to define the groups, you have to specify which field(s) are the keys. For every combination of values for those fields, Kettle builds a new group.
In the tutorial you grouped by a single field Match_date. Then for every value of Match_date, Kettle created a different group.
The Group by step operates on consecutive rows. Suppose that the rows are already sorted by date, but those with date 10/06 are above the rest. The step traverses the dataset and each time the value for any of the grouping field changes, it creates a new group. If you see it this way, you will notice that the step will work even if the data is not sorted by the grouping field.
Note
As you probably don't know how the data is ordered, it is safer and recommended that you sort the data by using a Sort rows step just before using a Group by step.
Once you have defined the groups, you are free to specify new fields to be calculated for every group. Every new field is defined as an aggregate function over some of the existent fields.
Let's review some of the fields you created in the tutorial:
- The
Matchesfield is the result of applying theNumber of valuesfunction over the fieldMatch_date. - The
Sum of goalsfield is the result of applying theSumfunction over the fieldgoals. - The
Maximumfield is the result of applying theMaximumfunction over the fieldgoals.
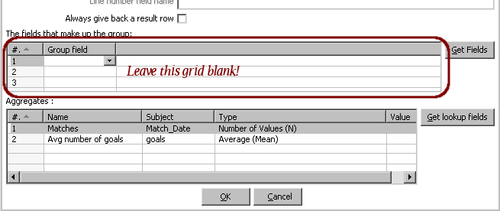
Finally, you have the option to calculate aggregate functions over the whole dataset. You do this by leaving the upper grid blank. Following the same example, you could calculate the total number of matches and the average number of goals for all those matches. This is how you do it:
The following is what you get:
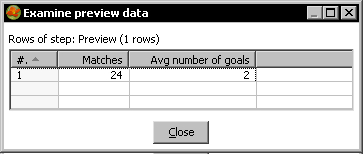
In any case, as a result of the Group by step, you will no longer have the detailed rows, unless you check the Include all rows? checkbox.
Here you have one more task related with the examinations file. Create a new transformation, read the file, and calculate:
- The number of students who passed
- The number of students who failed
- The average writing, reading, speaking, and listening grade obtained by students who passed
- The average writing, reading, speaking, and listening grade obtained by students who failed
- The minimum and maximum average grade among students who passed
- The minimum and maximum average grade among students who failed
Read the file with countries' information you used in Chapter 2. Build a file where each row has two columns—the name of a country and the list of spoken languages in that country.