Let's work now with the contest file from Chapter 5. You will need the output file for the Hero exercise. Fill gaps in the contest file from that chapter. If you don't have it, you can download it from the Packt website.
In this tutorial, we will calculate the total score for each performance by country.
- Create a new transformation.
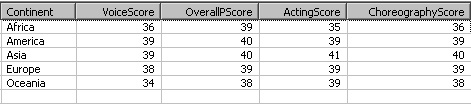
- Read the file with a Text file input step and do a preview to see that the step is well configured. You should see this:
- With a Select values step, keep only the following columns:
Country, Performance, andtotalScore. - With a Sort Rows step sort the data by
Countryascendant. - After the Sort Rows step, put a Row denormalizer step.
- Double-click this last step to configure it.
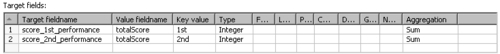
- As the key field put
Performance, and as group fields putCountry. - Fill the target fields' grid like shown:
- Close the window.
- With the Row denormalizer step selected, do a preview. You will see this:
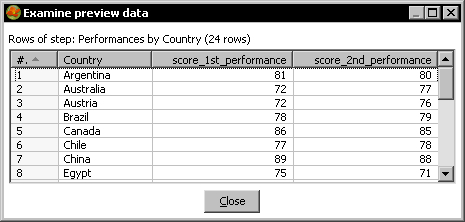
You read the contest file, grouped the data by country, and then created a new column for every performance. As values for those new fields you put the sum of the scores by performance and by country.
The purpose for which you used the Row denormaliser step in this tutorial was different from the purpose in the previous tutorial. In this case, you put the countries in rows, the performances in columns, and in the cells you put sums. The final dataset was kind of a cross tab like those you create with the DataPilot tool in Open Office, or the Pivot in Excel. The big difference is that here the final dataset is not interactive because, in essence, PDI is not. Another difference is that here you have to know the names or elements for the columns in advance.
Let's explain how the Row denormalizer step works in these cases. Basically, the way it works is quite the same as before:
The step groups the rows by the grouping fields and creates a new output row for each group.
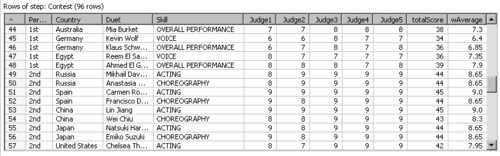
The novelty here is the aggregation of values. When more than one row in the group matches the value for the key field, PDI calculates the new output field as the result of applying an aggregate function to all the values. The aggregate functions available are the same you already saw when you learned the Group by step—sum, minimum, first value, and so on. Take a look at the following sample rows:
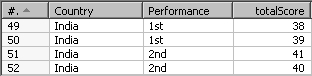
The first two rows had 1st as the value for the key field Performance. According to the rule of the Row denormaliser step, the values for the field totalScore of these two rows go to the new target field score_1st_performance. As the rule applies for two rows, the values for those rows have to be added, as Sum was the selected aggregation function.
So, the output data for this sample group is this:
The value for the new field score_1st_performance is 77 and is the sum of 38 and 39, the values of the field totalScore for the input rows where Performance was "1st."
Note
Please note the difference between the Row denormaliser and the Group by step for aggregating. With the Row denormaliser step, you generate another new field for each interesting key value. Using the Group by step for the tutorial, you couldn't have created the two columns shown in the preceding screenshot—score_1st_performance and score_2nd_performance.