In this tutorial we will create a simple dataset for a time dimension.
First we will create a stream with the days of the week:
- Create a new transformation.
- Press Ctrl+T to access the Transformation settings window.
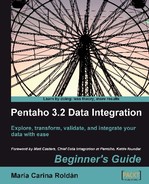
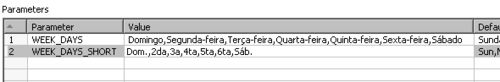
- Select the Parameters tab and fill it like shown in the next screenshot:
- Expand the Job category of steps.
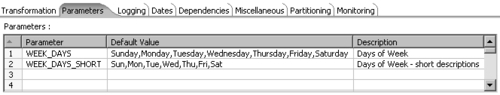
- Drag a Get Variables step to the canvas, double-click the step, and fill the window like here:
- After the Get Variables step, add a Split Fields step and use it to split the field
week_daysinto sevenStringfields namedsun, mon, tue, wed, thu, fri, andsat. As Delimiter, set a comma (,). - Add one more Split Fields step and use it to split the field
week_days_shortinto sevenStringfields namedsun_sh, mon_sh, tue_sh, wed_sh, thu_sh, fri_sh, andsat_sh. As Delimiter, set a comma (,). - After this last step, add a Row Normalizer step.
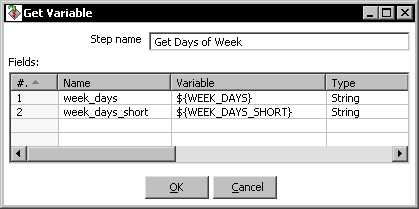
- Double-click the Row Normalizer step and fill it as follows:
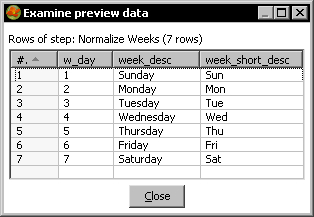
- Keep the Row Normalizer step selected and do a preview. You will see this:
Now let's build the main stream:
- Drag a Generate Rows step, an Add sequence step, a Calculator step, and a Filter rows step to the canvas.
- Link them so you get this:

- Double-click the Generate Rows step and use it to generate
45000lines. Add a singleDatefield namedfirst_day. As Format selectyyyyMMddand as Value write19000101. - Double-click the Add sequence step. In the Name of value textbox, type
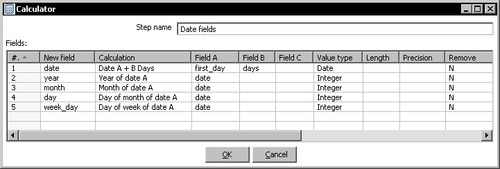
days. - Double-click the Calculator step and fill the window as shown next:
- Double-click the Filter rows step and add the filter
date <= 31/12/2020. When you enter the date31/12/2020, make sure to set the Type toDateand the Conversion format todd/MM/yyyy. After the Filter rows step add a Stream lookup step. - Create two hops—one from the Filter rows step to the Stream lookup step and the other from the Row Normalizer step to the Stream lookup step.
- Double-click the Stream lookup step. In the upper grid add a row, setting
week_dayunder the Field column andw_dayunder the LookupField column. Use the lower grid to retrieve the String fieldsweek_descandweek_short_desc. Finally, after the Stream lookup step, add a Select values step. - Use the Select values step to remove the unused fields
first_dayanddays. Create a hop from the Stream lookup step to this step. - With the Select values step selected, click the preview button.
- When the preview window appears click on Configure.
- Fill the column value in the Parameters grid of the transformation execution window as follows:
- Click the Launch button. You will see this:
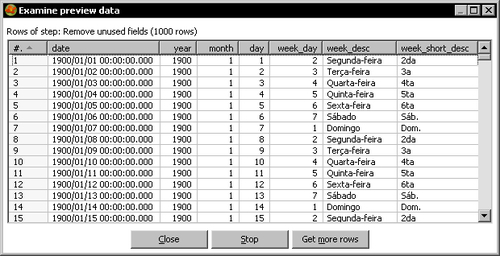
You generated data for a time dimension with dates ranging from 01/01/1900 through 31/12/2020. Time dimensions are meant to answer questions related with time such as: Do I sell more on Mondays or on Fridays? Am I selling more this quarter than the same quarter last year? The list of attributes you need to include in your time dimension depends on the kind of question you want to answer. Typical fields in a time dimension include: year, month (a number between 1 and 12), description of month, day of month, week day, and quarter.
In the tutorial you created a few attributes, but you could have added much more. Among the attributes included you had the week day. The week descriptions were taken from named parameters, which allowed you to set the language of the week descriptions at the time you ran the transformation. In the tutorial you specified Portuguese descriptions. If you had left the parameters grid empty, the transformation would have used the English descriptions that you put as default.
Let's explain how you build the stream with the number and descriptions for the days of the week. First, you created a dataset by getting the variables with the descriptions for the days of the week. After creating the dataset, you split the descriptions and by using the Row Normalize step, you converted that row into a list of rows, one for every day of the week. In other words, you created a single row with all the descriptions for the days of the week. Then you normalized it to create the list of days.
Note
This method used for creating the list of days of a week is very useful when you have to create a very small dataset. It avoids the creation of external files to hold that data.
The transformation you created was inspired by the sample transformation General - Populate date dimension.ktr found in the samples/transformations folder inside the PDI installation folder. You can take a look at that transformation. It builds the dataset in a slightly different way, also by using Row Normalizer steps.
To create the secondary stream of the tutorial, you used a Get Variables step. The Get Variables step allows you to get the value of one or more variables. In this tutorial you read two variables that had been defined as named parameters.
When put as the first step of a stream like in this case, this step creates a dataset with one single row and as many fields as read variables.
The following is the dataset created by the Get Variables step in the time dimension tutorial:

When put in the middle of a stream, this step adds to the incoming dataset, as many fields as the number of variables it reads. Let's see how it works.