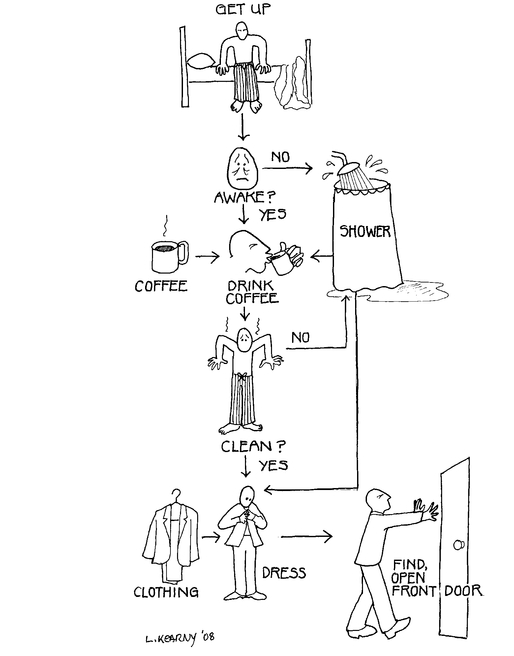
MAPS: MAKING IT VISIBLE
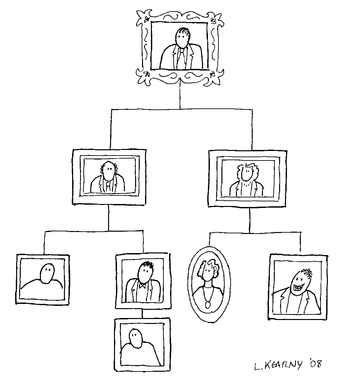
Before traveling to new lands, it is helpful to view a map of the area we will visit. Maps are visual representations that can show interrelationships and help us navigate the who, what, where, why, and how and of the enterprise. The functional organization chart (see Figure 3.1) is the most familiar organization map. It shows us the “who” and the reporting relationships. However, the map shows nothing of where the power is in the organization and it leaves out the customer.
FIGURE 3.1. Organization Chart.
It is not until we refine our maps that we begin to know how the enterprise looks. In this section, we will share some maps that have helped us learn the lay of the land in organizations. For detectives, maps offer clues to performance issues and for architects they help in the design of new processes and suggest new practices. The first map we will look at is a culture map.
Culture Map
A culture map is a view of the key elements of an organization’s social system. This is valuable information for performance improvement sleuths because culture is at the core of all social systems (Gharajedaghi, 1999, p. 16). Culture maps depict the organization, what the enterprise looks like, and we can start to make out the organizational landscape. A culture map clarifies the visible landmarks and helps less clear areas become evident. A full culture map will look at both the operational and cultural sides of an organization. The cultural elements are shown in Table 3.1. (See Chapter 4: The Workplace: Organization Level for the operational side.)
TABLE 3.1. Elements of a Culture Map.
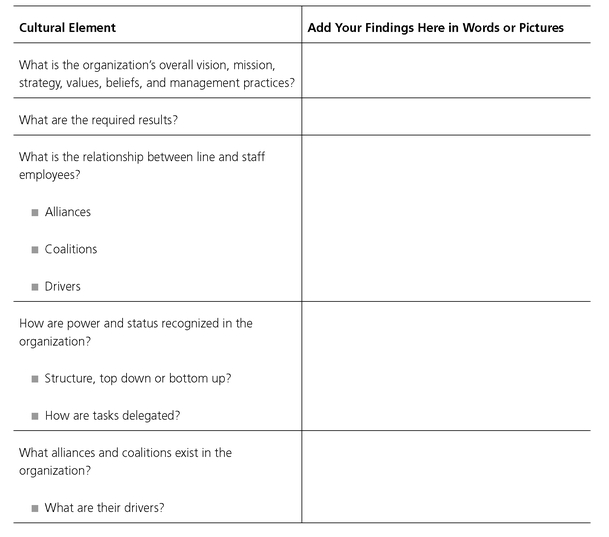
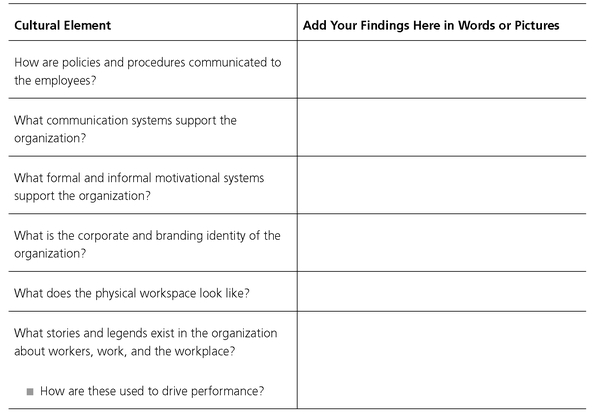
For best results, have an external consultant work with internal performance improvement staff when they gather the information to complete a culture map. The power of this map is to present a view of the landscape, show relationships, and to enable the performance practitioner to see how things are done. In Chapter 4: The Workplace: Organization Level, we explore a subset of organizational culture, its political side, and the relationship between power and influence.
To sum it up, “Like organizational practices, cultural practices are the product of culture selection. That is, practices are more likely to endure if they contribute to the survival of the group (or the customer’s organization) through cost-effective production of essential materials goods or services” (Malott, 2003, p. 29).
Flowcharts
In 1921, Frank Gilbreth introduced us to the flow process chart. His charts were the first attempts to find the most efficient way to complete a task. A flowchart is a picture or diagram that represents the elements of a process. Some of Gilbreth’s best-known work involved bricklaying. By paying close attention to the work of a bricklayer, Gilbreth was able to reduce the number of steps required to lay bricks from eighteen to five, increasing productivity and decreasing fatigue.
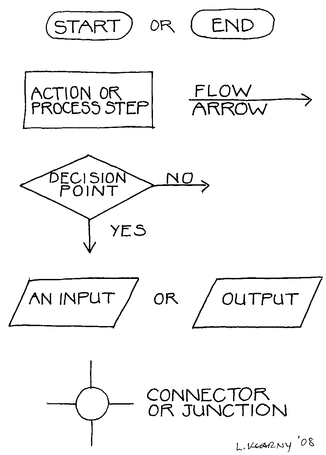
Flowcharts help us visualize work processes and make it easier to spot flaws. Flowcharts help us streamline work. To make the process clear, a series of standard symbols (shown in Figure 3.2) is used in flowcharts.
FIGURE 3.2. Flowchart Symbols.
To develop a flowchart:
• Gather information on the flow of the process through observation, asking questions, and experience (See the first section of this chapter and Chapter 2: The Worker: Individual/Team Level for more about observation)
• Develop a draft of the flow process
• Review the process with an expert
• Make changes if necessary
• Complete the final flowchart
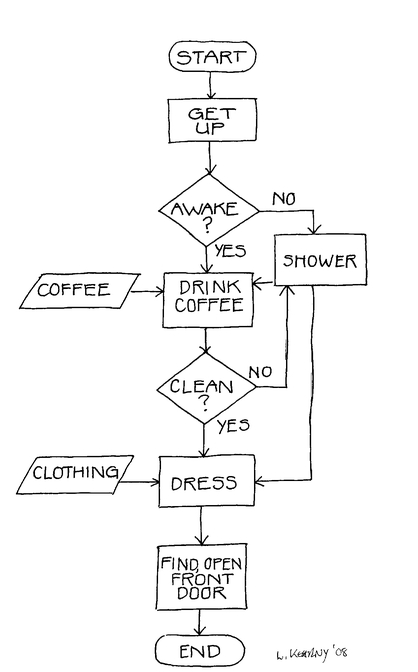
A sample of a simple flowchart is shown in Figure 3.3.
FIGURE 3.3. Simple Flowchart.
There are many tools on the market that will assist you in developing flowcharts. The reference tools in Microsoft Office have a set of symbols you can use to develop your charts. You can draw flowcharts in Word and PowerPoint (http://office.microsoft.com/en-us/word/HA010552661033.aspx). Amazon.com has over three hundred resources on flowcharts, and there are a number of software programs you can use to develop flowcharts. Some sites to visit are:
• Mind Tools: http://www.mindtools.com
• RFFlow: http://www.rff.com
• SmartDraw: http://www.smartdraw.com
• Systems2win: http://systems2win.com
• OmniGraffle: http://www.omnigroup.com/applications/OmniGraffle
Time and Motion Workflow
Time and motion workflow combines the work of Frederick Taylor and Frank and Lillian Gilbreth. The purpose was to study the time it took to complete a task and the number and type of motions used to increase productivity. We were introduced to this approach several years ago when we were trying to increase business efficiencies in a company. We mapped out some of the basic jobs using a workflow chart. We were interested in how we could save time and streamline specific tasks. We collected time and motion workflow information using a generic workflow chart like the one in Figure 3.5.
FIGURE 3.5. Workflow Chart.
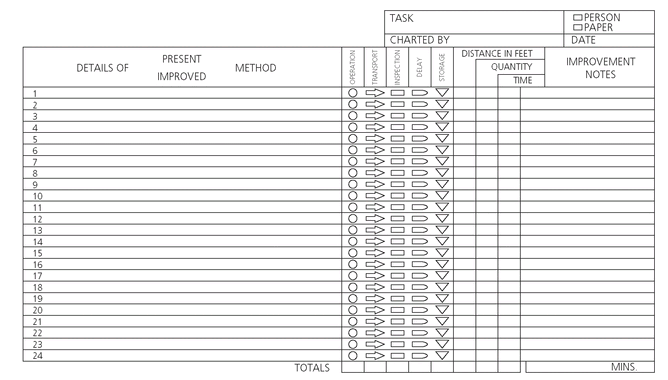
To complete a workflow chart:
1. Identify the workflow to be charted.
2. State whether you are observing a person performing the work or the work being processed on paper or by computer. Tip: Record the observation steps for a person on a one workflow chart and the steps for a process on a separate workflow chart.
3. Indicate whether you are documenting the current or an improved method.
4. Describe each step of the process. Tip: Use the active voice to describe a person doing the job, for example, “Mary Ann lifts the dish.” Use the passive voice to describe a paper or data entry, for example, “The insurance document is filed.”
5. Classify each step as follows:
• Operation: Work is accomplished, information is given or received.
• Transportation: Something is moved, usually more than three feet.
• Inspection: Something is read, reviewed, examined, or confirmed.
• Delay: Record if wait time is longer than thirty minutes.
• Storage: Something is filed, stored, removed.
6. Enter the distance in feet the worker or object (paper) moves.
7. Enter the quantity; the amount being processed.
8. Enter the time, in seconds, required to complete each step.
9. Identify any possible improvements in the step.
10. Motion: Total the number of times each symbol appears, to assist you when you compare the current and improved process.
11. Time: Total the time (seconds) and divide by 60 to find total minutes.
The purpose of a workflow chart is to make the process used visible and to discover how much time it takes to complete the task. We can then see what we need to change, eliminate, or do differently. As with many tools, the workflow chart has its limitations. It follows either tasks or paper; however, it does not give a complete picture of the process in the context of other functions that may contribute to the successful completion of the total process.
Swim Lanes
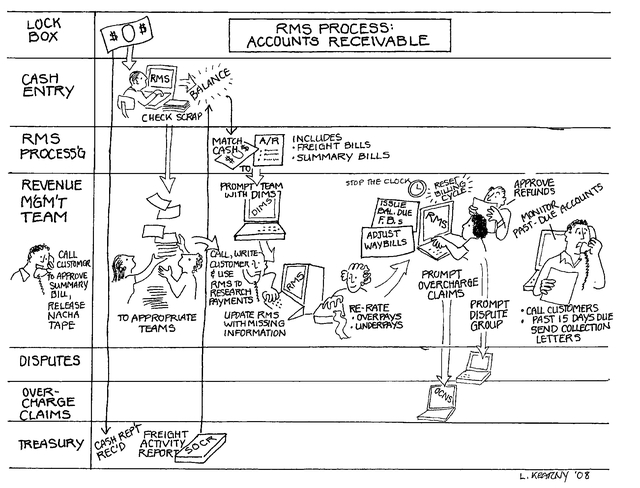
One of the most useful tools for making processes visible is the “swim lane” flow diagram. Swim lane diagrams are arranged so that processes and decisions are grouped and then placed in lanes, one lane for each person, team, sub-process, or function. These charts show the interactions of all processes within the system. They are useful for tracking processes across an organization, letting us see business processes that involve more than one function or department. Swim lane diagrams let us know who is responsible for the steps in the process and help us spot the delay points and bottlenecks, as well as how long steps take and where mistakes are most likely to occur. An example is shown in Figure 3.6.
FIGURE 3.6. Sample Swim Lane Diagram.
Day in the Life
For thousand of years, storytelling has been part of the human experience. “Once upon a time in a land far, far way” is familiar to many of us. In his book, The Hero with a Thousand Faces, Joseph Campbell illustrates the basic ingredients of stories and myths across culture and time, providing a useful backdrop for the value of stories in organizations (Campbell, 1972).
The day in the life approach is a way to tell stories about the workers, work, and workplace. This type of story illustrates what we do and how we to it and is relevant in today’s organizations. “The ability to encapsulate, contextualize, and emotionalize has become vastly important in the Conceptual Age” (Pink, 2005, p. 102).
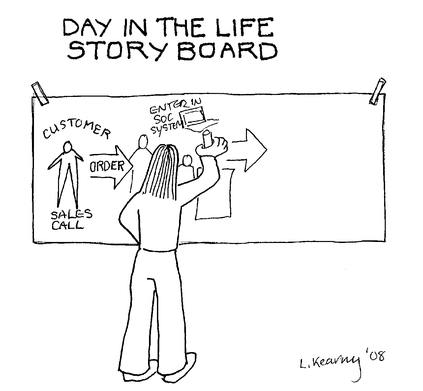
The first step in creating a day in the life is to develop a storyboard, a series of graphics, illustrations, and images used to display the sequence of a story—like an outline in pictures. The day in the life storyboard takes a timeframe and tells us what it is like from the vantage point of the people doing the work. It not only shows the things they do, but also tells a story about how they feel as they perform the task; the interactions, the environment, the context, the look and the feel of the work. Figure 3.7 shows someone creating a day in the life storyboard.
FIGURE 3.7. Day in the Life.
..................Content has been hidden....................
You can't read the all page of ebook, please click here login for view all page.

