
Chapter 3
Exploring Your Data Types and Associated Techniques
IN THIS CHAPTER
Understanding your data, its types, and its categories
Capturing the driving forces
Connecting predictive analytics to statistics, data mining, and machine learning
In this information age, data is being accumulated at such a rapid pace that it can be overwhelming. That data is usually stored in a database, or scattered across documents, e-mails, and text or audiovisual files.
Knowing your data types — whether attitudinal or behavioral, structured or unstructured, static or streamed — will position you to have a deeper and broader understanding of your data. Learning how to categorize your data can bring you the rest of the way to that deeper understanding — which in turn can facilitate your predictive analytics efforts.
The handiest way to define those efforts is in terms of the tools they use: Predictive analytics is an approach to business data that uses the techniques, tools, and algorithms of three disciplines — data mining, statistics, and machine learning — to develop a predictive model. This chapter covers these disciplines, but first it explores data types. When carefully built, that model can help decision-makers spot trends and patterns that represent enhanced business opportunities. Understanding the connection between predictive analytics and the three disciplines that provide its primary tools will strengthen your analysis.
There are two major ways to implement predictive analytics:
- Data-driven: This approach is based solely on your data.
- User-driven: This approach explores ideas you have — say, for example, about your customers and their behavior — and examines whether your data supports those ideas.
Recognizing Your Data Types
If your company is like most others, you've gathered a large amount of data through the years — simply as a result of operating a business. Some of this data can be found in your databases; some may be scattered across hard drives on your company's computers or in its online content.
Your raw data may consist of presentations, individual text files, images, audio and video files, and e-mails — for openers.
 The sheer amount of this data can be overwhelming. When you categorize it, however, you create the core of any predictive analytics effort. The more you learn about your data, the better able you are to analyze and use it. You can start by getting a good working knowledge of your data types — in particular, structured versus unstructured data, and streamed versus static data. The upcoming sections give you a closer look at these data types.
Structured and unstructured data
Data contained in databases, documents, e-mails, and other data files can be categorized either as structured or unstructured data.
Structured data is well organized, follows a consistent order, is relatively easy to search and query, and can be readily accessed and understood by a person or a computer program.
A classic example of structured data is an Excel spreadsheet with labeled columns. Such structured data is consistent; column headers — usually brief, accurate descriptions of the content in each column — tell you exactly what kind of content to expect. In a column labeled e-mail address, for example, you can count on finding a list of (no surprise here) e-mail addresses. Such overt consistency makes structured data amenable to automated data management.
Structured data is usually stored in well-defined schemas such as databases. It's usually tabular, with columns and rows that clearly define its attributes.
Unstructured data, on the other hand, tends to be free-form, non-tabular, dispersed, and not easily retrievable; such data requires deliberate intervention to make sense of it. Miscellaneous e-mails, documents, web pages, and files (whether text, audio, and/or video) in scattered locations are examples of unstructured data.
It's hard to categorize the content of unstructured data. It tends to be mostly text, it's usually created in a hodgepodge of free-form styles, and finding any attributes you can use to describe or group it is no small task.
The content of unstructured data is hard to work with or make sense of programmatically. Computer programs can't analyze or generate reports on such data directly without processing, simply because it lacks structure, has no underlying dominant characteristic, and individual items of data have no common ground. However, now there are more technologies and new tools that can make sense of unstructured data.
In general, there's a higher percentage of unstructured data than structured data in the world. Unstructured data requires more work to make it useful, so it gets more attention — thus tends to consume more time. No wonder the promise of a processing capability that can swiftly make sense of huge bodies of unstructured data is a major selling point for predictive analytics.
 Don't underestimate the importance of structured data and the power it brings to your analysis. It's far more efficient to analyze structured data than to analyze unstructured data. Unstructured data can also be costly to preprocess for analysis as you're building a predictive analytics project. The selection of relevant data, its cleansing, and subsequent transformations can be lengthy and tedious. The resultant newly organized data from those necessary preprocessing steps can then be used in a predictive analytics model. The wholesale transformation of unstructured data however, may have to wait until you have your predictive analytics model up and running.
It might be more rewarding to quickly get full value from your structured data than worry too soon about processing unstructured data and risk further delays to your projects.
Tagging documents and text analytics are two approaches to structuring text documents, linking their contents, grouping and summarizing their data, and uncovering patterns in that data. Both disciplines provide a rich framework of algorithms and techniques to mine the text scattered across a sea of documents.
It's also worth noting that search engine platforms provide readily available tools for indexing data and making it searchable.
Table 3-1 compares structured and unstructured data.
TABLE 3-1 Characteristics of Structured and Structured Data
Characteristics |
Structured |
Unstructured |
Association |
Organized |
Scattered and dispersed |
Appearance |
Formally defined |
Free-form |
Accessibility |
Easy to access and query |
Hard to access and query |
Availability |
Percentagewise lower |
Percentagewise higher |
Analysis |
Efficient to analyze |
Additional preprocessing is needed |
Unstructured data doesn't completely lack structure — you just have to ferret it out. Even the text inside digital files still has some structure associated with it, often showing up in the metadata — for example, document titles, dates the files were last modified, and their authors' names. The same thing applies for e-mails: The contents may be unstructured, but structured data is associated with them — for example, the date and time they were sent, the names of their senders and recipients, whether they contain attachments.
It may be worthwhile to conduct a preliminary analysis on the structured components of your data to estimate the potential value of a full analysis of the overall unstructured data. When the analysis yields little, that should be weighed in determining resources you will allocate to that portion of the unstructured data.
The idea here is that you can still find some order you can use while you're going through all that “unstructured data”. Of course, you may have to do some digging. The content of a thread of 25 e-mails shooting back and forth between two recipients may wander away from the subject line of the first original e-mail, even when the subject line stays the same. Additionally, the very first subject line in that e-mail thread may not accurately reflect even the content of that very first e-mail. (For example, the subject line may say something as unhelpful as “Hi, there!”)
The separation line between the two data types isn't always clear. In general, you can always find some attributes of unstructured data that can be considered structured data. Whether that structure is reflective of the content of that data — or useful in data analysis — is unclear at best. For that matter, structured data can hold unstructured data within it. In a web form, for example, users may be asked to give feedback on a product by choosing an answer from multiple choices — but also presented with a comment box where they can provide additional feedback. The answers from multiple choices are structured; the comment field is unstructured because of its free-form nature. Such cases are best understood as a mix of structured and unstructured data. Most data is a composite of both.
Technically speaking, there will always be some exceptions in defining data categories; the lines between the two can be blurry. But the idea is to make a useful distinction between structured and unstructured data — and that is almost always possible.
For a successful predictive analytics project, both your structured and unstructured data must be combined in a logical format that can be analyzed.
One of the authors once found himself with a few folders, each holding hundreds of PDF files. To save time, instead of looking at each file to try to understand its content, he used a few lines of programming and a free software tool to get a quick idea of the data contained in those files:
- A few lines of Java allowed him to open the files, extract the embedded text, and save that content into a new text file in a separate folder.
He fired up RapidMiner Studio and used its text processing package to gain some insights.
Using “Process Documents” (from the Files operator), he specified the path to my text files, the document types to process, and the type of vector to create (TF, TF-IDF, and others).
 TF stands for term frequency (the count of words across the documents). TF-IDF is the term frequency inverse document frequency. Some words are more frequent than others; as a weighing mechanism to gauge the relative importance of a word, its frequency is offset by the number of the documents where the word appears.
He defined text processing for those documents:
- A tokenizer operator chops the text into “tokens,” or individual words.
- A filter excludes English stop words (common words, such as “like”, “and”, and “the”).
- A filter eliminates one- and two-letter words.
- A filter operator transforms all words to lower case.
- A stemmer operator breaks words down to their stems or roots. For example, the words anticipate, anticipating, and anticipation are grouped under one root, anticipate.
These operators come in a friendly user interface. Figure 3-1 shows the user interface for the different operators described as they appear in RapidMiner Studio 6.4.
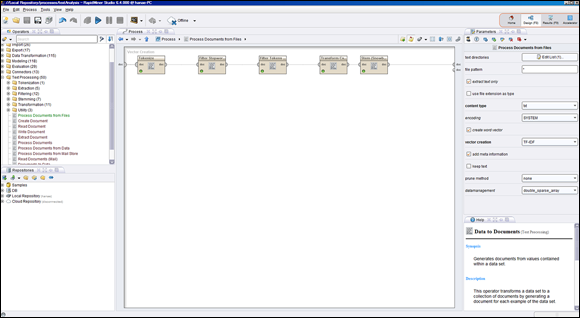
FIGURE 3-1: Text processing operators in RapidMiner Studio.
With a matter of minutes, he clicked “run,” and a data matrix was generated, consisting of all the words that fit the specified criteria. The various words were displayed in the rows of the matrix, and the columns showed total occurrences and the document occurrences. A quick sort on the occurrence column lists the most important words, or terms (a term consists of one word or more if you specify any to track) inside the universe of the documents. Just like that, a daunting task is rendered simple and quick insights of the pile unstructured data are gained. This type of analysis can help you identify terms that are most descriptive in a document, and it can come handy when you're trying to find the similarity between two documents. Of course, further and more complex analysis will need to take place later, but this gets you started.
These are the top words for the first edition of Predictive Analytics For Dummies: data, model, predictive, analytics, business, customer, cluster, and algorithm.
Static and streamed data
Data can also be identified as streamed, static, or a mix of the two. Streamed data changes continuously; examples include the constant stream of Facebook updates, tweets on Twitter, and the constantly changing stock prices while the market is still open.
Streamed data is continuously changing; static data is self-contained and enclosed. The problems associated with static data include gaps, outliers, or incorrect data, all of which may require some cleansing, preparation, and preprocessing before you can use static data for an analysis.
As with streamed data, other problems may arise. Volume can be a problem; the sheer amount of non-stop data constantly arriving can be overwhelming. And the faster the data is streaming in, the harder it is for the analysis to catch up.
The two main models for analyzing streamed data are as follows:
- Examine only the newest data points and make a decision about the state of the model and its next move. This approach is incremental — essentially building up a picture of the data as it arrives.
- Evaluate the entire dataset, or a subset of it, to make a decision each time new data points arrive. This approach is inclusive of more data points in the analysis — what constitutes the “entire” dataset changes every time new data is added.
Depending on the nature of your business and the anticipated impact of the decision, one model is preferable over the other.
Some business domains, such as the analysis of environmental, market, or intelligence data, prize new data that arrives in real time. All this data must be analyzed as it's being streamed — and interpreted not only correctly but right away. Based on the newly available information, the model redraws the whole internal representation of the outside world. Doing so provides you with the most up-to-date basis for a decision you may need to make and act upon quickly.
For example, a predictive analytics model may process a stock price as a data feed, even while the data is rapidly changing, analyze the data in the context of immediate market conditions existing in real time, and then decide whether to trade a particular stock.
Clearly, analyzing streamed data differs from analyzing static data. Analyzing a mix of both data types can be even more challenging.
Generally, the learning and the building of a model mostly is performed on static data. When that model is deployed to production, it will process streamed data. Even static data is constantly refreshed through regular updates; streamed data should be understood in light of its real-time aspect.
Identifying Data Categories
As a result of doing business, companies have gathered masses of data about their business and customers, often referred to as business intelligence. To help you develop categories for your data, what follows is a general rundown of the types of data that are considered business intelligence:
Behavioral data derives from transactions, and can be collected automatically:
- Items bought
- Methods of payment
- Whether the purchased items were on sale
- The purchasers' access information:
- Address
- Phone number
- E-mail address
All of us have provided such data when making a purchase online (or even when buying at a store or over the phone).
Other types of data can be collected from customers with their co-operation:
- Data provided by customers when they fill out surveys
- Customers' collected answers to polls via questionnaires
- Information collected from customers who make direct contact with companies
- In a physical store
- Over the phone
- Through the company website
In addition, the type of data that a business collects from its operations can provide information about its customers. Common examples include the amount of time that customers spend on company websites, as well as customers' browsing histories. All that data combined can be analyzed to answer some important questions:
- How can your business improve the customer experience?
- How can you retain existing customers and attract new ones?
- What would your customer base like to buy next?
- Which purchases can you recommend to particular customers?
The first step toward answering these questions (and many others) is to collect and use all customer-related operations data for a comprehensive analysis. The data types that make up such data can intersect and could be described and/or grouped differently for the purposes of analysis.
Some companies collect these types of data by giving customers personalized experiences. For example, when a business provides its customers with the tools they need to build personalized websites, it not only empowers customers (and enriches their experience of dealing with the company), it also allows the company to learn from a direct expression of its customers' wants and needs: the websites they create.
The ability to combine various types of data from different sources (usually for the first time) is one of the reasons that predictive analytics can yield insights and useful results.
Attitudinal data
Any information that can shed light on how customers think or feel is considered attitudinal data.
When companies put out surveys that ask their customers for feedback and their thoughts about their line of businesses and products, the collected data is an example of attitudinal data.
Attitudinal data has a direct impact on the type of marketing campaign a company can launch. It helps shape and target the message of that campaign. Attitudinal data can help make both the message and the products more relevant to the customers' needs and wants — allowing the business to serve existing customers better and attract prospective ones.
The limitation of attitudinal data is a certain imperfection: Not everyone objectively answers survey questions, and not everyone provides all the relevant details that shaped their thinking at the time of the survey.
Many customers use social media to express their opinions about a product, service, or company. Their opinions reflect their experiences and their interactions with the company. As a result, many companies are gathering that data, and applying various analyses to make sense of it. One popular technique is the application of sentiment analysis, (sometimes referred to as opinion mining). Facebook posts, or tweets, are analyzed to determine whether the attitude, mood, or opinion of their authors is negative, neutral, or positive. The result of that analysis can help companies improve their marketing strategies and offer better customer service.
It may be a challenge to find attitudinal data for everyone in your analysis, and it can also be difficult to match the customer transactional data with social media data. In general, linking various data sources, in a meaningful way, is a very hard task and can take time.
Behavioral data
Behavioral data derives from what customers do when they interact with the business; it consists mainly of data from sales transactions. Behavioral data tends to be more reliable than attitudinal data because it represents what actually happened.
Businesses know, for example, what products are selling, who is buying them, and how customers are paying for them.
Behavioral data is a by-product of normal operations, so is available to a company at no extra cost. Attitudinal data, on the other hand, requires conducting surveys or commissioning market research to get insights into the minds of the customers.
Attitudinal data is analyzed to understand why customers behave the way they do, and details their views of your company. Behavioral data tells you what is happening and records customers' real actions. Attitudinal data provides insight into motivations; behavioral data provides the who-did-what — the overall context that led to customers' particular reactions. Your analysis should include groups for both types of data; they are complementary.
Combining both attitudinal and behavioral data can make your predictive analytics models more accurate by helping you define the segments of your customer base, offer a more personalized customer experience, and identify the drivers behind the business.
Table 3-2 compares attitudinal and behavioral data.
TABLE 3-2 Comparing Attitudinal and Behavioral Data
Characteristics |
Attitudinal data |
Behavioral data |
Data Source |
Customers' thoughts |
Customers' actions |
Data Means |
Collected from surveys |
Collected from transactions |
Data Type |
Subjective |
Objective |
Data Cost |
May cost extra |
No extra cost |
Demographic data
Demographic data comprises information including age, race, marital status, education level, employment status, household income, and location. You can get demographic data from the U.S. Census Bureau, other government agencies, or through commercial entities.
The more data you have about your customers, the better the insight you'll have into identifying specific demographic and market trends as well as how they may affect your business. Measuring the pulse of the demographic trends will enable you to adjust to the changes and better market to, attract, and serve those segments.
Different segments of the population are interested in different products.
Small businesses catering to specific locations should pay attention to the demographic changes in those locations. All of us have witnessed populations changing over time in certain neighborhoods. Businesses must be aware of such changes; they may affect business significantly.
Demographic data, when combined with behavioral and attitudinal data, allows marketers to paint an accurate picture of their current and potential customers, allowing them to increase satisfaction, retention, and acquisition.
Demographic data is static data, so it's hard to use to predict a change of behavior when the underlying input variables aren't changing. Therefore, demographics data only is useful when combined with transactional data.
Generating Predictive Analytics
There are two ways to go about generating or implementing predictive analytics: purely on the basis of your data (with no prior knowledge of what you're after) or with a proposed business hypothesis that the data may or may not support. You don't have to choose one or the other; the two approaches can be complementary. Each has its advantages and disadvantages.
Whether you're coming up with hypotheses to test, analyzing the results that come out of your data analysis (and making sense of them), or starting to examine your data with no prior assumptions of what you may find, the goal of your analysis is always the same: to decide whether to act on what you find. You have an active role in implementing the process needed for either approach to predictive analytics. Both approaches to predictive analytics have their limitations; keep risk management in mind as you cross-examine their results. Which approach do you find to be both promising of good results and relatively safe?
Combining both types of analysis empowers your business and enables you to expand your understanding, insight, and awareness of your business and your customers. It makes your decision process smarter and subsequently more profitable.
Data-driven analytics
If you're basing your analysis purely on existing data, you can use internal data — accumulated by your company over the years — or external data (often purchased from a source outside your company) that is relevant to your line of business.
To make sense of that data, you can employ data-mining tools to overcome both its complexity and size; reveal some patterns you weren't aware of; uncover some associations and links within your data; and use your findings to generate new categorizations, new insights and new understanding. Data-driven analysis can even reveal a gem or two that can radically improve your business — all of which gives this approach an element of surprise that feeds on curiosity and builds anticipation.
Data-driven analysis is best suited for large datasets because it's hard for human beings to wrap their minds around huge amounts of data. Data-mining tools and visualization techniques help us get a closer look and cut the overwhelming mass of data down to size. Keep these general principles in mind:
- The more complete your data is, the better the outcome of data-driven analytics. If you have extensive data that has key information to the variables you're measuring, and spans an extended period of time, you're guaranteed to discover something new about your business.
- Data-driven analytics is neutral because
- No prior knowledge about the data is necessary.
- You aren't after a specific hypothesis. You're analyzing the data for the sake of it, or with a general goal in mind.
- The nature of this analysis is broad and it doesn't concern itself with a specific search or validation of a preconceived idea. This approach to analytics can be viewed as sort of random and broad data mining.
- If you conduct such data analysis, and if you learn something about your business from the analysis, you'll still need to decide whether the results you're getting are worth implementing or acting upon.
- Relying solely on data-driven analytics adds some risk to the resulting business decisions. You can, however, limit that risk by incorporating some of the realism that characterizes user-driven analytics (described in the next section). When real-world data proves (or at least supports) the correctness of your original ideas, then the appropriate decision is practically already made. When an informed hunch is validated by the data, the whole analysis shows itself as driven by strategic ideas that were worth pursuing and verifying.
The following story is very interesting. It's about the importance of having data help you decide instead of letting data be the sole driver for the decision-making process. Amazon and Netflix look at massive data in their quests to create the best, most entertaining show in the business. Based on these insights, Amazon created the show Alpha House, which did okay, while Netflix produced House of Cards, which generated tremendous success. What made the difference in the outcome for these two companies who rely on, and heavily use, data science in their daily operations? It turned out, as detailed by Sebastian Wernicke in his TED Talk (“How to use data to make a hit TV show”), that Netflix took the results from the data analysis to understand what their audience wants to watch, and then the team of experts who took the risk and made a decision to create a show they thought would fit that criteria. Amazon stuck to the data and data analysis in all aspects of the process, and managed to produce a show that their audience liked; the result was a successful show, but not a blockbuster.
Data can only help so much in the success of the decision-making process. At a certain point, management must make the best decision based on what they have learned from the data.
User-driven analytics
The user-driven approach to predictive analytics starts with you (or your managers) conceiving of ideas and then taking refuge in your data to see whether those ideas have merit, would stand testing, and are supported by the data.
The test data doesn't have to be big; it's something you define and choose as you deem relevant for testing your ideas.
The process of picking the right datasets and designing accurate testing methods — in fact, the whole process from inception to adoption — has to be guided by careful consideration and meticulous planning.
Selecting the variables with predictive power can be daunting and time consuming. Preparing your data is a crucial aspect of the predictive analytics process. Chapter 9 highlights the challenges, and provides guidance and tips to prepare your data; it also details algorithms that specialize in features selection and extraction.
User-driven analytics requires not only strategic thinking but also enough in-depth knowledge of the business domain to back up the hypothesis. Vision and intuition can be very helpful here; you're looking for how the data lends specific support to ideas you deemed important and strategic. This approach to predictive analytics is defined (and limited) by the scope of the ideas you're probing. Decision-making becomes easier when the data supports your ideas.
Relying only on user-driven analytics can cost you in terms of insight; you may miss the hidden connections that may lurk in your data. Your ideas may miss the subtle changes that have been occurring in your business over time — which can only come to light when you apply data-driven analytics to complete the picture.
In short, your ideas should also include an awareness of the unknowns that surround your business, and probe them by looking for interconnected variables in the many aspects of your business. This is hard to achieve but data-driven analysis can help. For example, you may analyze the importance of the cost of raw material you need to create your product, the demand for the product, and how the costs affect your price. But you may miss hidden and other correlated factors that have influence on the pricing — such as the state of the economy as a whole, the turnover rate of employees at your company, and subtle changes in how your product is being consumed.
 The process of probing your ideas may not be as straightforward as analyzing whole datasets. It can also be affected by your bias to prove the correctness of your initial assumptions.
Table 3-3 compares data-driven and user-driven data.
TABLE 3-3 Data-Driven and User-Driven Analytics
Characteristics |
Data-driven data |
User-driven data |
Business Knowledge Needed |
No prior knowledge |
In-depth domain knowledge |
Analysis and Tools Used |
Broad use of data-mining tools |
Specific design for analysis and testing |
Big Data |
Suited for large-scale data |
Can work on smaller datasets |
Analysis Scope |
Open scope |
Limited scope |
Analysis Conclusion |
Needs verification of results |
Easier adoption of analysis results |
Data Pattern |
Uncovers patterns and associations |
May miss hidden patterns and associations |
Connecting to Related Disciplines
Predictive analytics makes heavy use of three related disciplines: data mining, statistics, and machine learning. All four disciplines intersect to such a large degree that their names are often used interchangeably. Just to keep the record straight, there are some distinctions: predictive analytics combines many of the techniques, tools, and algorithms that data mining, statistics, and machine learning have in common. Its goal, however, is to use those tools to understand the data, analyze it, learn from it, and create a mathematical model that can make useful business predictions. That futuristic orientation is what differentiates predictive analytics as it combines aspects of the other three disciplines in the various steps and or stages required to develop a predictive model.
It's the predictive capability that sets apart this specialized use of statistics, data mining, and machine learning. The upcoming sections examine the contributions of each discipline.
Statistics
Statistics are numbers that result from measuring empirical data over time. As a discipline, statistics concerns itself with gathering and analyzing data — often to tell a story in numbers.
Statistics can infer relationships within data; thus it plays an active role in presenting data and helping us understand it. Using only a sample of the data, statistics can give us a basis for inferring hypotheses about the data as a whole. Thus the discipline is both descriptive and inferential.
Inferential statistics is concerned with making inferences or predictions about the characteristics of a whole population from a sample dataset. Sample data for analysis is chosen at random, in a way that represents (but doesn't include) the whole population, which is hard to have access to. When the sample dataset is well chosen, analyzing it allows the investigator to project the findings of the analysis onto the whole population with a measurable degree of accuracy.
Statistics relies, of course, on mathematics to analyze the data by verifying a hypothesis or theory, determining its accuracy, and drawing a conclusion.
It is the statisticians’ job to prove or disprove, with a single sample, whether their hypothesis about the population is true. The fact that a hypothesis precedes the analysis is a clear distinction for statistics, and a hallmark that differentiates it from other techniques.
Unlike data mining, statistics doesn't involve data cleansing or preprocessing. But descriptive statistics and data mining do have data grouping in common; both aim to describe data and define the processes used to categorize it.
A common denominator among all these disciplines is the underlying mathematics. The math is at the heart of statistics, and all algorithms and programming used in data mining, machine learning, and predictive analytics. Another common denominator is data analysis, a quest for better-informed, smarter decisions about future outcomes.
Data mining
Data mining is concerned mainly with analyzing data through describing, summarizing, classifying, and clustering the data so as to find useful patterns, links, or associations within it.
Data mining is often used interchangeably with machine learning but there are some distinctions between the two terms. For example: data miners are familiar with the use of machine learning to perform some tasks involving large amounts of data. However, they can also create a sophisticated and optimized query on a database without the use of machine learning — which would still be considered data mining. This is similar to knowledge discovery in databases, (KDD). It finds knowledge in data and emphasizes a broad application of particular data mining techniques.
For more about the specific use of data mining in predictive analytics, see Chapters 6 and 7.
Machine learning
Machine learning is another discipline that focuses on analyzing the data and making sense of it — but does so by teaching a computer program to do the work. The more data is analyzed, the more the system can learn about it, what to expect from it, and what to do with it. Data analysis becomes a source of continuous feedback to the system, which promptly analyzes data, attempts to understand and make sense of it, and gets better at those tasks.
When a new special case, usually an exception or a new behavior, is processed for the first time, the knowledge base of the system is incremented to include the new case. The more special cases are handled, the better equipped the system is to make decisions that produce the most useful outcome. This is the nature of the learning that the machine is programmed to do.
Machine learning is the equivalent of teaching a system the rules of a game, and then getting the system to practice the game by playing at elementary and intermediate levels. After that preparation, the system can play at advanced levels in real time.
IBM Watson uses natural language processing and machine learning to reveal insights from large amounts of unstructured data. Watson was used in a 2011 Jeopardy! match, and it won. Before that, IBM’s Deep Blue beat world champion Gary Kasparov in chess. In 2016, Google’s AlphaGo beat the world champion, Lee Sedol, in Go (a much harder game to conquer, because Go is exponentially more complex than chess).
Machine learning is perfectly suited for
- Complex data
- Data in various forms
- Data collected from diverse sources
- Data in large amounts
Data mining can uncover previously unknown connections and associations in the data. Machine learning can categorize the new and upcoming unknowns, learn from them based on its previous processing of the data, and get better at incorporating them into the known data. Both techniques lead to greater insight and understanding of the data.