Risk Management

In this chapter, you will learn how to
![]() Use risk management tools and principles to manage risk effectively
Use risk management tools and principles to manage risk effectively
![]() Explore risk mitigation strategies
Explore risk mitigation strategies
![]() Describe risk models
Describe risk models
![]() Explain the differences between qualitative and quantitative risk assessment
Explain the differences between qualitative and quantitative risk assessment
![]() Use risk management tools
Use risk management tools
![]() Examine risk management best practices
Examine risk management best practices
Risk management can best be described as a decision-making process. In the simplest terms, when you manage risk, you determine what could happen to your business, you assess the impact if it were to happen, and you decide what you could do to control that impact as much as you or your management deems necessary. You then decide to act or not to act, and, finally, you evaluate the results of your decision. The process may be iterative, as industry best practices clearly indicate that an important aspect of effectively managing risk is to consider it an ongoing process.
 An Overview of Risk Management
Risk management is an essential element of management from the enterprise level down to the individual project. Risk management encompasses all the actions taken to reduce complexity, increase objectivity, and identify important decision factors. There has been, and will continue to be, discussion about the complexity of risk management and whether it is worth the effort. Businesses must take risks to retain their competitive edge, however, and as a result, risk management must occur as part of managing any business, program, or project.

Risk management is about making a business profitable, not about buying insurance.
Risk management is both a skill and a task that is performed by all managers, either deliberately or intuitively. It can be simple or complex, depending on the size of the project or business and the amount of risk inherent in an activity. Every manager, at all levels, must learn to manage risk. The required skills can be learned.
Organizations should exercise due diligence in managing cybersecurity and privacy risk. This can be accomplished, in part, by establishing a comprehensive risk management program. The second part involves executing the program and, finally, verifying the effectiveness of the elements via an assessment. Exercising due diligence and implementing a robust and comprehensive cybersecurity and privacy risk management program can greatly assist in compliance with applicable laws, regulations, and stakeholder expectations. Risk management begins with the selection of a framework and the development of risk management processes. These steps are essential in developing, implementing, and maintaining the protection measures necessary to address the risks and the threats to organizational operations and assets. Mature organizations include cybersecurity and privacy risks as part of an all-hazards risk management approach—one that addresses all known risks with appropriate levels of control.
Employing effective risk-based processes, procedures, methods, and technologies ensures that the organization and its information-handling systems have the necessary trustworthiness and resiliency to support the business functions while meeting the expectations of stakeholders, as well as complying with legal and regulatory guidance.
Example of Risk Management at the International Banking Level
The Basel Committee on Banking Supervision is composed of government central-bank governors from around the world. This body created a basic, global risk management framework for market and credit risk. It implemented internationally a flat 8 percent capital charge to banks to manage bank risks. In layman’s terms, this means that for every $100 a bank makes in loans, it must possess $8 in reserve to be used in the event of financial difficulties. However, if banks can show they have very strong risk-mitigation procedures and controls in place, that capital charge can be reduced to as low as $0.37 (0.37 percent). If a bank has poor procedures and controls, that capital charge can be as high as $45 (45 percent) for every $100 the bank loans out. See www.bis.org/bcbs/ for source documentation regarding the Basel Committee.
This example shows that risk management can be and is used at high levels—the remainder of this chapter focuses on smaller implementations and demonstrates that risk management is used in many aspects of business conduct.
Risk Management Vocabulary
You need to understand a number of key terms to manage risk successfully. Some of these terms are defined here because they are used throughout the chapter. This list is somewhat ordered according to the organization of this chapter. More comprehensive definitions and other pertinent terms are listed alphabetically in the glossary at the end of this book.
Risk Risk is the possibility of suffering harm or loss.
Risk Management Risk management is the overall decision-making process of identifying threats and vulnerabilities and their potential impacts, determining the costs to mitigate such events, and deciding what actions are cost effective for controlling these risks.
Risk Assessment Risk assessment is the process of analyzing an environment to identify the risks (threats and vulnerabilities) and mitigating actions to determine (either quantitatively or qualitatively) the impact of an event that would affect a project, program, or business. It’s also referred to as risk analysis.
Asset An asset is any resource or information an organization needs to conduct its business.
Threat A threat is any circumstance or event with the potential to cause harm to an asset. For example, a malicious hacker might choose to hack your system by using readily available hacking tools.
Threat Actor A threat actor (agent) is the entity behind a threat.
Threat Vector A threat vector is a method used to effect a threat—for example, malware (threat) that is delivered via a watering-hole attack (vector).
Vulnerability A vulnerability is any characteristic of an asset that can be exploited by a threat to cause harm. A vulnerability can also be the result of a lack of security controls or weaknesses in controls. Your system has a security vulnerability, for example, if you have not installed patches to fix a cross-site scripting (XSS) error on your web site.
Impact Impact is the loss (or harm) resulting when a threat exploits a vulnerability. A malicious hacker (threat agent) uses an XSS tool (threat vector) to hack your unpatched web site (the vulnerability), stealing credit card information (threat) that is then used fraudulently. The credit card company pursues legal recourse against your company to recover the losses from the credit card fraud (the impact).
Control A control is a measure taken to detect, prevent, or mitigate the risk associated with a threat. It is also called a countermeasure or safeguard.
Qualitative Risk Assessment Qualitative risk assessment is the process of subjectively determining the impact of an event that affects a project, program, or business. Completing the assessment usually involves the use of expert judgment, experience, or group consensus.
Quantitative Risk Assessment Quantitative risk assessment is the process of objectively determining the impact of an event that affects a project, program, or business. Completing the assessment usually involves the use of metrics and models.
![]()
The distinction between qualitative and quantitative risk assessment will be more apparent as you read the section “Qualitative vs. Quantitative Risk Assessment” later in the chapter.
Mitigate The term mitigate refers to taking action to reduce the likelihood of a threat occurring and/or to reduce the impact if a threat does occur.
Single Loss Expectancy Single loss expectancy (SLE) is the monetary loss or impact of each occurrence of a threat exploiting a vulnerability.
Exposure Factor Exposure factor (EF) is a measure of the magnitude of loss of an asset. It is used in the calculation of single loss expectancy.
Annualized Rate of Occurrence Annualized rate of occurrence (ARO) is the frequency with which an event is expected to occur on an annualized basis.
Annualized Loss Expectancy Annualized loss expectancy (ALE) is how much a loss is expected to cost per year.
Systematic Risk Systematic risk is the chance of loss that is predictable under relatively stable circumstances. Examples such as fire, wind, and flood produce losses that, in the aggregate over time, can be accurately predicted despite short-term fluctuations. Systematic risk can be diversified away, which gives managers a level of control that can be employed.
Unsystematic Risk Unsystematic risk is the chance of loss that is unpredictable in the aggregate because it results from forces difficult to predict. Examples include, but are not limited to, recession, unemployment, epidemics, war-related events, and so forth. Unsystematic risk cannot be mitigated via diversification, limiting management responses.
Hazard A hazard is a circumstance that increases the likelihood or probable severity of a loss. For example, running systems without antivirus is a hazard because it increases the probability of loss due to malware.
Moral Hazard Moral hazard is an economic term describing a situation in which one party gets involved in a risky event knowing that it is protected against the risk and the other party will incur the cost.
Externality Externality is an economics term for a cost (or benefit) that is imposed on a third party who did not agree to incur the risk.
Force Majeure Force majeure is a legal concept for a situation where there is an occurrence of an event which is outside the reasonable control of a party and which prevents that party from performing its obligations under a contract.
What Is Risk Management?
Three definitions relating to risk management reveal why it is sometimes considered difficult to understand:
![]() The dictionary defines risk as the possibility of suffering harm or loss.
The dictionary defines risk as the possibility of suffering harm or loss.
![]() Carnegie Mellon University’s Software Engineering Institute (SEI) defines continuous risk management as “processes, methods, and tools for managing risks in a project. It provides a disciplined environment for proactive decision-making to 1) assess continuously what could go wrong (risks); 2) determine which risks are important to deal with; and 3) implement strategies to deal with those risks” (SEI, Continuous Risk Management Guidebook [Pittsburgh, PA: Carnegie Mellon University, 1996], 22).
Carnegie Mellon University’s Software Engineering Institute (SEI) defines continuous risk management as “processes, methods, and tools for managing risks in a project. It provides a disciplined environment for proactive decision-making to 1) assess continuously what could go wrong (risks); 2) determine which risks are important to deal with; and 3) implement strategies to deal with those risks” (SEI, Continuous Risk Management Guidebook [Pittsburgh, PA: Carnegie Mellon University, 1996], 22).
![]() The Information Systems Audit and Control Association (ISACA) says, “In modern business terms, risk management is the process of identifying vulnerabilities and threats to an organization’s resources and assets and deciding what countermeasures, if any, to take to reduce the level of risk to an acceptable level based on the value of the asset to the organization” (ISACA, Certified Information Systems Auditor (CISA) Review Manual, 2002 [Rolling Meadows, IL: ISACA, 2002], 344).
The Information Systems Audit and Control Association (ISACA) says, “In modern business terms, risk management is the process of identifying vulnerabilities and threats to an organization’s resources and assets and deciding what countermeasures, if any, to take to reduce the level of risk to an acceptable level based on the value of the asset to the organization” (ISACA, Certified Information Systems Auditor (CISA) Review Manual, 2002 [Rolling Meadows, IL: ISACA, 2002], 344).

Tech Tip
Risk Management Applies to All Business Processes
Even human resource management has an effect on risk management in a firm. For example, risk management theory used to posit that older workers were more likely to create liabilities. Recent studies have shown that as employees age, they have lower absenteeism, are more productive, and have higher levels of job satisfaction. Their greatest risk is longer recovery time from accidents, so companies are finding ways to prevent accidents to manage that risk.
These three definitions show that risk management is based on what can go wrong and what action should be taken, if any. Figure 20.1 provides a macro-level view of how to manage risk.

• Figure 20.1 A planning decision flowchart for risk management
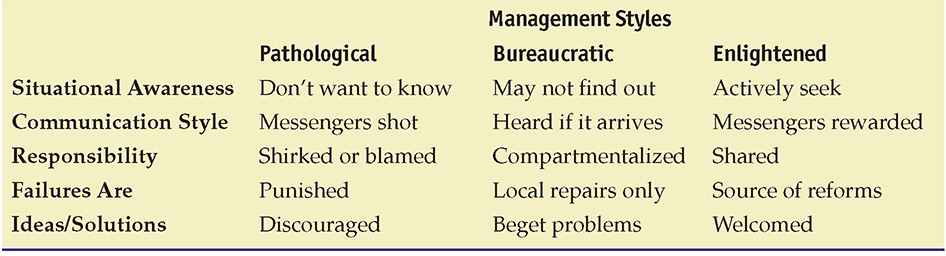
Risk Management Culture
Organizations have a culture associated with their operation. Frequently, this culture is set and driven by the activities of senior management personnel. The risk management culture of an organization can have an effect upon actions being taken by others. Table 20.1 illustrates the symptoms and results associated with risk management culture.
Table 20.1 Characteristics of Risk Management Culture
Risk Response Techniques
The presence of risks in a system is an absolute—they cannot be removed or eliminated. Actions can be taken to change the effects that a risk poses to a system, but the risk itself doesn’t really change, no matter what actions are taken to mitigate that risk. A high risk will always be a high risk. However, actions can be taken to reduce the impact of that risk if it occurs. A limited number of strategies can be used to manage risk. The risk can be avoided, transferred, mitigated, or accepted.
Avoiding the risk can be accomplished in many ways. Although threats cannot be removed from the environment, the exposure can be altered. Not deploying a module that increases risk is one manner of risk avoidance.
Another possible action to manage risk is to transfer that risk. A common method of transferring risk is to purchase insurance. Insurance allows risk to be transferred to a third party that manages specific types of risk for multiple parties, thus reducing the individual cost. Another common example of risk transfer is the protection against fraud that consumers have on their credit cards. The risk is transferred to another party, so people can use the card in confidence.
Risk can also be mitigated through the application of controls that reduce the impact of an attack. Controls can alert operators so that the level of exposure is reduced through process intervention. When an action occurs that is outside the accepted risk profile, a second set of rules can be applied, such as calling the customer for verification before committing a transaction. Controls such as these can act to reduce the risk associated with potential high-risk operations.
Tech Tip
Risk Responses
Four things can be done to respond to risk: accept, transfer, avoid, and mitigate. Whatever risk is not transferred, mitigated, or avoided is referred to as residual risk and by definition is accepted.
In addition to mitigating risk or transferring risk, it may be acceptable for a manager to accept risk; in other words, despite the potential cost of a given risk and its associated probability, the manager of the organization will accept responsibility for the risk if it does happen. For example, a manager may choose to allow a programmer to make “emergency” changes to a production system (in violation of good separation of duties and the change management process) because the system cannot go down during a given period of time. The manager accepts that the risk of the programmer possibly making unauthorized changes is outweighed by the high-availability requirement of that system. However, there should always be some additional controls, such as a management review or a standardized approval process, to ensure the assumed risk is adequately managed.
Understand that risk cannot be completely eliminated. A risk that remains after implementing controls is a residual risk. In this step, you further evaluate residual risks to identify where additional controls are required to reduce risk even more. As stated earlier, the risk management process is iterative.
Risk Management Frameworks
A risk management framework provides a structure for the risk management strategy and guides the creation of the proper guidelines with steps to follow to provide for a comprehensive coverage of the risk environment. There is a wide array of risk management frameworks, and different consultancies will each have its own variation. Most of these are derived from one of the common risk management frameworks, such as NIST Risk Management Framework (NIST RMF), COSO (Committee of Sponsoring Organizations) Enterprise Risk Management Framework, ISO 3100 Standard Framework, or FAIR (Factor Analysis of Information Risk). Numerous other frameworks also have cybersecurity risk implications or are industry specific, including the following:
![]() Payment Card Industry Data Security Standard (PCI DSS) Governs the way credit and debit card information is handled.
Payment Card Industry Data Security Standard (PCI DSS) Governs the way credit and debit card information is handled.
![]() ISO 27001 The international standard that describes best practice for implementing an information security management system (ISMS).
ISO 27001 The international standard that describes best practice for implementing an information security management system (ISMS).
![]() NIST Framework for Improving Critical Infrastructure Security A cybersecurity framework that provides a common taxonomy and mechanism for organizations to manage their cybersecurity risk associated with critical infrastructure deployments.
NIST Framework for Improving Critical Infrastructure Security A cybersecurity framework that provides a common taxonomy and mechanism for organizations to manage their cybersecurity risk associated with critical infrastructure deployments.
![]() Control Objectives for Information and Related Technologies (COBIT) A cybersecurity framework that integrates a business’s best aspects to its IT security, governance, and management.
Control Objectives for Information and Related Technologies (COBIT) A cybersecurity framework that integrates a business’s best aspects to its IT security, governance, and management.
![]() Health Information Trust Alliance (HITRUST) A cybersecurity framework that addresses the various measures for enhancing security and covers the Health Insurance Portability and Accountability Act (HIPAA).
Health Information Trust Alliance (HITRUST) A cybersecurity framework that addresses the various measures for enhancing security and covers the Health Insurance Portability and Accountability Act (HIPAA).
![]() Federal Risk and Authorization Management Program (FedRAMP) A framework designed for government agencies to evaluate cyber threats and risks to the different infrastructure platforms, as well as cloud-based services and software solutions.
Federal Risk and Authorization Management Program (FedRAMP) A framework designed for government agencies to evaluate cyber threats and risks to the different infrastructure platforms, as well as cloud-based services and software solutions.
![]() General Data Protection Regulation (GDPR) The latest framework to secure personally identifiable information belonging to European citizens in the European Union (EU).
General Data Protection Regulation (GDPR) The latest framework to secure personally identifiable information belonging to European citizens in the European Union (EU).
![]() North American Electric Reliability Corporation Critical Infrastructure Protection (NERC CIP) A cybersecurity framework that contains standards for protecting the bulk electric system.
North American Electric Reliability Corporation Critical Infrastructure Protection (NERC CIP) A cybersecurity framework that contains standards for protecting the bulk electric system.
Picking the correct framework(s) for your organization will depend on several factors, including industry, services you offer, the risk environment you are in, and more. One thing is clear: not having a framework will put you at a distinct disadvantage. One of the things an organization should get from its framework is a standardized and well-documented methodology for the following:
![]() Executing cybersecurity strategies using a range of security controls and best practices
Executing cybersecurity strategies using a range of security controls and best practices
![]() Conducting risk assessments that evaluate business priorities and identify gaps in cybersecurity controls
Conducting risk assessments that evaluate business priorities and identify gaps in cybersecurity controls
![]() Performing risk analysis on existing control gaps
Performing risk analysis on existing control gaps
![]() Measuring and scoring cybersecurity program maturity
Measuring and scoring cybersecurity program maturity
![]() Prioritizing future cybersecurity investment based on risk analysis
Prioritizing future cybersecurity investment based on risk analysis
Security Controls
Security controls are the mechanisms employed to minimize exposure to risk and mitigate the effects of loss. Using the security attributes of confidentiality, integrity, and availability associated with data, it is incumbent upon the security team to determine the appropriate set of controls to achieve the security objectives.
Just as security controls play a role in information security, the proper application of controls can assist in the risk management associated with physical security. Controls can be of a variety of types, as described in this chapter. The different categories of controls do not act as a taxonomy because there are overlapping descriptions and some control categories come from third-party policies and procedures.
One of the best references for security controls is NIST SP 800-53, currently in its fifth revision (see https://nvlpubs.nist.gov/nistpubs/SpecialPublications/NIST.SP.800-53r5.pdf). This document explains the use of controls and contains a catalog of hundreds of controls and modifiers, as well as a methodology of applying these controls based on a risk assessment of the asset being protected.
Controls should not just be chosen at random; rather, a design set of controls with purposeful aim toward actual threats and risk should be developed. A solid explanation of this is covered in NIST SP 800-53B, “Control Baselines for Information Systems and Organizations.” The objective is to determine the correct control baseline. A control baseline is the set of controls employed to address the level of risk an enterprise faces. Once this set is identified, the controls can be tailored to the specifics of the risk by the system and the risk level associated with the specific system.
The process of building a control baseline begins with a determination of the information criticality and sensitivity associated with the system. This is known as a security categorization, using levels such as High, Moderate, and Low with respect to a loss of confidentiality, integrity, or availability. The results of the security categorization are used to guide and inform the selection of security control baselines to protect systems and information. Once the baseline is constructed, it must be tailored to address specific instances and levels of risk for each system. The process can be summed up with the following steps:
![]() Identifying and designating common controls
Identifying and designating common controls
![]() Applying scoping considerations where required
Applying scoping considerations where required
![]() Supplementing baselines controls with control enhancements, as needed
Supplementing baselines controls with control enhancements, as needed
![]() Assigning values to organization-defined control parameters (from SP 800-53 controls) to provide specific details, including providing specification information for control implementation
Assigning values to organization-defined control parameters (from SP 800-53 controls) to provide specific details, including providing specification information for control implementation
![]() Adding further controls where needed
Adding further controls where needed
![]() Specifying compensating controls, if needed
Specifying compensating controls, if needed
The use of the risk management and control concepts from NIST SP 800-53B and NIST SP 800-53 can be employed in virtually any organization of any size or industry.
Categories
Three categories of security controls are specified in a variety of defining documents, and these categories have become the de facto standard for the cybersecurity industry. The use of categories separates the controls into groups based on what the control uses as its lever: managerial activity, operational activity, or technical control. Each of these is described in the following sections. For some controls, it is possible they have aspects that span more than one category.
Managerial
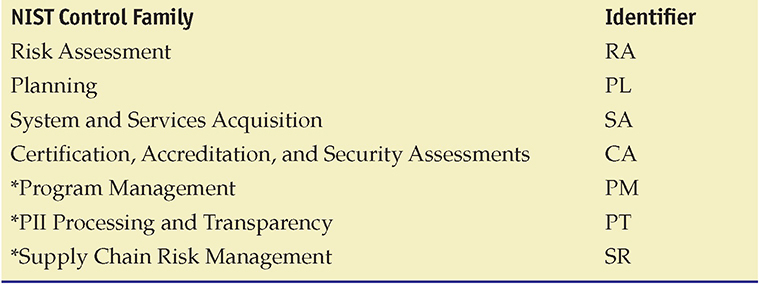
Managerial controls are those that are based on overall risk management. These security controls focus on the management of risk or the management of the cybersecurity system. An example of a managerial control would be the use of periodic security risk assessments to provide feedback to senior management on the current risk posture. Table 20.2 lists the managerial controls.
Table 20.2 Managerial Controls
![]()
The NIST SP 800 series refers to managerial controls as management controls.
The last three items in the table are new entries that entered the NIST publications with SP 800-53 R5.
![]()
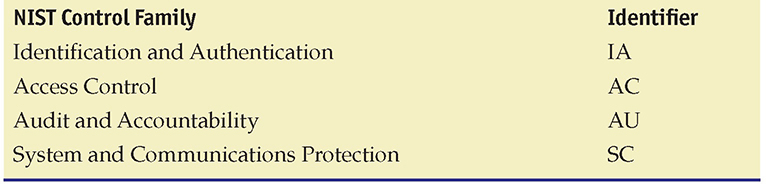
Per the footnote in the publication on page 8, “Of the 20 control families in NIST SP 800-53, 17 are aligned with the minimum security requirements in [FIPS 200]. The Program Management (PM), PII Processing and Transparency (PT), and Supply Chain Risk Management (SR) families address enterprise-level program management, privacy, and supply chain risk considerations pertaining to federal mandates emergent since [FIPS 200].”
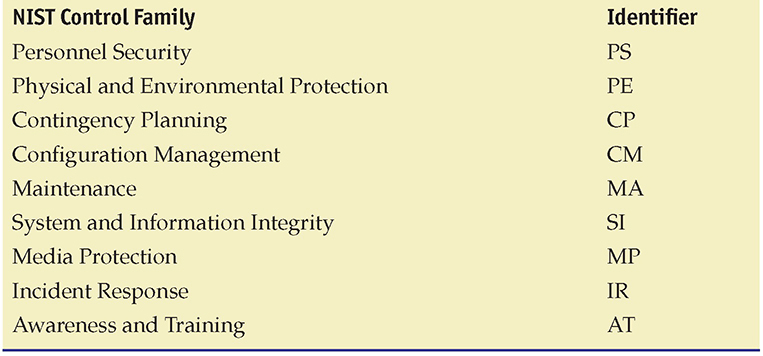
Operational
An operational control is a policy or procedure used to limit security risk. These security controls are primarily implemented and executed by people, as opposed to systems. Instructions to guards are an example of an operational control. Table 20.3 lists the operational controls.
Table 20.3 Operational Controls
Technical
A technical control uses some form of technology to address a physical security issue. These security controls are primarily implemented and executed by the information system through mechanisms contained in its hardware, software, or firmware components. Biometrics is an example of a technical control. Table 20.4 lists the technical controls.
Table 20.4 Technical Controls
![]()
The main difference between operational and technical controls is that operational controls are those that people initiate and follow, whereas technical controls are typically automated and involve a machine to execute.
Control Types
Controls can also be categorized by control type. The cybersecurity industry recognizes several different control types, and while these categories can be descriptive, they are not a taxonomy because they are not necessarily exclusive. Controls can fit into multiple types, depending on deployment and use. A door lock is an example of both a physical control and a preventative control.
Deterrent
A deterrent control acts to influence the attacker by reducing the likelihood of success. An example would be laws and regulations that increase punishment. Note that a deterrent control must be one that has to be known to a person for it to be effective. If it is unknown, it cannot deter. An example of this is a physical control, such as a CCTV or a warning sign. If a potential intruder does not see this control, it cannot deter the intruder.
Preventive
A preventative control is one that prevents specific actions from occurring; for example, an access control vestibule (formerly known as a mantrap) prevents tailgating. Preventative controls act before an event, preventing it from advancing. Unlike a deterrent control (which in itself also acts as a preventative control), a control classified as preventative does not have to be known by a person in order to be effective (for example, a firewall rule).
Detective
A detective control is one that facilitates the detection of a physical security breach. Detective controls act during an event, alerting operators to specific conditions. Alarms are common examples of detective controls.
Corrective
Corrective controls are used post-event, in an effort to minimize the extent of damage. Backups are a prime example of a corrective control because they can facilitate rapid resumption of operations.
Compensating
A compensating control is one that is used to meet a requirement when the requirement cannot be directly met. Fire suppression systems do not stop fire damage, but if properly employed, they can mitigate or limit the level of damage from fire.
Physical
A physical control is one that prevents specific physical actions from occurring; for example, an access control vestibule prevents tailgating. Physical controls prevent specific human interaction with a system and are primarily designed to prevent accidental operation of something. Physical controls act before an event, preventing it from actually occurring. Using covers over critical buttons is one example, as is a big red “STOP” button, positioned so it is easily reachable. The former stops inadvertent activation, while the latter facilitates easy activation in an emergency.
![]()
The three descriptors of controls—technical, administrative, and physical—are separate from the other descriptors and can be used independently of them. It is possible to have a control that is a technical physical preventative control (a door lock).
Business Risks
No comprehensive identification of all risks in a business environment is possible. In today’s technology-dependent business environment, risk is often simplistically divided into two areas: business risk and, a major subset, technology risk.
Tech Tip
Transferring Risk
One possible action to manage risk is to transfer that risk. The most common method of transferring risk is to purchase insurance. Cybersecurity insurance, for example, allows some level of risk to be transferred to a third party that manages specific types of risk for multiple parties, thus reducing the individual cost. Note that transferring risk usually applies to financial aspects of risk; it normally does not apply to legal accountability or responsibility.
Examples of Business Risks
The following are some of the most common business risks:
![]() Treasury management Management of company holdings in bonds, futures, currencies, and so on
Treasury management Management of company holdings in bonds, futures, currencies, and so on
![]() Revenue management Management of consumer behavior and the generation of revenue
Revenue management Management of consumer behavior and the generation of revenue
![]() Contract management Management of contracts with customers, vendors, partners, and so on
Contract management Management of contracts with customers, vendors, partners, and so on
![]() Fraud Deliberate deception made for personal gain, to obtain property or services, and so on
Fraud Deliberate deception made for personal gain, to obtain property or services, and so on
![]() Environmental risk management Management of risks associated with factors that affect the environment
Environmental risk management Management of risks associated with factors that affect the environment
![]() Regulatory risk management Management of risks arising from new or existing regulations
Regulatory risk management Management of risks arising from new or existing regulations
![]() Business continuity management Management of risks associated with recovering and restoring business functions after a disaster or major disruption occurs
Business continuity management Management of risks associated with recovering and restoring business functions after a disaster or major disruption occurs
![]() Technology Management of risks associated with technology in its many forms
Technology Management of risks associated with technology in its many forms
![]()
It is important that you understand that technology itself is a business risk. Hence, it must be managed along with other risks. Today, technology risks are so important they should be considered separately.
Examples of Technology Risks
The following are some of the most common technology risks:
![]() Security and privacy The risks associated with protecting personal, private, or confidential information
Security and privacy The risks associated with protecting personal, private, or confidential information
![]() Information technology operations The risks associated with the day-to-day operation of information technology systems
Information technology operations The risks associated with the day-to-day operation of information technology systems
![]() Business systems control and effectiveness The risks associated with manual and automated controls that safeguard company assets and resources
Business systems control and effectiveness The risks associated with manual and automated controls that safeguard company assets and resources
![]() Business continuity management The risks associated with the technology and processes to be used in the event of a disaster or major disruption
Business continuity management The risks associated with the technology and processes to be used in the event of a disaster or major disruption
![]() Information systems testing The risks associated with testing processes and procedures of information systems
Information systems testing The risks associated with testing processes and procedures of information systems
![]() Reliability and performance management The risks associated with meeting reliability and performance agreements and measures
Reliability and performance management The risks associated with meeting reliability and performance agreements and measures
![]() Information technology asset management The risks associated with safeguarding information technology physical assets
Information technology asset management The risks associated with safeguarding information technology physical assets
![]() Project risk management The risks associated with managing information technology projects
Project risk management The risks associated with managing information technology projects
![]() Change management The risks associated with managing configurations and changes (see Chapter 21)
Change management The risks associated with managing configurations and changes (see Chapter 21)
Tech Tip
Risk According to the Basel Committee
The Basel Committee referenced earlier in the chapter has defined three types of risk specifically to address international banking:
![]() Market risk Risk of losses due to fluctuation of market prices
Market risk Risk of losses due to fluctuation of market prices
![]() Credit risk Risk of default of outstanding loans
Credit risk Risk of default of outstanding loans
![]() Operational risk Risk from disruption by people, systems, processes, or disasters
Operational risk Risk from disruption by people, systems, processes, or disasters
Business Impact Analysis
Business impact analysis (BIA) is the name often used to describe a document created by addressing the questions associated with sources of risk and the steps taken to mitigate them in the enterprise. The BIA also outlines what the loss of any of your critical functions will mean to the organization. A range of terms and concepts is used in describing and understanding the nature and role of risk in the business environment, as explored in this section.
Mission-Essential Functions
When examining risk and impacts to a business, it is important to separate mission-essential functions from other business functions. In most businesses, the vast majority of daily functions, although important, are not mission essential. Mission-essential functions are those that, should they not occur or should they be performed improperly, the mission of the organization will be directly affected. The reason that identifying these functions is vital for risk management is simple: this is where you spend the majority of your effort, protecting the functions that are essential. Other functions may need protection, but their impairment will not cause the immediate impact that a mission-essential function would.
![]()
When examining business functions, you should also be aware of identifying vulnerable business processes. These are processes that have external inputs that could be less trustworthy and subject to manipulation.
Identification of Critical Systems
A part of identifying mission-essential functions is identifying the systems and data that support the functions. Identification of critical systems enables the security team to properly prioritize defenses to protect the systems and data in a manner commensurate with the associated risk.
Single Point of Failure
A key principle of security is defense in depth. This layered approach to security is designed to eliminate any specific single points of failure. A single point of failure is any aspect that, if triggered, could result in the failure of the system. Redundancies have costs, but if the alternative cost is failure, then levels of redundancy are acceptable. For mission-essential systems, single points of failure are items that need to be called to management’s attention, with full explanation of the risk and costs associated with them. There may be times that dealing with the single point of failure is not possible or practical, but everyone should understand the nature of the situation and resultant risk profile.
Impact
Risk is the chance of something not working as planned. Impact is the cost associated with a realized risk. Impact can be in many forms, including human life (as in injury or death), property loss, safety, financial loss, and loss of reputation. Losses are seldom absolute; they can come in all sizes and combinations. Different levels of risk can result in different levels of impact. Sometimes external events can affect the impact. If everyone in the industry has been experiencing a specific type of loss and your firm had time and warning to mitigate it but didn’t, the environment defined by these outside factors may well indeed increase the impact to your firm from this type of event.
Data Loss
Data loss is when an organization actually loses information. Files can be deleted, overwritten, or even misplaced. Ransomware is the most dangerous form of data loss because it is driven by outside forces and its very nature is to make the data unavailable to the enterprise until a ransom is paid. Hardware failure is another source of data loss. The primary defense for data loss is a solid backup program that can restore lost data.
Data Breaches
Data breaches are the release of data to unauthorized parties. Attackers that infiltrate a system are frequently looking to steal information such as personally identifiable information (PII), financial data, corporate data with value on the open market, and intellectual property. Having a data breach can be a legal issue, a financial issue, a reputation issue, or any combination of these issues, depending on the type and scope of the breach. Strong access controls, encryption of data at rest, and data loss prevention (DLP) elements can lessen the impact. Encryption is the strongest control because a breach of encrypted data without the key isn’t actually a breach.
Data Exfiltration
Data is a unique asset in many ways. One of the more relevant ways it is unique is in the fact that it can be copied, and then stolen, without affecting the original data. Stealing data becomes an exercise in data exfiltration or taking the copy out of the enterprise. Just as when a thief steals anything, the true theft only occurs when they escape with the item. Data exfiltration is the exporting of stolen data from an enterprise. Data exfiltration impact is related to the data being stolen. If it is intellectual property, then the impact can be directly to the bottom line. Loss of intellectual property can result in loss of future sales.
The loss of customer data can have impacts to reputation as well as direct financial impacts via regulatory penalties. Major data breaches have cost companies hundreds of millions of dollars in penalties, fines, and court settlements.
Identity Theft
Identity theft is a crime where someone uses information on another party to impersonate them. This is a secondary impact once data is exfiltrated. The loss of data can come from commercial systems and even home systems, and the results are the same: people can lose money, property, and time cleaning up an identity theft claim. The impact of data exfiltration that includes personally identifiable information (PII) can be significant in terms of regulatory costs. Recent major breaches have had substantial regulatory fines and legal costs associated with the loss of PII. The most expensive type of record to lose was customer PII records, which were involved in around 80 percent of breaches in the Verizon breach report. This is not just a big company financial issue. With the average cost of each lost record being roughly $150, it makes even small breaches of 1000 records a potential problem for smaller businesses.
Financial
At the end of the day, risk is measured in financial terms, and the impact from vulnerabilities can be expressed in financial terms as well. While it is sometimes difficult to directly trace each issue to a financial figure, there have been numerous examples where the results are easy to connect to the financials. A German steel mill was destroyed by attackers, Sony lost a movie release to North Korean hackers, Equifax paid out nearly $2 billion in response to its 2017 breach—these are all costs that are easily attributed to the direct impact of a cyber attack.
Here’s a list of items that can contribute to the financial costs of a cyber attack:
![]() Costs associated with investigating and fixing enterprise systems
Costs associated with investigating and fixing enterprise systems
![]() Lost orders/revenue due to system downtime
Lost orders/revenue due to system downtime
![]() Fines for regulatory noncompliance on privacy laws
Fines for regulatory noncompliance on privacy laws
![]() Attorney fees from lawsuits
Attorney fees from lawsuits
![]() Ransom payments made for ransomware
Ransom payments made for ransomware
![]() Losses due to stolen intellectual property
Losses due to stolen intellectual property
![]() Share price decline and market capitalization loss
Share price decline and market capitalization loss
Most of the financial numbers seen in the press are skewed by the large settlements of big companies with big losses, but the effect on small to medium-sized enterprises is even more dramatic. An average cybersecurity loss can cost a small to medium-sized business $400,000. For many businesses, that number is large enough to destroy them.
Reputation
Reputation impact as a result of a cyber attack comes in two main forms: loss of customer confidence and, in cases where skilled workforce is involved, a competitive field loss of key employees. If your customer base has questions about your ability to fulfill orders and manage their information, or just has a general loss of confidence in company management, then your customers may go to a competitor. This is true of businesses that have consumer-based customers as well as businesses with corporate-based customers.
Companies that have highly skilled workforce members that are in short supply also have to be concerned with their reputation in the eyes of their employees. After all, who wants to work for a company that embarrasses them due to news stories about management failures that result in cybersecurity losses? Every tech worker wants Google or Apple on their resume, but no one in cybersecurity wants to talk about working for a firm like Equifax, where mismanagement of IT resources caused one of the costliest breaches in history. Having workers quit because they don’t trust their company and finding replacements for highly skilled personnel when the company is in a reputational crisis is not a position management ever wants to find itself in.
Availability Loss
The CIA triad is confidentiality, integrity, and availability. Availability is defined as resources being available for authorized users when they are supposed to be available. When the impact of a cyber attack affects infrastructure elements, either by system damage, data loss, or loss of systems during recovery efforts, the effect is one that results in the loss of system capability. If this loss in capability is high enough, the system will stop processing records. For some firms, this is survivable for relatively short periods of time. For others, the downtime translates directly into lost revenue, and in some cases costs associated with service level agreements (SLAs) being broken. The loss of availability on the part of any system will have an impact on the enterprise; otherwise, why have the system? Determining the actual scale of an availability loss is simple in some transactional systems and more complicated in others, but at the end of the day, a firm invests business resources into its IT systems to facilitate business operations, not interrupt them.
Life
Some IT systems are involved in medicine, and failures of these systems can and has resulted in injury and death to patients. Other machines in industrial settings can have similar impacts. Injury and loss of life are outcomes that backups cannot address and can result in consequences beyond recovery.
Property
Property damage can be the result of unmitigated risk. This includes damage to company-owned property, damage to the property of others, and even environmental damage from toxic releases in industrial settings. One example is the Shamoon malware that destroyed the computing resources of Saudi Aramco to the point that the company had to buy replacement equipment because reimaging to a clean state was neither a guaranteed nor a timely solution.
Safety
Safety is the level of concern one places on the well-being of people. In a manufacturing environment, with moving equipment and machines that can present a danger to workers, government regulations drive specific actions to mitigate risk and make the workplace as safe as possible. Computers are becoming more involved in all aspects of businesses, and they can impact safety. Unsafe conditions that are the result of computer issues will face the same regulatory wrath that unsafe factories have caused in manufacturing—namely, fines and criminal complaints.
Third-party Risks
The enterprise computing environment is full of third parties, and their risks become enterprise risks. Common third-party risks that are often overlooked are issues of vendor management, system integration, and lack of vendor support. These are all related in the fact that when you chose a vendor as part of your enterprise solution, it made sense at that time. But over time, enterprises change, vendors change, capabilities and needs change, and what was once a good fit might not be at a future point in time. Keeping systems optimized is not a simple task, and many times later conditions will result in different decisions with regard to third parties and their risks.
Supply chains seldom stop with the next hop, and in technology those chains can be long and complex. With these supply chains come risks from elements such as outsourced code development, maintenance of systems, and, in the world of cloud systems, data storage on another party’s computer.
With respect to third-party software running in the enterprise, it is important to have an inventory of what the software is, by version, and where it is used. This assists the security team in monitoring for vulnerabilities through sources like the Common Vulnerabilities and Exposures (CVE) database. This list will also help in determining risk levels as software reaches its end of life (EOL) or end of service life (EOSL).
Remember that supply chain concerns and lack of vendor support are concerns directly related to third-party risks and management.
Vendor Management
A vendor or supplier is a firm that has a business relationship with the enterprise. In most cases, this relationship in the enterprise is one of many customers. While the voice of the customer is important, the voice of a single customer is almost never heard. The challenge of vendor management is in determining one’s own needs and then finding the vendors that offer the best value proposition against those needs. This is more than just selecting and buying a product for most components in an enterprise; issues of support, system lifetime, and maintenance all play a role in the long-term value of a vendor and their products. Mapping the needs and managing the multidimensional problem of determining the best fit and then maintaining that relationship over time are essential in the ever-changing enterprise environment.
System Integration
Enterprises are composed of many different components that all work together to process the information that flows through the enterprise. Different components serve different functions, but in the end, they have to work together. System integration is the connecting of these components, each representing a portion of the system into a complete functioning unit. System integration is an area where vulnerabilities can exist, as the pieces can have gaps in their integration or capabilities that do not manifest per the desired specification. System integration is coupled with configuration management because the configurations of the individual pieces can affect how the system as a whole functions. Any deviations from design specifications represent an opportunity for risk.
Lack of Vendor Support
Lack of vendor support can become an issue at several different levels. The most obvious scenario is when the original manufacturer of the item, be it hardware or software, no longer offers support. When an item reaches its end of life (EOL) from the original manufacturer’s standpoint, this signifies the finality of its life under almost all circumstances. After the manufacturer stops supporting an item, options to keep it up to date with patches and fixes seldom exist. At this point, an organization that continues to use the product assumes all of the risk associated with issues uncovered after the product has entered EOL status, and the options to address these risks are limited to compensating controls.
Do not be confused! End of life (EOL) is the term used to denote that something has reached the end of its “useful life.” End of service life (EOSL) or end of support is when the manufacturer quits selling an item. In most cases, the manufacturer no longer provides maintenance services or updates.
Another scenario in which lack of vendor support arises is when the system in question is implemented by a third-party vendor and that vendor either no longer supports the configuration or is no longer in business. The underlying technology may still be supported by the original manufacturers, but the lack of support for the middleware provided by the third-party implementer raises questions as to whether the underlying products can be updated or patched. This places the testing burden on the end user, and in many cases the end user does not have the knowledge or skills necessary to conduct thorough regression testing.
A system can have vulnerabilities related to its age. Whether the system is composed of old parts, as in an embedded system, or has become an end-of-life legacy system, the lack of vendor support can result in the owner’s inability to address many newly discovered issues.
Supply Chain
Supply chain risk is caused by vulnerabilities that lie within the supply chain. Whether these vulnerabilities are in the actual supply chain itself or a product coming from a third party, the results are the same—a level of increased risk. As we saw in 2020 as a result of the pandemic, global supply chains can be interrupted by external events that then go on to cause issues for firms that depend on the supply chain functioning efficiently. Delays of product launches, updates, and milestones can all occur when parts, components, or software elements are not delivered on time.
![]()
A supply chain attack typically occurs at the weakest security link in the supply chain, and this is common during the manufacturing process or even in the product delivery phase.
Outsourced Code Development
Code can be one of the greatest sources of vulnerabilities and risk in an enterprise. Code is embedded in so many aspects of the enterprise—from the equipment to the business processes, to the applications that make things run, to the infrastructure it all runs on. Code is the glue that holds it all together. However, when code is buried in the processes, and that code was developed by a third party, often using third-party code fragments, the chain of risk becomes long and difficult to manage. The risk isn’t just in the fact that the code is outsourced, but actually in the fact that the visibility and control over these risks becomes harder to manage with every step away from the source.
Creating code that is both maintainable and secure is not a simple task. It is important to have conditions in contracts requiring appropriate development measures be in place for third-party code, including the rights to inspect and verify security functionality. Items such as backdoors, either placed intentionally or left from a testing process, typically require access to the source code to find and remove. Ensuring third-party developers have appropriately secure coding practices and having their code reviewed by independent testers and placed in escrow for safekeeping are considered best practices.
Data Storage
Data storage is an important aspect of every enterprise, and it is typically distributed throughout the enterprise in different capacities and configurations. If all data was in a single location, then data storage management, including backup and recovery functions, would be easy to manage. As data storage is distributed across the enterprise into multiple enclaves with differing requirements and criticalities, the management of data storage becomes more difficult. Ensuring the correct access controls and security protections, such as backups, is important for all data stores, and when gaps in these controls emerge, this creates vulnerabilities. If attackers can manipulate data stores, then they can affect enterprise operations. To ensure all data is protected from becoming a vulnerability to the system, having a standardized data storage policy and checklist is good practice in the enterprise. Elements can be varied based on criticality of the data store, but following a standard procedure will reduce the chances of gaps existing from oversight or errors.
Risk Mitigation Strategies
Risk mitigation strategies are the action plans developed after a thorough evaluation of the possible threats, hazards, and risks associated with business operations. These strategies are employed to lessen the risks associated with operations. The focus of risk mitigation strategies is to reduce the effects of threats and hazards. Common mitigation strategies include change management, incident management, user rights and permission reviews, audits, and technology controls.
Change Management
Change management has its roots in system engineering and looks at the overall view of systems components and processes. Configuration management applies to a lower level of detail—specifically, the actual configuration of components, such as hosts, devices, and so forth. Configuration management might be considered a subset of change management, but they are not the same thing. Most of today’s software and hardware change management practices derive from long-standing system engineering configuration management practices. Computer hardware and software development have also evolved to the point that proper management structure and controls must exist to ensure the products operate as planned. It is normal for an enterprise to have a change control board to approve all production changes and ensure the change management procedures are followed before changes are introduced to a system.
Configuration control is the process of controlling changes to items that have been baselined. Configuration control ensures that only approved changes to a baseline are allowed to be implemented. It is easy to understand why a software system, such as a web-based order-entry system, should not be changed without proper testing and control. Otherwise, the system might stop functioning at a critical time. Configuration control is a key step that provides valuable insight to managers. If a system is being changed and configuration control is being observed, managers and others concerned will be better informed. This ensures proper use of assets and avoids unnecessary downtime because of the installation of unapproved changes.
![]()
Change management ensures proper procedures are followed when modifying the IT infrastructure.
Incident Management
When an incident occurs, having an incident response management methodology is a key risk mitigation strategy. Incident response and incident management are essential security functions and are covered in detail in Chapter 22.
User Rights and Permissions Reviews
The review of user rights and permissions is one of the more powerful security controls, but the strength of this control depends on it being kept up to date and properly maintained. Ensuring that the list of users and associated rights is complete and up to date is a challenging task in anything bigger than the smallest of enterprises. A compensating control that can assist in keeping the lists of user rights current is a set of periodic audits of the user base and associated permissions.
Data Loss or Theft
Data is the primary target of most attackers. The value of the data can vary, making some data more valuable and hence more at risk of theft. Data can also be lost through a variety of mechanisms, with hardware failure, operator error, and system errors being common causes. Regardless of the cause of loss, an organization can take various actions to mitigate the effects of the loss. Backups lead the list of actions because backups can provide the ultimate in protection against loss.
To prevent theft, a variety of controls can be employed. Some are risk mitigation steps, such as data minimization, which is the act of not storing what isn’t needed. If it must be stored and has value, then technologies such as data loss prevention can be used to provide a means of protection. Simple security controls such as firewalls and network segmentation can also act to make data theft more difficult.
Risk Management Models
Risk management concepts are fundamentally the same despite their definitions, and they require similar skills, tools, and methodologies. Several models can be used for managing risk through its various phases. Two models are presented here: the first can be applied to managing risks in general, and the second is tailored for managing risk in software projects.
General Risk Management Model
The following five steps can be used in virtually any risk management process. Following these steps will lead to an orderly process of analyzing and mitigating risks.
Tech Tip
Key Performance Indicators and Key Risk Indicators
A key performance indicator (KPI) is a measurable value that demonstrates how effectively a key business objective is being met. A key risk indicator (KRI) is a measure used in management to indicate how risky an activity is to the enterprise. Together these metrics provide management information essential for efficient operations. KPIs and KRIs are used to monitor the performance of systems and processes and are critical to effective risk management. If you can’t measure it, you have to rely on more subjective evaluation methods.
Step 1: Asset Identification
Identify and classify the assets, systems, and processes that need protection because they are vulnerable to threats. Use a classification that fits your business. This classification leads to the ability to prioritize assets, systems, and processes and to evaluate the costs of addressing the associated risks. Assets can include the following:
![]() Inventory
Inventory
![]() Buildings
Buildings
![]() Cash
Cash
![]() Information and data
Information and data
![]() Hardware
Hardware
![]() Software
Software
![]() Services
Services
![]() Documents
Documents
![]() Personnel
Personnel
![]() Brand recognition
Brand recognition
![]() Organization reputation
Organization reputation
![]() Goodwill
Goodwill
Step 2: Threat Assessment
After identifying the assets, you identify both the possible threats and the possible vulnerabilities associated with each asset and the likelihood of their occurrence. Threats can be defined as any circumstance or event with the potential to cause harm to an asset. Common classes of threats include the following (with examples):
![]() Natural disasters These are hurricanes, earthquakes, lightning, and so on.
Natural disasters These are hurricanes, earthquakes, lightning, and so on.
![]() Man-made disasters Examples are an earthen dam failure, such as the 1976 Teton Dam failure in Idaho; a car accident that destroys a municipal power distribution transformer; and the 1973 explosion of a railcar containing propane gas in Kingman, Arizona.
Man-made disasters Examples are an earthen dam failure, such as the 1976 Teton Dam failure in Idaho; a car accident that destroys a municipal power distribution transformer; and the 1973 explosion of a railcar containing propane gas in Kingman, Arizona.
![]() Internal vs. external Internal threats include disgruntled employees, well-meaning employees who make mistakes, and other employees who have an accident. External threats come from outside the organization and by definition begin without access to the system.
Internal vs. external Internal threats include disgruntled employees, well-meaning employees who make mistakes, and other employees who have an accident. External threats come from outside the organization and by definition begin without access to the system.
![]() Terrorism Examples are the 2001 destruction of the World Trade Center and the 1995 gas attack on the Shinjuku train station in Tokyo.
Terrorism Examples are the 2001 destruction of the World Trade Center and the 1995 gas attack on the Shinjuku train station in Tokyo.
![]() Errors An example is an employee not following safety or configuration management procedures.
Errors An example is an employee not following safety or configuration management procedures.
![]() Malicious damage or attacks This could be a disgruntled employee purposely corrupting data files.
Malicious damage or attacks This could be a disgruntled employee purposely corrupting data files.
![]() Fraud This could be an employee falsifying travel expenses or vendor invoices and payments.
Fraud This could be an employee falsifying travel expenses or vendor invoices and payments.
![]() Theft This could be an employee stealing from the loading dock a laptop computer after it has been inventoried but not properly secured.
Theft This could be an employee stealing from the loading dock a laptop computer after it has been inventoried but not properly secured.
![]() Equipment or software failure This could be an error in the calculation of a company-wide bonus overpaying employees.
Equipment or software failure This could be an error in the calculation of a company-wide bonus overpaying employees.
Vulnerabilities are characteristics of resources that can be exploited by a threat to cause harm. Common classes of vulnerabilities include the following (with examples):
![]() Unprotected facilities Company offices with no security officer present or no card-entry system
Unprotected facilities Company offices with no security officer present or no card-entry system
![]() Unprotected computer systems A server temporarily connected to the network before being properly configured/secured
Unprotected computer systems A server temporarily connected to the network before being properly configured/secured
![]() Unprotected data Not installing critical security patches to eliminate application security vulnerabilities
Unprotected data Not installing critical security patches to eliminate application security vulnerabilities
![]() Insufficient procedures and controls Allowing an accounts payable clerk to create vendors in the accounting system, enter invoices, and authorize check payments
Insufficient procedures and controls Allowing an accounts payable clerk to create vendors in the accounting system, enter invoices, and authorize check payments
![]() Insufficient or unqualified personnel A junior employee not sufficiently securing a server because of a lack of training
Insufficient or unqualified personnel A junior employee not sufficiently securing a server because of a lack of training
Step 3: Impact Determination and Quantification
An impact is the loss created when a threat exploits a vulnerability. When a threat is realized, it creates impact. Impacts can be either tangible or intangible. A tangible impact results in financial loss or physical damage. For an intangible impact, assigning a financial value to the impact can be difficult. For example, in a manufacturing facility, storing and using flammable chemicals creates a risk of fire to the facility. The vulnerability is that flammable chemicals are stored there. The threat would be that a person could cause a fire by mishandling the chemicals (either intentionally or unintentionally). A tangible impact would be the loss incurred (say, $500,000) if a person ignites the chemicals and fire then destroys part of the facility. An example of an intangible impact would be the loss of goodwill or brand damage caused by the impression that the company doesn’t safely protect its employees or the surrounding geographic area.
Tech Tip
Business Dependencies
An area often overlooked in risk assessment is the need to address business dependencies—each organization must assess risks caused by other organizations with which it interacts. This occurs when the organization is either a consumer of or a supplier to other organizations (or both). For example, if a company is dependent on products produced by a laboratory, then the company must determine the impact of the laboratory not delivering the product when needed. Likewise, an organization must assess risks that can occur when it is the supplier to some other company dependent on its products.
Tangible impacts include
![]() Direct loss of money
Direct loss of money
![]() Endangerment of staff or customers
Endangerment of staff or customers
![]() Loss of business opportunity
Loss of business opportunity
![]() Reduction in operational efficiency or performance
Reduction in operational efficiency or performance
![]() Interruption of a business activity
Interruption of a business activity
Intangible impacts include
![]() Breach of legislation or regulatory requirements
Breach of legislation or regulatory requirements
![]() Loss of reputation or goodwill (brand damage)
Loss of reputation or goodwill (brand damage)
![]() Breach of confidence
Breach of confidence
Step 4: Control Design and Evaluation
In this step, you determine which controls to put in place to mitigate the risks. Controls (also called countermeasures or safeguards) are designed to control risk by reducing vulnerabilities to an acceptable level. (For use in this text, the terms control, countermeasure, and safeguard are considered synonymous and are used interchangeably.)
![]()
The steps in the general risk management model should allow you to identify the steps in any risk management process.
Controls can be actions, devices, or procedures. As discussed earlier, they can be deterrent, preventive, detective, or corrective in how they act.
Step 5: Residual Risk Management
Understand that risk cannot be completely eliminated. A risk that remains after implementing controls is termed a residual risk. In this step, you further evaluate residual risks to identify where additional controls are required to reduce risk even more. This leads us to the earlier statement that the risk management process is iterative.
Software Engineering Institute Model
In an approach tailored for managing risk in software projects, SEI uses the following paradigm (SEI, Continuous Risk Management Guidebook [Pittsburgh, PA: Carnegie Mellon University, 1996], 23). Although the terminology varies slightly from the previous model, the relationships are apparent, and either model can be applied wherever risk management is used.
1. Identify Look for risks before they become problems.
2. Analyze Convert the data gathered into information that can be used to make decisions. Evaluate the impact, probability, and timeframe of the risks. Classify and prioritize each of the risks.
3. Plan Review and evaluate the risks and decide what actions to take to mitigate them. Implement those mitigating actions.
4. Track Monitor the risks and the mitigation plans. Trends may provide information to activate plans and contingencies. Review periodically to measure progress and identify new risks.
5. Control Make corrections for deviations from the risk mitigation plans. Correct products and processes as required. Changes in business procedures may require adjustments in plans or actions, as do faulty plans and risks that become problems.
Tech Tip
Can All Risks Be Identified?
It is important to note that not all risks need to be mitigated or controlled; however, as many risks as possible should be identified and reviewed. Those deemed to have potential impact should be mitigated by countermeasures.
NIST Risk Models
NIST has several informative risk models that can be applied to an enterprise. NIST has published several Special Publications (SPs) associated with risk management. SP 800-39, “Managing Information Security Risk: Organization, Mission, and Information System View,” presents several key insights:
![]() Establish a relationship between aggregated risk from information systems and mission/business success.
Establish a relationship between aggregated risk from information systems and mission/business success.
![]() Encourage senior leaders to recognize the importance of managing information security risk within the organization.
Encourage senior leaders to recognize the importance of managing information security risk within the organization.
![]() Help those with system-level security responsibilities understand how system-level issues affect the organization/mission as a whole.
Help those with system-level security responsibilities understand how system-level issues affect the organization/mission as a whole.
SP 800-39 does this through the use of a model, illustrated in Figure 20.2. This model has two distinct levels of analysis that work together as one in describing risk management actions.
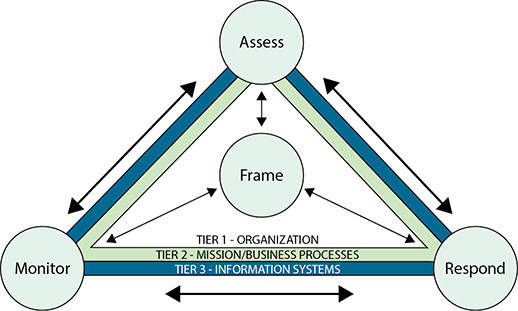
• Figure 20.2 NIST risk management process applied across the tiers
The first level of analysis is represented by four elements: Frame, Assess, Respond, and Monitor. The second level is related to the tiers represented in the hierarchical triangles: Organization, Mission/Business Processes, and Information Systems.
The Frame element represents the organization’s risk framing that establishes the context and provides a common perspective on how the organization manages risk. Risk framing is central to the model, as illustrated by the arrows to the other elements. Its principal output is a risk management strategy that addresses how the organization assesses risk, responds to risk, and monitors risk. The three tiers represent the different distinct layers in an organization that are associated with risk. Tier 1, representing the executive function, is where the risk framing occurs. At Tier 2, the mission and business process layer, the risk management functions of assess, respond, and monitor occur. Tier 3 is the information system layer where activities of risk management are manifested in the systems of the organization.
This explanation is not completely correct. All steps of the risk management and assessment process can occur at all three layers; you can assess risk at Tier 1 (business or mission risk), Tier 2 (programmatic and cross-functional or aggregate system risk), and Tier 3 (system-level risk).
Model Application
The three model examples define steps that can be used in any general or software risk management process. These risk management principles can be applied to any project, program, or business activity, no matter how simple or complex. Figure 20.3 shows how risk management can be applied across the continuum and that the complexity of risk management generally increases with the size of the project, program, or business to be managed.
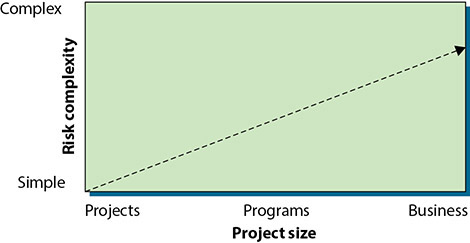
• Figure 20.3 Risk complexity versus project size
Risk Assessment
Risk assessment is a process with many different aspects, as risk can be assessed from multiple perspectives and levels, as well as via different methodologies. Risk can be assessed using quantitative methods, where specific values are assigned, or qualitative methods, where relative levels are considered. Risk can be assessed across the breadth of an organization via a risk assessment methodology that emphasizes the policies and procedures, examining for missing elements or gaps. Vulnerability assessments can be conducted to examine for specific vulnerabilities testing systems for specific mitigation ability. Red team exercises and penetration exercises are used to test systems against specific threat type environments.
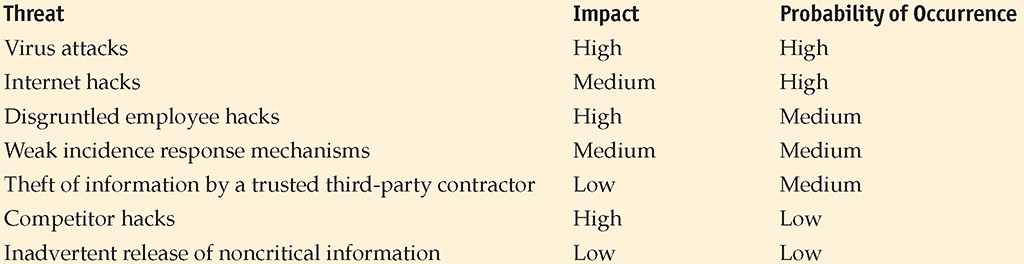
Qualitatively Assessing Risk
Qualitative risk analysis allows expert judgment and experience to assume a prominent role. To assess risk qualitatively, you compare the impact of the threat with the probability of occurrence and assign an impact level and probability level to the risk. For example, if a threat has a high impact and a high probability of occurring, the risk exposure is high and probably requires some action to reduce this threat (pale green box in Figure 20.4). Conversely, if the impact is low with a low probability, the risk exposure is low, and no action may be required to reduce the likelihood of the occurrence or impact of this threat (white box in Figure 20.4). Figure 20.4 shows an example of a binary assessment, where only two outcomes are possible each for impact and probability. Either it will have an impact or it will not (or it will have a high or low impact), and it will occur or it won’t (or it will have a high probability of occurring or a low probability of occurring).

• Figure 20.4 Binary assessment
In reality, a few threats can usually be identified as presenting high-risk exposure, and a few threats present low-risk exposure. The threats that fall somewhere between (pale blue boxes in Figure 20.4) will have to be evaluated by judgment and management experience.
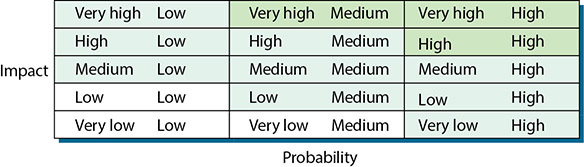
If the analysis is more complex, requiring three levels of analysis, such as low-medium-high or green-yellow-red, then nine combinations are possible, as shown in Figure 20.5. Again, the pale green boxes probably require action, the white boxes may or may not require action, and the pale blue boxes require judgment. (Note that for brevity, in Figure 20.5 the first term in each box refers to the magnitude of the impact, and the second term refers to the probability of the threat occurring.)

• Figure 20.5 Three levels of analysis
Other levels of complexity are possible. With five levels of analysis, 25 values of risk exposure are possible. In this case, the possible values of impact and probability could take on the values very low, low, medium, high, or very high. Also, note that the matrix does not have to be symmetrical. For example, if the probability is assessed with three values (low, medium, high) and the impact has five values (very low, low, medium, high, very high), the analysis would be as shown in Figure 20.6. (Again, note that the first term in each box refers to the impact, and the second term in each box refers to the probability of occurrence.)
• Figure 20.6 A three-by-five level analysis
So far, the examples have focused on assessing likelihood versus impact. Qualitative risk assessment can be adapted to a variety of attributes and situations in combination with each other. For example, Figure 20.7 shows the comparison of some specific risks that have been identified during a security assessment. The assessment identified the risk areas listed in the first column (weak intranet security, high number of modems, Internet attack vulnerabilities, and weak incident detection and response mechanism). The assessment also identified various potential impacts, listed across the top (business impact, probability of attack, cost to fix, and difficulty to fix). Each of the impacts has been assessed as low, medium, or high—depicted using green, yellow, and red, respectively. Each of the risk areas has been assessed with respect to each of the potential impacts, and an overall risk assessment has been determined in the last column.

• Figure 20.7 Example of a combination assessment
Risk Matrix/Heat Map
A risk matrix/heat map is used to visually display the results of a qualitative risk analysis. This method allows expert judgment and experience to assume a prominent role in the risk assessment process and is easier than trying to define an exact number for each element of risk. To assess risk qualitatively, you first determine the likelihood of a threat occurring and also the consequence should it occur. You then take the value of each, multiply them together to get the risk value. For a 5×5 risk matrix/heat map, as shown in Figure 20.8, one uses simple numbers from 1 to 5 for each of the axes, and this yields risk values from 1 to 25. These values can then be classified as minor, moderate, major, or critical.
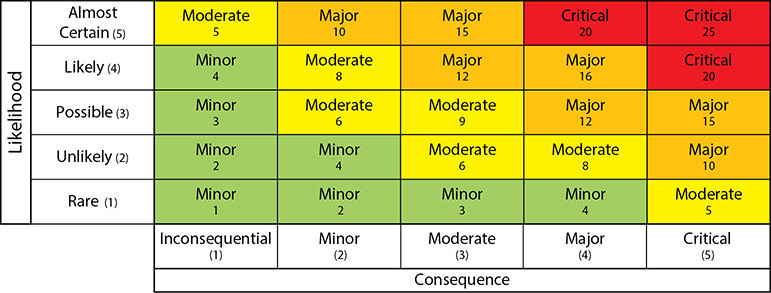
• Figure 20.8 Risk Matrix/Heat Map
Quantitatively Assessing Risk
Whereas qualitative risk assessment relies on judgment and experience, quantitative risk assessment applies historical information and trends to attempt to predict future performance. This type of risk assessment is highly dependent on historical data, and gathering such data can be difficult. Quantitative risk assessment can also rely heavily on models that provide decision-making information in the form of quantitative metrics, which attempt to measure risk levels across a common scale.
It is important to understand that key assumptions underlie any model, and different models will produce different results even when given the same input data. Although significant research and development have been invested in improving and refining the various risk analysis models, expert judgment and experience must still be considered an essential part of any risk assessment process. Models can never replace judgment and experience, but they can significantly enhance the decision-making process.
Adding Objectivity to a Qualitative Assessment
It is possible to move a qualitative assessment toward being more quantitative. Making a qualitative assessment more detailed can be as simple as assigning numeric values to one of the tables shown in Figures 20.4 through 20.7. For example, the impacts listed in Figure 20.7 can be prioritized from highest to lowest and then weighted, as shown in Table 20.5, with business impact weighted the most and difficulty to fix weighted the least. This is a semiquantitative method and may use numerical values for the sake of convenience to ease computation and provide a more defined answer, but it is still considered a qualitative method.
Table 20.5 Adding Weights and Definitions to the Potential Impacts

Next, values can be assigned to reflect how each risk was assessed. Figure 20.7 can thus be made more objective by assigning a value to each color that represents an assessment. For example, a red assessment indicates many critical, unresolved issues, and this will be given an assessment value of 3. Green means few issues are unresolved, so it is given a value of 1. Table 20.6 shows values that can be assigned for an assessment using red, yellow, and green.
The last step is to calculate an overall risk value for each risk area (each row in Figure 20.7) by multiplying the weights depicted in Table 20.5 by the assessed values from Table 20.6 and summing the products.
Risk = W1 * V1 + W2 * V2 + … W4 * V4
The risk calculation and final risk value for each risk area listed in Figure 20.7 have been incorporated into Figure 20.9. The assessed areas can then be ordered from highest to lowest based on the calculated risk value to aid management in focusing on the risk areas with the greatest potential impact.
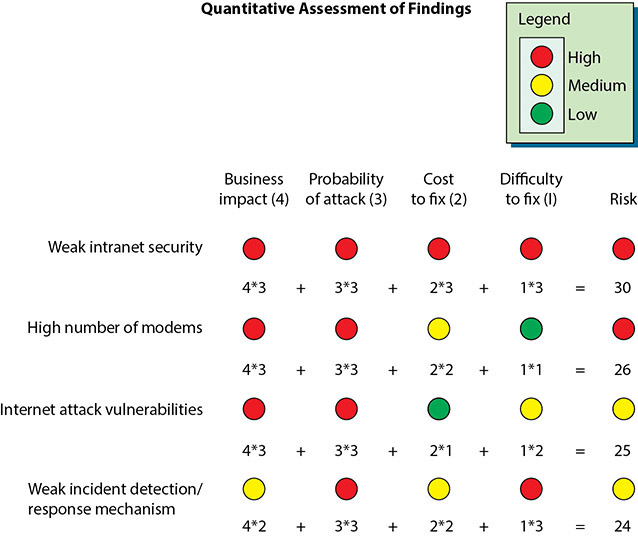
• Figure 20.9 Final quantitative assessment of the findings
You can also add more information via an assignment of values, such as shown in Table 20.6.
Table 20.6 Adding Values to Assessments

Risk Calculation
More complex models permit a variety of analyses based on statistical and mathematical models. A common method is the calculation of the annualized loss expectancy (ALE). Calculating the ALE creates a monetary value of the impact. This calculation begins by calculating a single loss expectancy.
Asset Value
The asset value (AV) is the amount of money it would take to replace an asset. This term is used with the exposure factor, a measure of how much of an asset is at risk, to determine the single loss expectancy.
Exposure Factor
The exposure factor (EF) is a measure of the magnitude of loss of an asset. The exposure factor is the percentage of an asset’s value that is at risk. In some cases, if the risk is realized, the asset is lost; in other cases, it may be impaired. If you have one web server and it breaks, you have 100 percent EF. If you have a farm of five web servers and two of them break, the EF is 40 percent.
For example, to calculate the exposure factor, assume the asset value of a small office building and its contents is $2 million. Also assume that this building houses the call center for a business, and the complete loss of the center would take away about half of the capability of the company. Therefore, the exposure factor is 50 percent.
SLE
The single loss expectancy (SLE) is the value of a loss expected from a single event. The SLE is calculated using the following formula:
SLE = asset value (AV) × exposure factor (EF)
For our office building example, the SLE is
$2 million × 0.5 = $1 million
ARO
The annualized rate of occurrence (ARO) is a representation of the frequency of the event, measured in a standard year. If the event is expected to occur once in 20 years, then the ARO is 1/20. Typically the ARO is defined by historical data, either from a company’s own experience or from industry surveys. Continuing our example, assume that a fire at this business’s location is expected to occur about once in 20 years. Given this information, the ALE is
$1 million × 1/20 = $50,000
![]()
Try This!
Calculate SLE, ARO, and ALE
A company owns five warehouses throughout the United States, each of which is valued at $1 million and contributes equally to the company’s capacity. Try calculating the SLE, ARO, and ALE for its warehouse located in the Mountain West, where the probability of an earthquake is once every 500 years.
The solution is SLE = $1 million × 1.0; ARO = 1/500; ALE = $1 million/500, or $2000.
ALE
The annualized loss expectancy (ALE) is then calculated simply by multiplying the SLE by the likelihood or number of times the event is expected to occur in a year, which is called the annualized rate of occurrence:
ALE = SLE × ARO
The ALE determines a threshold for evaluating the cost/benefit ratio of a given countermeasure. Therefore, a countermeasure to protect this business adequately should cost no more than the calculated ALE of $50,000 per year.
The examples in this chapter have been simplistic, but they demonstrate the concepts of both qualitative and quantitative risk analysis. More complex algorithms and software packages are available for accomplishing risk analyses, but these examples suffice for the purposes of this text.
Risk Register
A risk register is a list of the risks associated with a system. It also can contain additional information associated with the risk element, such as the category to group like risks, probability of occurrence, impact to the organization, mitigation factors, and other data. There is no standardized form. The Project Management Institute has one format, and other sources have different formats. The reference document ISO 73:2009, “Risk Management—Vocabulary,” defines a risk register to be a “record of information about identified risks.” Note that the NIST Risk Management Framework refers to this document as a “Plan of Actions and Milestones” and includes target dates for resolution, as well as resources and responsible personnel required.
Likelihood of Occurrence
The likelihood of occurrence is the chance a particular risk will occur. This measure can be qualitative or quantitative. For qualitative measures, it is typically defined on an annual basis to allow use of the measurement with respect to other annualized measures. If defined quantitatively, it is used to create rank order outcomes.
Impact
The impact of an event is a measure of the actual loss when a threat exploits a vulnerability. Federal Information Processing Standards (FIPS) 199 defines three levels of impact using the terms high, moderate, and low. The impact needs to be defined in terms of the context of each organization because what is high for some firms may be low for much larger firms. The common method is to define the impact levels in terms of important business criteria. Impacts can be in terms of cost (dollars), performance (service level agreement [SLA] or other requirements), schedule (deliverables), or any other important item. Impact can also be categorized in terms of the information security attribute that is relevant to the problem: confidentiality, integrity, or availability.
Supply Chain Assessment
The analysis of risk in a supply chain has become an important issue in our connected society. One needs to consider not just the risk associated with a system but the risk embedded in a system as a result of its creation, which includes risks from the supply chain associated with elements inside a system. For instance, if a system has critical components that are not replaceable except from a single source, what happens if that source quits making the component? The term supply chain assessment describes the process where these risks are determined and explored.
Qualitative vs. Quantitative Risk Assessment
It is recognized throughout industry that it is impossible to conduct risk management that is purely quantitative. Usually risk management includes both qualitative and quantitative elements, requiring both analysis and judgment or experience. In contrast to quantitative assessment, it is possible to accomplish purely qualitative risk management. It is easy to see that it is impossible to define and quantitatively measure all factors that exist in a given risk assessment. It is also easy to see that a risk assessment that measures no factors quantitatively but measures them all qualitatively is possible.
The decision of whether to use qualitative versus quantitative risk management depends on the criticality of the project, the resources available, and the management style. The decision will be influenced by the degree to which the fundamental risk management metrics, such as asset value, exposure factor, and threat frequency, can be quantitatively defined.
Tools
Many tools can be used to enhance the risk management process. The following tools can be used during the various phases of risk assessment to add objectivity and structure to the process. Understanding the details of each of these tools is not necessary for the CompTIA Security+ exam, but understanding what they can be used for is important. You can find more information on these tools in any good project management book.
![]() Affinity grouping A method of identifying items that are related and then identifying the principle that ties them together.
Affinity grouping A method of identifying items that are related and then identifying the principle that ties them together.
![]() Baseline identification and analysis The process of establishing a baseline set of risks. It produces a “snapshot” of all the identified risks at a given point in time.
Baseline identification and analysis The process of establishing a baseline set of risks. It produces a “snapshot” of all the identified risks at a given point in time.
![]() Cause-and-effect analysis Identifying relationships between a risk and the factors that can cause it. This is usually accomplished using fishbone diagrams developed by Dr. Kaoru Ishikawa, former professor of engineering at the Science University of Tokyo.
Cause-and-effect analysis Identifying relationships between a risk and the factors that can cause it. This is usually accomplished using fishbone diagrams developed by Dr. Kaoru Ishikawa, former professor of engineering at the Science University of Tokyo.
![]() Cost/benefit analysis A straightforward method for comparing cost estimates with the benefits of a mitigation strategy.
Cost/benefit analysis A straightforward method for comparing cost estimates with the benefits of a mitigation strategy.
![]() Gantt charts A management tool for diagramming schedules, events, and activity duration.
Gantt charts A management tool for diagramming schedules, events, and activity duration.
![]() Interrelationship digraphs A method for identifying cause-and-effect relationships by clearly defining the problem to be solved, identifying the key elements of the problem, and then describing the relationships between each of the key elements.
Interrelationship digraphs A method for identifying cause-and-effect relationships by clearly defining the problem to be solved, identifying the key elements of the problem, and then describing the relationships between each of the key elements.
![]() Pareto charts A histogram that ranks the categories in a chart from most frequent to least frequent, thus facilitating risk prioritization.
Pareto charts A histogram that ranks the categories in a chart from most frequent to least frequent, thus facilitating risk prioritization.
![]() Program evaluation and review technique (PERT) charts A diagram depicting interdependencies between project activities, showing the sequence and duration of each activity. When complete, the chart shows the time necessary to complete the project and the activities that determine that time (the critical path).
Program evaluation and review technique (PERT) charts A diagram depicting interdependencies between project activities, showing the sequence and duration of each activity. When complete, the chart shows the time necessary to complete the project and the activities that determine that time (the critical path).
![]() Risk management plan A comprehensive plan documenting how risks will be managed on a given project. It contains processes, activities, milestones, organizations, responsibilities, and details of each major risk management activity and how it is to be accomplished. It is an integral part of the project management plan.
Risk management plan A comprehensive plan documenting how risks will be managed on a given project. It contains processes, activities, milestones, organizations, responsibilities, and details of each major risk management activity and how it is to be accomplished. It is an integral part of the project management plan.
Cost-Effectiveness Modeling
Cost-effectiveness modeling assumes you are incurring a cost and focuses on the question of what the value of that cost is. This is a rational means of economic analysis used to determine the utility of a specific strategy. It is a nearly foregone conclusion you will be spending resources on security; it’s just a question of what you get for your money.
Tech Tip
Risks Really Don’t Change, But They Can Be Mitigated
One final thought to keep in mind is that the threats themselves are independent of your actions, no matter what actions are taken to mitigate the associated risk. A high threat environment will always be a high risk and will require more mitigation than a lower one. However, actions can be taken to reduce the likelihood of the risk and the impact of that risk if it occurs. Over time, risks may be fluid as new threats come into focus and older ones retreat, with the issues of likelihood and potential impact changing. A new web system using a different technology (for example, eliminating Flash elements) will have a different risk profile than the older system.
The total cost of ownership (TCO) is the set of all costs—including everything from capital costs to operational and exception-handling costs—associated with a technology. There are a lot of arguments over how to calculate TCO, typically to favor one solution over another, but that is not important in this instance. It is important to note the differences between normal operational costs and exception handling. Exception handling is always more expensive.
The objective in risk management is to have a set of overlapping controls such that the TCO is minimized. This means that the solution has a measured effectiveness across the risk spectrum. This is where the compliance-versus-security debate becomes interesting. You establish compliance rules for a variety of reasons, but once established, their future effectiveness depends on the assumption that the same risk environment exists as when they were created. Should the risk, the value, or the impact change over time, the cost effectiveness of the compliance-directed control can shift, frequently in a negative fashion.
Risk Management Best Practices
Best practices are the best defenses that an organization can employ in any activity. One manner of examining best practices is to ensure that the business has the set of best practices to cover its operational responsibilities. At a deeper level, the details of these practices need to themselves be best practices if you are to get the best level of protection. At a minimum, risk mitigation best practices include business continuity, high availability, fault tolerance, and disaster recovery concepts.
None of these operates in isolation. In fact, they are all interconnected, sharing elements as they all work together to achieve a common purpose: the security of the data in the enterprise, which is measured in terms of risk exposure. Key elements of best practices include understanding the vulnerabilities, understanding the threat vectors and likelihoods of occurrence, and the use of mitigation techniques to reduce residual risk to manageable levels.
System Vulnerabilities
Vulnerabilities are characteristics of an asset that can be exploited by a threat to cause harm. All systems have bugs or errors. Not all errors or bugs are vulnerabilities. For an error or bug to be classified as a vulnerability, it must be exploitable, meaning an attacker must be able to use the bug to cause a desired result. Three elements are needed for a vulnerability to occur:
![]() The system must have a flaw.
The system must have a flaw.
![]() The flaw must be accessible by an attacker.
The flaw must be accessible by an attacker.
![]() The attacker must possess the ability to exploit the flaw.
The attacker must possess the ability to exploit the flaw.
Vulnerabilities can exist in many levels and from many causes. From design errors, to coding errors, to unintended (and untested) combinations in complex systems, there are numerous forms of vulnerabilities. Vulnerabilities can exist in software, hardware, and procedures. Whether in the underlying system, in a security control designed to protect the system, or in the procedures employed in the operational use of the system, the result is the same: a vulnerability represents an exploitable weakness that increases the level of risk associated with the system.
![]()
Vulnerabilities can be fixed, removed, and mitigated. They are part of any system and represent weaknesses that may be exploited.
Threat Vectors
A threat is any circumstance or event with the potential to cause harm to an asset. For example, a malicious hacker might choose to hack your system by using readily available hacking tools. Threats can be classified in groups, with the term threat vector describing the elements of these groups. A threat vector is the path or tool used by an attacker to attack a target. There is a wide range of threat vectors a security professional needs to understand:
![]() The Web (fake sites, session hijacking, malware, watering hole attacks, and so on)
The Web (fake sites, session hijacking, malware, watering hole attacks, and so on)
![]() Unsecured wireless hotspots
Unsecured wireless hotspots
![]() Mobile devices (iOS/Android)
Mobile devices (iOS/Android)
![]() USB (removable) media
USB (removable) media
![]() E-mail (links, attachments, and malware)
E-mail (links, attachments, and malware)
![]() Social engineering (deceptions, hoaxes, scams, and fraud)
Social engineering (deceptions, hoaxes, scams, and fraud)
This list is merely a sample of threat vectors. From a defensive point of view, it is important not to become fixated on specific threats but rather to pay attention to the threat vectors. If a user visits a web site that has malicious code, then the nature of the code, although important from a technical viewpoint in one respect, is not the primary concern. The primary issue is the malicious site because it is the threat vector.
Probability/Threat Likelihood
The probability or likelihood of an event is a measure of how often it is expected to occur. From a qualitative assessment, using terms such as frequent, occasionally, rare, and the quantitative measure ARO, the purpose is to allow scaling based on frequency of an event. Determining the specific probabilities of security events with any accuracy is a nearly impossible feat. What is important in the use of probabilities and likelihoods is the relationship they have with respect to determining relative risk. Just as an insurance company cannot tell you when you will have an accident, no one can predict when a security event will occur. What can be determined is that over some course of time—say, the next year—a significant number of users will click malicious links in e-mails. The threat likelihood of different types of attacks will change over time. Years ago, web defacements were all the rage. Today, spear phishing and ransomware are more prevalent.
The use of insurance-type actuarial models for risk determination is useful when risks are independent, such as in auto accidents. However, controls need to be added when a factor becomes less independent, such as a bad driver. In cybersecurity, once an attack is successful, it is repeatedly employed against a victim, breaking any form of independence and making the probability equal to 1. This lessens the true usefulness of the insurance-type actuarial models in cybersecurity practice.
When risk is examined, the probability or threat likelihood plays a significant role in the determination of risk and mitigation options. In many cases, the likelihood is treated as certain, and for repeat attacks, this may be appropriate, but it certainly is not universally true.
Risks Associated with Cloud Computing and Virtualization
When examining a complex system such as a cloud or virtual computing environment from a risk perspective, several basic considerations always need to be observed. First, the fact that a system is either in the cloud or virtualized does not change how risk works. Risk is everywhere, and changing a system to a new environment does not change the fact that there are risks. Second, complexity can increase risk exposure.
There are specific risks associated with both virtualization and cloud environments. Having data and computing occur in environments that are not under the direct control of the data owner adds both a layer of complexity and a degree of risk. The potential for issues with confidentiality, integrity, and availability increases with the loss of direct control over the environment. The virtualization and cloud layers also present new avenues of attack into a system.
Security is a particular challenge when data and computation are handled by a remote party, as in cloud computing. The specific challenge is how to allow data outside your enterprise and yet remain in control over the use of the data. The common answer is encryption. Through the proper use of encryption of data before it leaves the enterprise, external storage can still be performed securely by properly employing cryptographic elements. The security requirements associated with confidentiality, integrity, and availability remain the responsibility of the data owner, and measures must be taken to ensure that these requirements are met, regardless of the location or usage associated with the data. Another level of protections is through the use of service level agreements (SLAs) with the cloud vendor, although these frequently cannot offer much remedy in the event of data loss.
Additional References
NIST SP 800-53, “Security and Privacy Controls for Information Systems and Organizations,” https://nvlpubs.nist.gov/nistpubs/SpecialPublications/NIST.SP.800-53r5.pdf
NIST SP 800-53B, “Control Baselines for Information Systems and Organizations,” https://nvlpubs.nist.gov/nistpubs/SpecialPublications/NIST.SP.800-53B.pdf
Chapter 20 Review
 Chapter Summary
After reading this chapter and completing the exercises, you should understand the following about risk management.
Use risk management tools and principles to manage risk effectively
![]() Risk management is a key management process that must be used at every level, whether managing a project, a program, or an enterprise.
Risk management is a key management process that must be used at every level, whether managing a project, a program, or an enterprise.
![]() Risk management is also a strategic tool to more effectively manage increasingly sophisticated, diverse, and geographically expansive business opportunities.
Risk management is also a strategic tool to more effectively manage increasingly sophisticated, diverse, and geographically expansive business opportunities.
![]() Common business risks include fraud and management of treasury, revenue, contracts, environment, regulatory issues, business continuity, and technology.
Common business risks include fraud and management of treasury, revenue, contracts, environment, regulatory issues, business continuity, and technology.
![]() Technology risks include security and privacy, information technology operations, business systems control and effectiveness, information systems testing, and management of business continuity, reliability and performance, information technology assets, project risk, and change.
Technology risks include security and privacy, information technology operations, business systems control and effectiveness, information systems testing, and management of business continuity, reliability and performance, information technology assets, project risk, and change.
Explore risk mitigation strategies
![]() Many business processes can be used to mitigate specific forms of risk. These tools include change and incident management, user rights and permission reviews, routine system audits, and the use of technological controls to prevent or alert on data loss.
Many business processes can be used to mitigate specific forms of risk. These tools include change and incident management, user rights and permission reviews, routine system audits, and the use of technological controls to prevent or alert on data loss.
Describe risk models
![]() A general model for managing risk includes asset identification, threat assessment, impact determination and quantification, control design and evaluation, and residual risk management.
A general model for managing risk includes asset identification, threat assessment, impact determination and quantification, control design and evaluation, and residual risk management.
![]() The SEI model for managing risk includes these steps: identify, analyze, plan, track, and control.
The SEI model for managing risk includes these steps: identify, analyze, plan, track, and control.
Explain the differences between qualitative and quantitative risk assessment
![]() Both qualitative and quantitative risk assessment approaches must be used to manage risk effectively, and a number of approaches were presented in this chapter.
Both qualitative and quantitative risk assessment approaches must be used to manage risk effectively, and a number of approaches were presented in this chapter.
![]() Qualitative risk assessment relies on expert judgment and experience by comparing the impact of a threat with the probability of it occurring.
Qualitative risk assessment relies on expert judgment and experience by comparing the impact of a threat with the probability of it occurring.
![]() Qualitative risk assessment can be a simple binary assessment weighing high or low impact against high or low probability. Additional levels can be used to increase the comprehensiveness of the analysis. The well-known red-yellow-green stoplight mechanism is qualitative in nature and is easily understood.
Qualitative risk assessment can be a simple binary assessment weighing high or low impact against high or low probability. Additional levels can be used to increase the comprehensiveness of the analysis. The well-known red-yellow-green stoplight mechanism is qualitative in nature and is easily understood.
![]() Quantitative risk assessment applies historical information and trends to assess risk. Models are often used to provide information to decision-makers.
Quantitative risk assessment applies historical information and trends to assess risk. Models are often used to provide information to decision-makers.
![]() A common quantitative approach calculates the annualized loss expectancy from the single loss expectancy and the annualized rate of occurrence (ALE = SLE × ARO).
A common quantitative approach calculates the annualized loss expectancy from the single loss expectancy and the annualized rate of occurrence (ALE = SLE × ARO).
![]() It is important to understand that it is impossible to conduct a purely quantitative risk assessment, but it is possible to conduct a purely qualitative risk assessment.
It is important to understand that it is impossible to conduct a purely quantitative risk assessment, but it is possible to conduct a purely qualitative risk assessment.
Use risk management tools
![]() Numerous tools can be used to add credibility and rigor to the risk assessment process.
Numerous tools can be used to add credibility and rigor to the risk assessment process.
![]() Risk assessment tools help identify relationships, causes, and effects. They assist in prioritizing decisions and facilitate effective management of the risk management process.
Risk assessment tools help identify relationships, causes, and effects. They assist in prioritizing decisions and facilitate effective management of the risk management process.
Examine risk management best practices
![]() Explore business continuity concepts.
Explore business continuity concepts.
![]() Explore the relationships between vulnerabilities, threat vectors, probabilities, and threat likelihoods as they apply to risk management.
Explore the relationships between vulnerabilities, threat vectors, probabilities, and threat likelihoods as they apply to risk management.
![]() Understand the differences between risk avoidance, transference, acceptance, mitigation, and deterrence.
Understand the differences between risk avoidance, transference, acceptance, mitigation, and deterrence.
Key Terms
annualized loss expectancy (ALE) (763)
annualized rate of occurrence (ARO) (788)
asset (762)
availability (767)
business impact analysis (BIA) (772)
compensating (770)
configuration control (778)
control (763)
control baseline (767)
control type (769)
corrective (770)
countermeasure (763)
detective (770)
exposure factor (763)
externality (763)
force majeure (763)
hazard (763)
impact (762)
intangible impact (781)
mitigate (763)
moral hazard (763)
physical (770)
qualitative risk assessment (763)
quantitative risk assessment (763)
residual risk (782)
risk (762)
risk analysis (762)
risk assessment (762)
risk management (762)
risk register (789)
safeguard (763)
security controls (767)
single loss expectancy (SLE) (763)
systematic risk (763)
tangible impact (781)
threat (762)
threat actor (762)
threat vector (762)
unsystematic risk (763)
vulnerability (762)
Key Terms Quiz
Use terms from the Key Terms list to complete the sentences that follow. Don’t use the same term more than once. Not all terms will be used.
1. Asset value × exposure factor = _______________.
2. A control may also be called a(n) ______________ or a(n) _______________.
3. When a threat exploits a vulnerability, you experience a(n) _______________.
4. Single loss expectancy × annualized rate of occurrence = _______________.
5. If you reduce the likelihood of a threat occurring, you _______________ the risk.
6. The _______________ measures the magnitude of the loss of an asset.
7. Risk analysis is synonymous with ____________.
8. Any circumstance or event with the potential to cause harm to an asset is a(n) _______________.
9. A characteristic of an asset that can be exploited by a threat to cause harm is its _______________.
10. A(n) _______________ is a circumstance that increases the likelihood or probable severity of a loss.
Multiple-Choice Quiz
1. Which of the following correctly defines qualitative risk management?
A. The process of objectively determining the impact of an event that affects a project, program, or business
B. The process of subjectively determining the impact of an event that affects a project, program, or business
C. The loss that results when a vulnerability is exploited by a threat
D. To reduce the likelihood of a threat occurring
2. Which of the following correctly defines risk?
A. The risk still remaining after an iteration of risk management
B. The loss that results when a vulnerability is exploited by a threat
C. Any circumstance or event with the potential to cause harm to an asset
D. The possibility of suffering harm or loss
3. Single loss expectancy (SLE) can best be defined by which of the following equations?
A. SLE = annualized loss expectancy × annualized rate of occurrence
B. SLE = asset value × exposure factor
C. SLE = asset value × annualized rate of occurrence
D. SLE = annualized loss expectancy × exposure factor
4. Which of the following correctly defines annualized rate of occurrence?
A. How much an event is expected to cost per year
B. A measure of the magnitude of loss of an asset
C. On an annualized basis, the frequency with which an event is expected to occur
D. The resources or information an organization needs to conduct its business
For questions 5 and 6, assume the following: The asset value of a small distribution warehouse is $5 million, and this warehouse serves as a backup facility. Its complete destruction by a disaster would take away about 1/5 of the capability of the business. Also assume that this sort of disaster is expected to occur about once every 50 years.
5. Which of the following is the calculated single loss expectancy (SLE)?
A. SLE = $25 million
B. SLE = $1 million
C. SLE = $2.5 million
D. SLE = $5 million
6. Which of the following is the calculated annualized loss expectancy (ALE)?
A. ALE = $50,000
B. ALE = $1 million
C. ALE = $20,000
D. ALE = $50 million
7. When discussing qualitative risk assessment versus quantitative risk assessment, which of the following is true?
A. It is impossible to conduct a purely quantitative risk assessment, and it is impossible to conduct a purely qualitative risk assessment.
B. It is possible to conduct a purely quantitative risk assessment, but it is impossible to conduct a purely qualitative risk assessment.
C. It is impossible to conduct a purely quantitative risk assessment, but it is possible to conduct a purely qualitative risk assessment.
D. It is possible to conduct a purely quantitative risk assessment, and it is possible to conduct a purely qualitative risk assessment.
8. Which of the following correctly defines residual risk?
A. The risk still remaining after an iteration of risk management
B. The possibility of suffering a loss
C. The result of a vulnerability being exploited by a threat that results in a loss
D. Characteristics of an asset that can be exploited by a threat to cause harm
9. Which of the following statements about risk is true?
A. A manager can accept the risk, which will reduce the risk.
B. The risk itself doesn’t really change. However, actions can be taken to reduce the impact of the risk.
C. A manager can transfer the risk, which will reduce the risk.
D. A manager can take steps to increase the risk.
10. Which security control is a policy or procedure used to limit physical security risk?
A. Physical
B. Technical
C. Operational
D. Corrective
Essay Quiz
1. You are drafting an e-mail to your risk management team members to explain the difference between tangible assets and intangible assets. Relate potential threats and risk to tangible and intangible impacts. Write a short paragraph that explains the difference and include two examples of each.
2. You have been tasked with initiating a risk management program for your company. The CEO has just asked you to succinctly explain the relationship between impact, threat, and vulnerability. Think quickly on your feet and give a single sentence that explains the relationship.
3. Your CEO now says, “You’ve mentioned that risks always exist. If I take enough measures, can’t I eliminate the risks?” Explain why risks always exist.
4. You are explaining your risk management plan to a new team member just brought on as part of a college internship program. The intern asks, “With respect to impact, what does a threat do to a risk?” How would you answer?
5. The intern mentioned in the previous question now asks you to compare and contrast accepting risk, transferring risk, and mitigating risk. What’s your response?
Lab Projects
• Lab Project 20.1
The asset value of a distribution center (located in the midwestern United States) and its inventory is $10 million. It is one of two identical facilities (the other is in the southwestern United States). Its complete destruction by a disaster would thus take away half of the capability of the business. Also assume that this sort of disaster is expected to occur about once every 100 years. From this, calculate the annualized loss expectancy.
• Lab Project 20.2
You have just completed a qualitative threat assessment of the computer security of your organization, with the impacts and probabilities of occurrence as follows. Properly place the threats in a three-by-three table similar to that shown in Figure 20.5. Which of the threats should you take action on, which should you monitor, and which ones may not need your immediate attention?