
C H A P T E R 4
Quantifying Value
Adopting better practices is about adding value to the development process. Common sense says that development is more effective when you follow sound principles, good practices, established guidelines, and known success paths. Similarly, development is more effective when you avoid erroneous ideas, bad practices, mistaken techniques, and failure paths. Unfortunately, common sense is not common practice. Switching to a new and different practice involves a change away from current habits and routines. To provide motivation, it is important and often necessary to quantify the value of a better practice.
This chapter presents the different stakeholder perspectives and how those perspectives influence the perceived benefits of changing a practice. The goal is to learn and understand what each individual or group values. Later, the sources of data are discussed. This includes quantitative and qualitative data, anecdotal evidence, and testimony. The emphasis is on how the data needs to be related back to the audience and their values.
As an individual developer, quantifying the value of adopting a new or different practice is important to justify or explain the change. For example, if you are adopting unit testing, quantifying the value in terms of a lower defect count could strengthen the perceived benefits. As a team leader, decisions you make to adopt a better practice should result in noticeable value for the time it takes to implement the change.
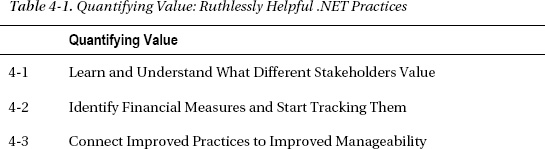
Although this chapter is written from the perspective of someone sitting on the outside of your situation, it is intended to be more than just consultative. However, without knowing your circumstances it is hard to connect in a way that is emotionally relevant to you. In practice, change that comes from inside the project and the organization is better received and longer lasting. The insider-champion helps break the emotional barriers and implements and sustains the change from within. You and your team members are the insiders. Hopefully, you receive this information as a renewed call to get concerned about and positively influence your projects. This chapter should get you fired up and emotionally involved in ways that serve to gain the support of others. This chapter describes specific practices to help with quantifying the value of adopting better development practices. The practices covered in this chapter are summarized in Table 4-1.
Value
The term value means many things to many people; managers, developers, end-users, and customers. If a manager wants you to quantify the value of following a best practice then it is likely the manager wants an estimate of the financial reward. The manager is looking for a monetary cost-benefit analysis. They are also looking for better ways to manage and control development projects without risking the results they are already getting.
For many developers, the time and effort it takes to implement the practice is a driving cost. Developers want to know the benefits as they relate to getting their work done faster or easier or better. Customers and end-users often look at benefits in terms of more features and better quality. They fear that the practice comes at a cost to them or extends the delivery schedule. They need to know that you appreciate that a new or different practice is not a better practice if it does not fit within the current cost and schedule restraints. Spend the time to learn and understand the values that different stakeholders hold dear and the drawbacks they are concerned about.
![]() Practice 4-1 Learn and Understand What Different Stakeholders Value
Practice 4-1 Learn and Understand What Different Stakeholders Value
In any development project there are many different stakeholders and each person may value different things. Let's put the focus on the following themes:
- Financial benefits
- Improving manageability
- Increasing quality attributes
- More effectiveness
Financial Benefits
In general, executive and senior managers are interested in hearing about financial rewards. These are important to discuss as potential benefits of a sustained, continuous improvement process. They come from long-term investment. Here is a list of some of the bottom-line and top-line financial rewards these managers want to hear about:
- Lower development costs
- Cheaper to maintain, support and enhance
- Additional products and services
- Attract and retain customers
- New markets and opportunities
On the other side of the coin is financial risk. This is usually the source of an unstated objection holding a manager back from approving a change. The implicit assumption is that the practice puts productivity and efficiency at risk. Do not ignore financial risk. Address it head on. Identify potential risks and explain how they are going to be mitigated. Whenever possible, advocate new and different practices that are either no cost or low cost, carry few potential risks, or offer powerful benefits.
Every organization is already tracking financial measures. The information may not be available to you, but you probably have indirect measures. The project manager or the accounting department tracks the total number of hours each person works on a project. Effort, measured in person-hours, is an indirect measure of cost. For example, attempt to find the total person-hours to find, report, fix, track, and verify a typical bug. You will be surprised at the total effort involved with a typical defect. As an individual developer, the fewer defects you create the more money you save the company. As a team lead, multiply that number by the size of your team. Is 20% fewer bugs worth an increase of 30% in development time? A compelling financial argument might be well within your reach.
![]() Practice 4-2 Identify Financial Measures and Start Tracking Them
Practice 4-2 Identify Financial Measures and Start Tracking Them
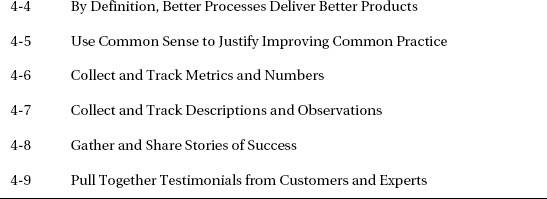
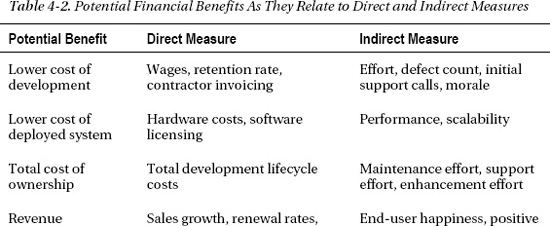
For a small commercial software development company trying to grow, there may be many financial benefits that interest senior management. Table 4-2 lists a number of direct and indirect measures as they relate to potential financial benefits. Starting from the column on the right, identify the indirect measures that are relevant to your organization and start measuring them. New and better practices ought to improve these metrics. Over time, with better practices, the direct measures will probably improve. Test that hypothesis by asking about the direct measures your organization is tracking. If the results are showing up there, you can connect the dots—although it's not likely you will need to.
Improving Manageability
Managers are under pressure to perform. This means that they are responsible for accomplishments through the efforts of others. If a change lowers their team's performance, they can expect to be held accountable for the consequences. This pressure puts the focus on managing and controlling in ways that favor the status quo. Ironically, many new and improved practices could actually help managers become better able to manage and control projects.
Project managers are usually the managers closest to the activities of developers. Functional managers, such as a Director of Development, are also concerned with the day-to-day work of developers. For these managers, important values spring from general management principles, and they seek improvements in the following areas:
- Visibility and reporting
- Control and correction
- Efficiency and speed
- Planning and predictability
- Customer satisfaction
![]() Practice 4-3 Connect Improved Practices to Improved Manageability
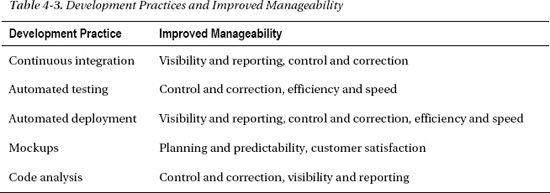
Practice 4-3 Connect Improved Practices to Improved Manageability
Table 4-3 illustrates the relationship between a new development practice and the expected improvement in project manageability. This table is not a comprehensive list of practices and the manageability they offer, but it should provide you with a place to start. The important point is that quantifying the value to many managers is about connecting the development practice to the principles they value. This is especially true if the practice gives them something that they do not already have; the capability to manage and control projects.
Increasing Quality Attributes
End-users and customers are generally interested in deliverables. When it comes to quantifying value they want to know how better practices produce better results for them. To articulate the benefits to end-users and customers, start by focusing on specific topics they value, such as
- More functionality
- Easier to use
- Fewer defects
- Faster performance
- Better support
The message to communicate is that by following better practices the team will produce a better product. That common sense message needs to be supported by enough detail to make it clear that customer satisfaction and quality are the team's goal.
![]() Practice 4-4 By Definition, Better Practices Deliver Better Products
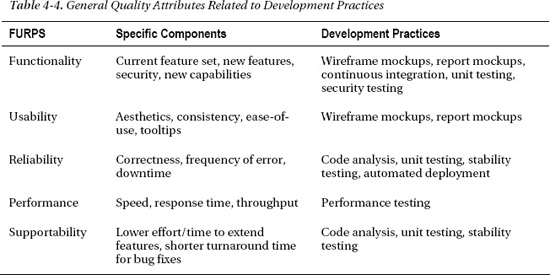
Practice 4-4 By Definition, Better Practices Deliver Better Products
Table 4-4 shows a list of general quality attribute categories. Those in the left-most column are commonly referred to as FURPS: functionality, usability, reliability, performance, and supportability. There are certainly many more, such as localizability. (You can extend the list of categories as needed.) In the column just to the right of the FURPS are examples of specific components within each category. In the right-most column there is a list of development practices that relate to each FURPS category. By presenting specific details in a table, such as Table 4-4, you make it clear to end-users and customers how better development practices deliver better products.
More Effectiveness
Developers and team leads are generally interested in individual and team effectiveness. Quantifying the value of better practices to developers is a lot easier if the emphasis is on increasing effectiveness. The common sense argument is that by following better practices the team will be more effective. In the same way, by avoiding bad practices the team will be more effective. Developers are looking for things to run more smoothly. The list of benefits developers want to hear about includes the following:
- Personal productivity
- Reduced pressure
- Greater trust
- Fewer meetings and intrusions
- Less conflict and confusion
![]() Practice 4-5 Use Common Sense to Justify Improving Common Practice
Practice 4-5 Use Common Sense to Justify Improving Common Practice
Common sense reasoning is certainly not the whole story. Justification has another component. Changing to a new or different practice involves a change in habits. At this point it comes back to knowledge, skill, and attitude. For example, if writing unit tests is not an established habit then getting into the habit takes some time and patience. The need for patience is important. Also, developers ought to have some time to practice and develop skills. Developers need to experience the change before they accept the benefits. Quantify the value of new and different practices by using a combination of common sense arguments and learning by experience.
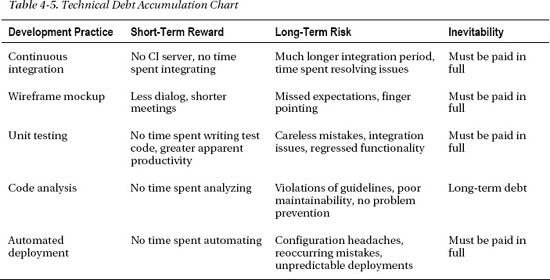
One very good metaphor that makes a lot of sense is the notion of technical debt (introduced in Chapter 2).1 The principle behind technical debt is that many development decisions have implicit or hidden long-term negative consequences that exceed the short-term benefits. The short-term convenience pushes out long-term advantage. A shortcut causes long-term detriment. There is always future reckoning. The consequences of all the accumulated technical debt can be very severe. Technical debt is often taken on without intention. Often it builds up from a lack of awareness, unwillingness to acknowledge the deficit, or understating the potential impact. To be more effective the development team must accumulate technical debt judiciously. Table 4-5 presents one way to chart technical debt as it accumulates. Each development practice is carefully considered, one by one. There are five shown in Table 4-5.
Let's consider the first one, continuous integration, as an example. The development team considers the short-term reward of not practicing continuous integration. Since there is no CI server, there is no time spent setting up and configuring the CI server. Developers save time by deferring and ignoring any potential integration issues; no time is wasted contemplating integration. However, not following the continuous integration practice does have long-term risks. It is likely that there will be a much longer integration period. The team is probably going to spend time resolving issues or redesigning components. The amount of time and effort is both unavoidable and unpredictable. In the end, integration must occur and all integration issues will have to be resolved. It is quite clear that continuous integration offers significant value in areas like problem prevention, better design, and greater predictability.
_____________________
Sources of Data
To quantify something you need data. This section is about identifying and tracking down that data. Let's focus on looking at the following three sources of data:
- Hard numbers
- Observations
- Anecdotes and testimony
Once the data is collected, it needs to be analyzed and understood. The goal is to find the meaning behind the data. Some things to consider:
- Relevant: Is the data related to one or more development practice?
- Correlated: If a practice is changed, is the data changing in an associated way?
- Noticeable: Is a change in a practice going to without a doubt change the data?
With the data and the analysis one or more conclusions are made and the results presented. It is the data that ultimately makes it possible to make and support conclusions that quantify the value of improving development practices.
Quantitative Data
In a broad sense, quantitative data involves numbers that can be measured. Many people feel that quantitative data is hard data because it is numeric and measurable. Since the numbers are collected and quantified, the data seems objective and rational. Quantitative data may be correct as a collection of measurements, but it is the interpretation that gives the data meaning. For example, a method that has a very high cyclomatic complexity (a code quality metric covered in Chapter 11) frequently indicates that the method is hard to maintain, but that is not always the case. If that method contains a very large switch statement then the cyclomatic complexity measure has a high numeric value, but a code review might decide that the method is reasonable and maintainable. The cyclomatic complexity measure prompting a code review is a good thing, but it should not always force a redesign or rewrite.
![]() Practice 4-6 Collect and Track Metrics and Numbers
Practice 4-6 Collect and Track Metrics and Numbers
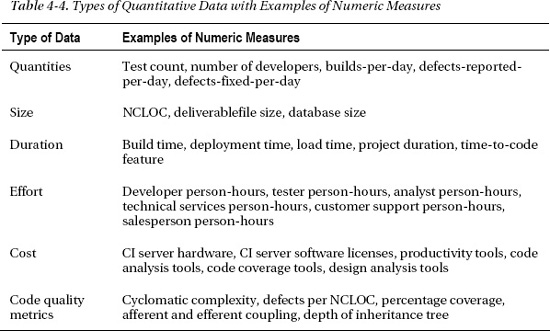
Collecting and tracking quantitative data is valuable; facts are hard to argue with. Table 4-4 presents a list of the types of quantitative data to collect and some example measures. Remember, these numbers are facts. Collect and track this data with the intention of understanding the facts with analysis. They also support decisions, retrospectives, and learning. In Chapter 11 the discussion of static code analysis presents NDepend, which is a product that computes many quantitative measures.2 Tracking these metrics can support manageability. For example, the measure of non-blank, non-commented lines of code (NCLOC) may seem unimportant for development; however, NCLOC correlates to the overall size of the software system. In this way, tracking NCLOC helps to gauge overall progress. Using NCLOC, data can be normalized by calculating various relative-size ratios. It may be helpful to track the total number of unit tests divided by the NCLOC number for the code-under-test. Projects that write a lot of unit tests but only focus on the percentage coverage see a high initial test-count to NCLOC ratio if testing is thorough. If unit testing thoroughness drops dramatically then the ratio drops because unit tests that test boundary conditions and corner cases are being neglected.
_____________________
2 Scott Hanselman provides a great overview of the NDepend metrics in a blog post at www.hanselman.com/blog/EducatingProgrammersWithPlacematsNDependStaticAnalysisPoster.aspx.
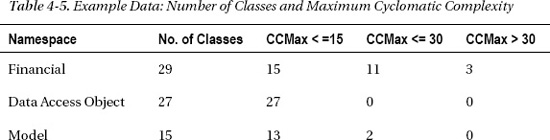
Just as important is how the data is presented and interpreted. Draw careful conclusions. Make sure those conclusions are consistent with everything you know and believe about the circumstances. Shown in Table 4-5 are the counts of the number of classes under six namespaces. The counts are then broken down by ranges of maximum cyclomatic complexity (CCMax). In this example, the guideline is that classes with methods where CCMax is higher than 15 are generally harder to understand and maintain. Classes that have methods with a CCMax higher than 30 are particularly complex and should be split in smaller methods or redesigned. This example data is collected from NCover output reports. Unfortunately, the data in the table is tedious to collect and interpret. Figure 4-1 illustrates the same data in Table 4-5, but it is shown as a dashboard report.
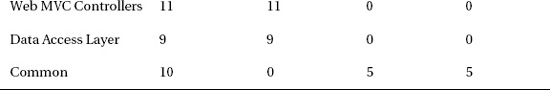
The dashboard report in Figure 4-1 is generated and displayed with the continuous integration server. An MSBuild script reads the NCover XML, processes the data using XPath, and uses XSLT to generate the HTML report. This approach takes the quantitative data and provides an at-a-glance picture, which reveals the code complexity. With this information the team leader knows the classes within both the Financial and Common namespaces that warrant further code review. The project manager has visibility into these areas of complexity and appreciates the need to review the code.
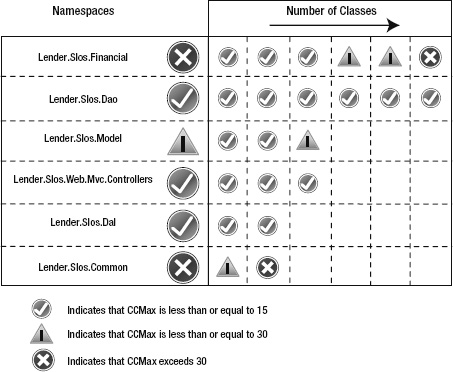
Figure 4-1. Example dashboard: number of classes and maximum cyclomatic complexity
Figure 4-2 illustrates how charting quantitative data helps coordinate between development objectives and management objectives. The solid line is the actual percentage coverage of the unit tests written to test the code developed during the Lender SLOS Upgrade project. The dashed line shows the trend. The developers are working to meet the following code coverage objectives:
- Greater than 60% coverage after 30 working days
- Greater than 75% coverage after 60 working days
- Greater than 85% coverage after 90 working days
Based on the data presented in the chart, there is now a clear retrospective story to relate. The first two objectives are met because of a surge in effort. Tracking the coverage percentage provides positive reinforcement to the developers. The project manager is looking for results and progress in this indicator of structural quality.
The trendline shows three stages of interest. The first is the early stage when developers are learning to write effective unit tests during the first 30 days. The second stage is the leveling off in the 30 to 60 day period. New code and new unit tests are added with continued practice and skill development occurring. The third stage represents a renewed effort based on new approaches and insight into how to write unit test code effectively. After 70 working days the symbol coverage percentage is at 92.9%. This is well ahead of plan.
The practice of code analysis, in this case measuring coverage percentage, is very useful and worthwhile. It is clear that the quantitative data helps explain the value of this practice.

Figure 4-2. Tracking percent coverage over time
Qualitative Data
Qualitative data deals with descriptions that can be observed but not measured. For example, when an end-user looks at a new web page design and describes its appearance, it is qualitative data. The observations are written down and compiled into a qualitative assessment. Qualitative data is subjective. Surveys are an effective way to take descriptions and observations and compile the results into charts and statistics. In effect, the qualitative data is projected into numeric measures. Unfortunately, a good survey is hard to design, conduct, and compile. It is unlikely to be helpful to start a lot of surveying to quantify the value of adopting better practices.
Since qualitative data is useful, a good strategy is to start collecting descriptions and observations. The principle to follow is to ask questions that evoke far-reaching answers. For example, ask the developers: is the source code elegant or is it ugly? Listen to the descriptions that come back in response. You might hear a lot of complaints, but you ought to dig in to gather specifics. Collect and track the descriptions and observations. The responses and discussions are likely to center on general qualitative topics, such as
- Appearance
- Usability
- Satisfaction
- Uncertainty
- Confidence
- Expectation
![]() Practice 4-7 Collect and Track Descriptions and Observations
Practice 4-7 Collect and Track Descriptions and Observations
Table 4-6 provides examples of the kinds of evocative questions that get people relating qualitative descriptions and observations. The question is intended to provoke a response. Capture the response as feedback and qualitative data. Over time, if the better practices are adding value, the responses change. This is an informal survey of key individuals or a consensus opinion. It does not have to be scientific. It is intended to help show a trend in the subjective thinking. Over time, as people feel that they are being heard, the descriptions and observations get more specific and actionable. The important point is that you are tracking the improvements in terms that the respondent values.
Anecdotal Evidence
Anecdotal evidence helps when there is not enough other information available to quantify the value of a practice. An anecdote is a story that describes what happened under a particular set of circumstances. It is a one-sided story. To be evidence, the anecdote must be both true and verifiable. To be useful, the anecdote must provide information that helps the reader draw a meaningful conclusion.
There are two forms of anecdotal evidence that many find convincing: success stories and testimonials. The success story concentrates on the description of the experience, and the testimonial focuses on the credibility or the relevance of the source. Here are three examples of success stories that many managers find convincing:
- Automated testing: With automated testing, a very thorny bug was detected early in the development process and the problem was resolved by fewer people in a shorter amount of time. The bug was resolved before it made it to QA. The issue was resolved in 1.5 hours by the developer who introduced the problem. By most accounts it would have taken several people, both testers and developers, days to reproduce, diagnose, and resolve the issue if it had made it to QA.
- Automated deployments: The new automated deployments are much, much faster than the previous manual deployments. Deployment times have dropped from a range of 8 to 18 hours down to about 2 to 4 hours. The deployments are more reliable and more predictable. Because the maintenance window is shorter, deployments are less inconvenient to the end-user. Today, deployments are a great deal less stressful for the people involved.
- Continuous integration: With unit tests running in the continuous integration server there is now an acknowledgement that failing tests indicate an issue that needs to be addressed immediately. Developers are running all the unit tests proactively, before pushing code changes. They are fixing the code when they discover an unexpected issue. They are discussing the correct long-term solution to integration issues and recommending design changes to the team lead. The whole project team is actively engaged in improving quality, not just the QA testers.
Take the time to gather and compile the stories of success as new or different practices are adopted. Find ways to share the success stories in conversation, through a blog, or in an e-mail. The experiences of your own organization are naturally credible and relevant. Few people argue with success.
![]() Practice 4-8 Gather and Share Stories of Success
Practice 4-8 Gather and Share Stories of Success
A good testimonial needs a credible source and a relevant circumstance. If the testimonial is from an outside expert then that person's expertise and experience ought to be appreciated. If your organization is using Agile then the authors of The Agile Manifesto ought to be credible.3 In Appendix A there is a list of books and articles by many well-respected authors and best practices advocates.
Testimonials from an end-user or customer are often a lot more credible and relevant than the opinion of an outside expert. These are stakeholders. If an end-user is happy with the results then that speaks very loudly. Happy customers are important because customers vote with their checkbook and managers never forget that fact.
![]() Practice 4-9 Pull Together Testimonials from Customers and Experts
Practice 4-9 Pull Together Testimonials from Customers and Experts
Summary
Quantifying value is about knowing what others value and making arguments that make rational sense to them. For many, hard data is crucial. Since there is such variability from situation to situation, the only credible numbers are the ones your organization collects and tracks. It is a good practice to start collecting and tracking some of those numbers and relating them to the development practices that are showing improvements. Beyond the number, there are many observations and descriptions that support the new and different practices. It is time to start describing the success stories and collecting testimonials. Communicate how each improvement is showing results in many positive ways.
In this chapter, you learned about quantifying the benefits of new and different practices. You saw how senior managers, front-line managers, end-users, and developers often have different definitions for the value. Remember that what one group perceives as valuable, another might not value. You learned about the many sources of supporting data. You saw how indirect measures, qualitative data, and anecdotal evidence can blend together. You learned how to make the connections between the development practice, the conclusions from the data, and the values of others.
In the next chapter, you will learn about the importance of the many aspects of strategy. Too often developers are focused on tactical issues and implementing solutions. Strategy is about understanding problems, high-level planning, setting objectives, and gaining important insights. When you truly, fully understand the strategic situation then the better practices present themselves.
_____________________