A P P E N D I X B
Scorecard
A scorecard is any structured report that helps guide and monitor the activities and actions that relate to an initiative. Steve McConnell created the Software Project Survival Test as a way to score software project management1. His test is a scorecard that helps estimate a project's risks and identifies areas for improvement.
In this book, the entire thrust and theme is that you, your team, or your organization is undertaking an initiative to adopt new or different .NET practices. The goal is to achieve positive outcomes through better practices. Having the right scorecard helps in the following ways:
- Establishes a list of valued and relevant practices
- Shows off the practices that are being followed
- Identifies practices that are not being followed
- Helps track and monitor progress
As mentioned in Chapter 1, any choice of a new or different practice ought to be a better practice that is entirely appropriate to your situation. The scorecard presented in this appendix is based on many practices described in the book. The goal is to provide you with an example that is a starting point. Feel free to expand and adapt the scorecard, as appropriate, to suit your circumstances. Certainly cross out any practices that do not make sense or are not applicable. The Excel spreadsheet file SamplesAppBDotNetBestPracticesScorecard.xls is a simple way to track and compute the overall score. To keep things uncomplicated, the scorecard only includes the following practice areas:
- Automated Testing
- Build Automation
- Continuous Integration
- Code Analysis
Within the sections that follow, there are questions that assess the degree to which practices are being followed. Consider each question and provide a score for the answer:
- 5 – Yes, we are completely there.
- 4 – Probably, we are mostly there, or it is almost done.
- 3 – Somewhat, we are making good progress, or there is more to be done.
- 2 – Kind of, we have just started, or there is quite a lot to be done.
- 1 – Planning, we want to start, or it is under investigation.
- 0 – No, not at all.
1 For more information see Steve McConnell, Software Project Survival Guide (Redmond, WA: Microsoft Press, 1998).
The section at the end of this appendix explains how to interpret the score.
Automated Testing
To score this practice area, provide a numeric score to the questions in Tables B-1. The numeric score ranges from 0 through 5, as described at the beginning of this appendix.
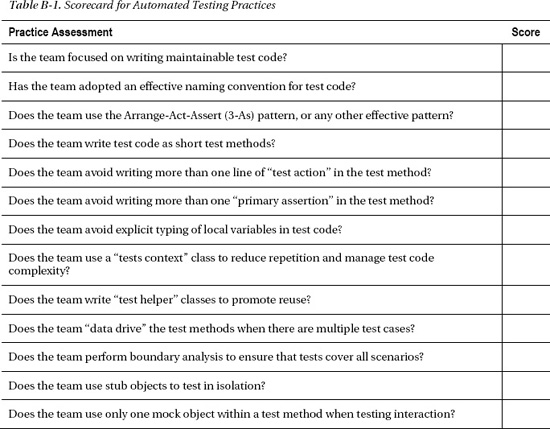
Add up the scores in Table B-1 and enter the section score in the formula below. There are 13 questions in this section. Take the section score, divide it by 65, and multiply the result by 100 to compute a percentage.
![]()
Build Automation
To score this practice area, provide a numeric score to the questions in Tables B-2. The numeric score ranges from 0 through 5, as described at the beginning of this appendix.
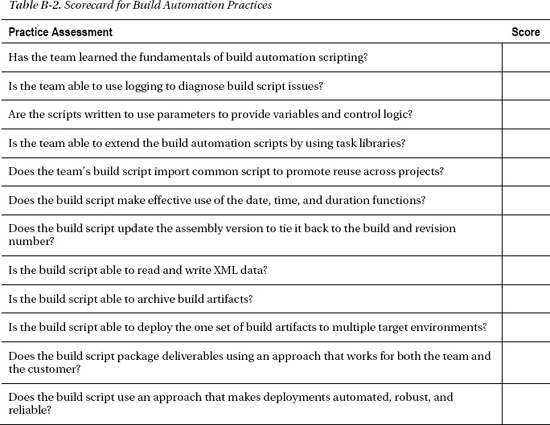
Add up the scores in Table B-2 and enter the section score in the formula below. There are 12 questions in this section. Take the section score, divide it by 60, and multiply the result by 100 to compute a percentage.
Continuous Integration
To score this practice area, provide a numeric score to the questions in Tables B-3. The numeric score ranges from 0 through 5, as described at the beginning of this appendix.
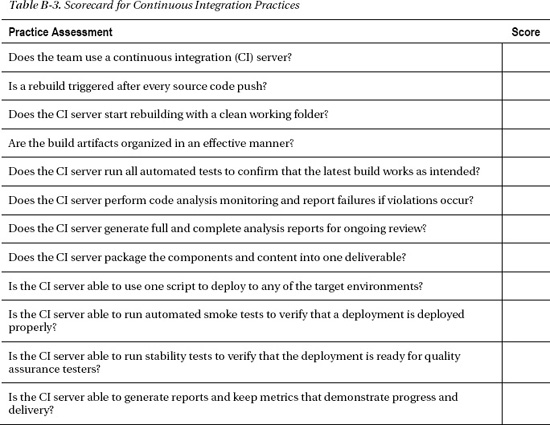
Add up the scores in Table B-3 and enter the section score in the formula below. There are 12 questions in this section. Take the section score, divide it by 60, and multiply the result by 100 to compute a percentage.
![]()
Code Analysis
To score this practice area, provide a numeric score to the questions in Tables B-4. The numeric score ranges from 0 through 5, as described at the beginning of this appendix.
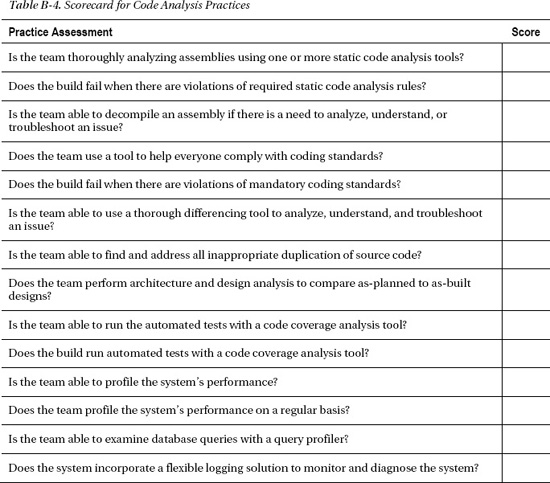
Add up the scores in Table B-4 and enter the section score in the formula below. There are 14 questions in this section. Take the section score, divide it by 70, and multiply the result by 100 to compute a percentage.
![]()
Calculating the Overall Score
To interpret the results you must calculate an overall score. The result is a high-level number that can be used to report and track overall progress. If tracked over the course of a “best practices initiative” this overall score can help management and others quickly see the strides the team is making toward following better practices.
Add up the section scores and enter the total score in the formula below. There are 51 questions in all. Take the total score, divide it by 255, and multiply the result by 100 to compute a percentage.
![]()
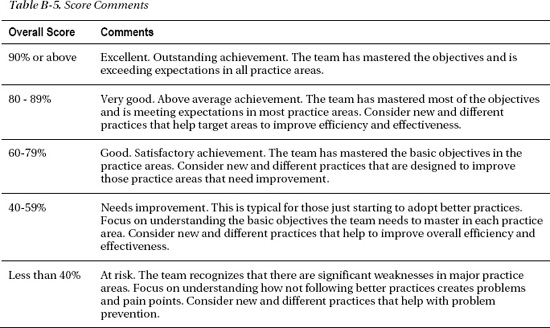
Depending on the overall score, there are some comments that can be made. If the team's score is at 80% or above then congratulations are in order. If the team's score is at or above 60% but is below 80% then that is good, although there are improvements to be made. If the score is below 60%, there is much work to do. The good news is that you are motivated to learn and adopt better practices. Further comments are in the breakdown shown in Table B-5.