SQL Server 2022 has functionality, which helps you to manage your SQL Server estate in a hybrid environment, meaning that you can centralize administration and gain some of the benefits of cloud, even for your on-premises SQL Server estate.
In this chapter, we will explore hybrid features that become available, once we have registered a SQL Server instance with Azure ARC—a technology that allows you to view remote infrastructure resources, as if they were hosted in Azure. These features include environmental health/SQL Best Practice Assessment (SQL BPA) and Microsoft Defender for Cloud.
Examples in this chapter require Log Analytics Workspace to be configured. Log Analytics Workspace is an Azure feature for collecting and analyzing metrics and logs. It is a large topic and a full discussion is beyond the scope of this book. A tutorial is supplied by Microsoft, however, and can be found at https://learn.microsoft.com/en-us/azure/azure-monitor/logs/log-analytics-tutorial.
Hybrid Management
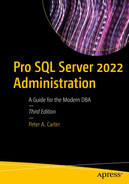
Integrating a Server and a SQL Server instance with Azure Arc allows you to manage a resource as if it were natively in Azure. The server could actually be located on-premises, or even in another cloud provider. For example, the server that is used in the examples, within this chapter, is built in AWS.
It is possible to generate a script, from Azure, that can be run on a server in a different environment, which will onboard a SQL Server instance into Azure Arc. If you are using SQL Server 2022, however, then Arc integration is embedded into the instance setup. This is discussed in Chapter 2.
SQL VM in Azure Arc
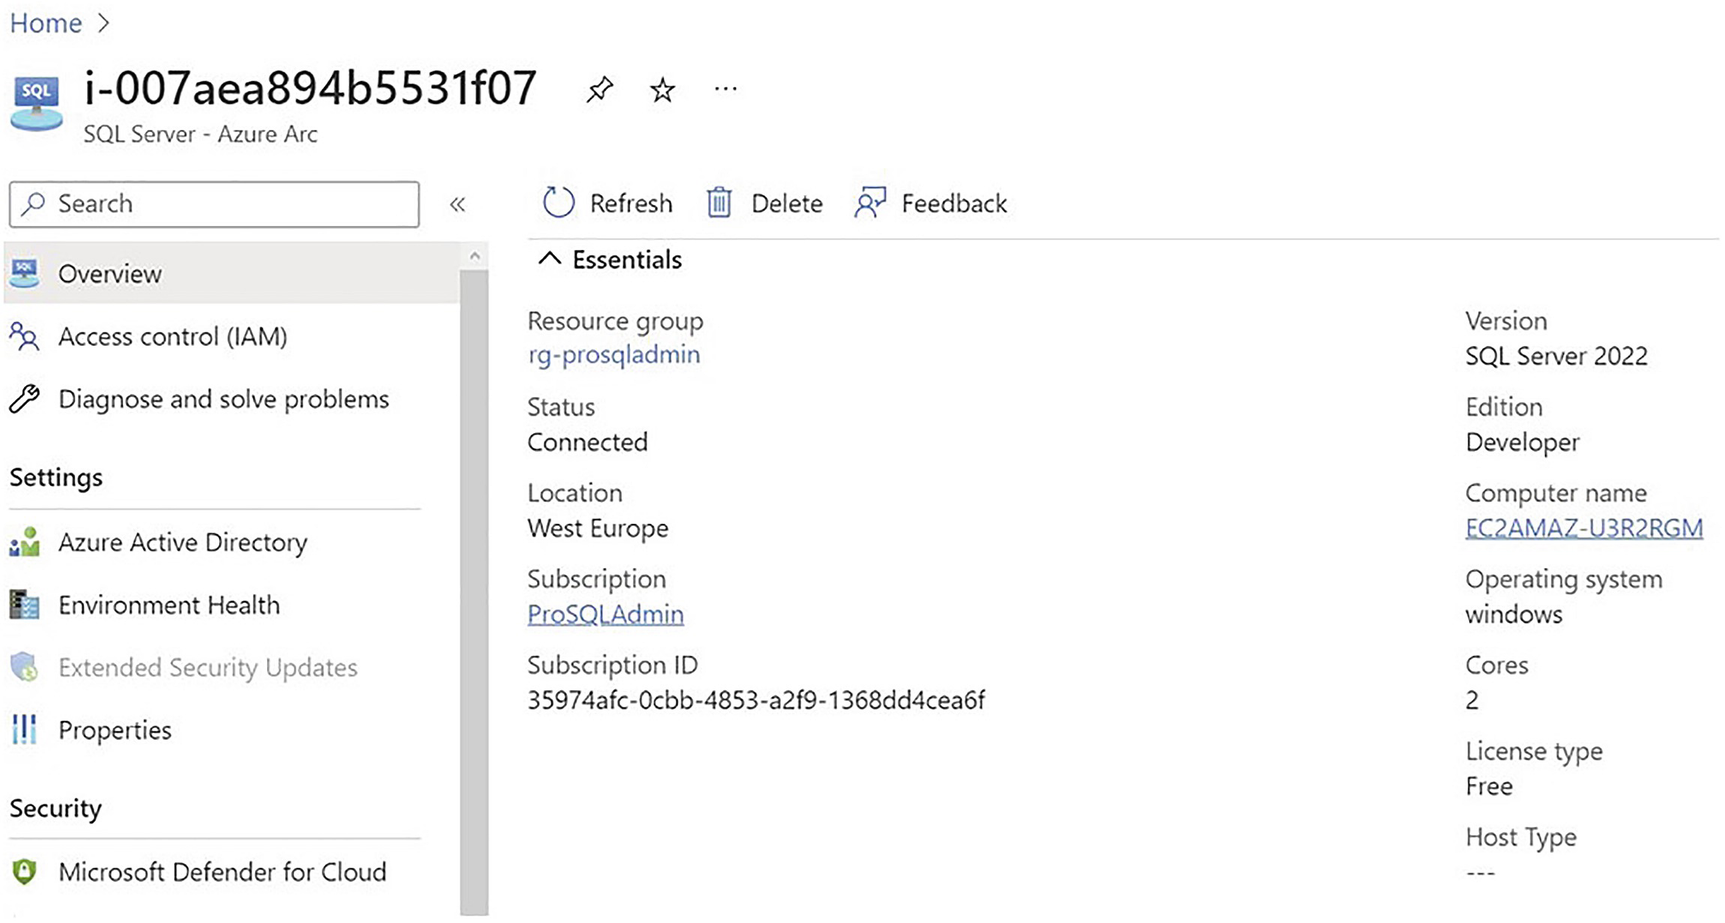
Azure Arc heartbeat
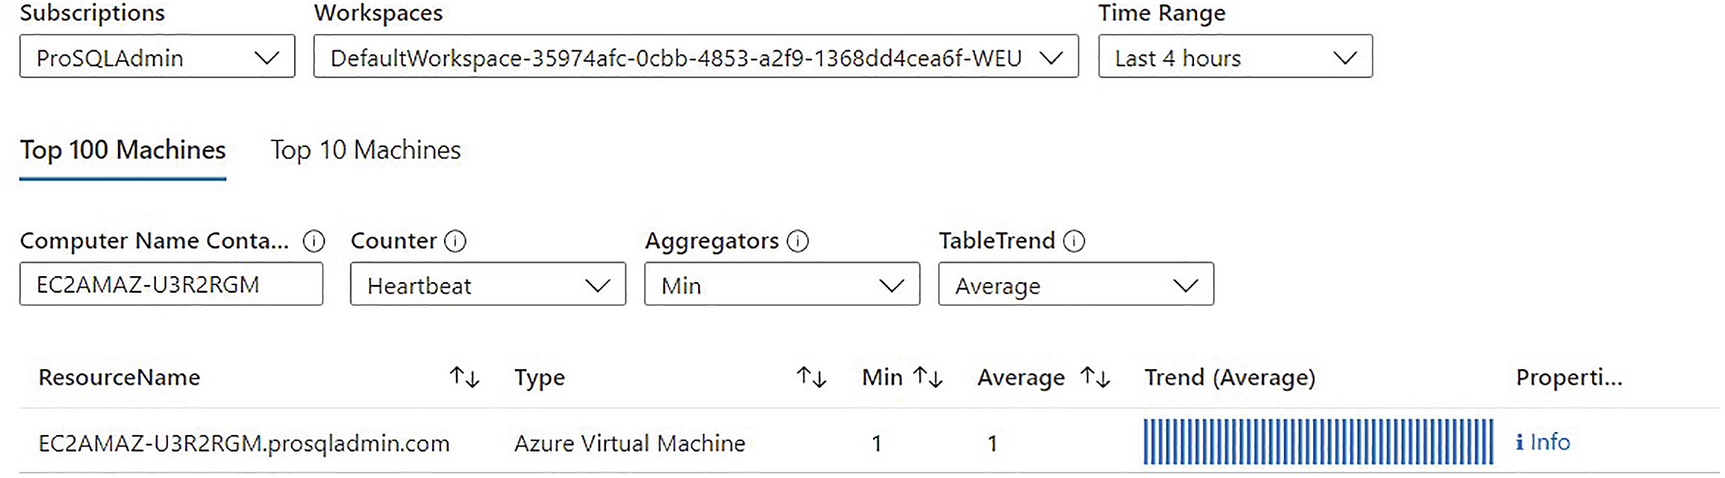
Once onboarded, various Azure management options become available. Some of these options, such as Environmental Health and Defender for Cloud, are discussed in the following sections.
Environmental Health and SQL Best Practice Assessment
At the time of writing, Environmental Health is in a period of transition. Azure SQL VMs have transitioned to SQL Best Practice Analyzer (SQL BPA), whereas VMs onboarded through Azure Arc still use the older Environment Health feature. The two features are very similar. They use the same agent and are configured in the same way. Because the focus of this chapter is on Azure Arc, I will discuss the setup process for Environment Health, as this will be transferable. The real difference between the features is that SQL BPA provides a much richer reporting experience. Therefore, when we look at using the report, I will switch to SQL BPA, as this is what you will most likely see at the time of reading.
Environmental Health/SQL BPA run hundreds of tests against a VM running SQL Server, the SQL Server instance, and the databases hosted within the instance to check for good practice configuration, throughout the stack.
Available Capabilities
Install the Microsoft Monitoring Agent
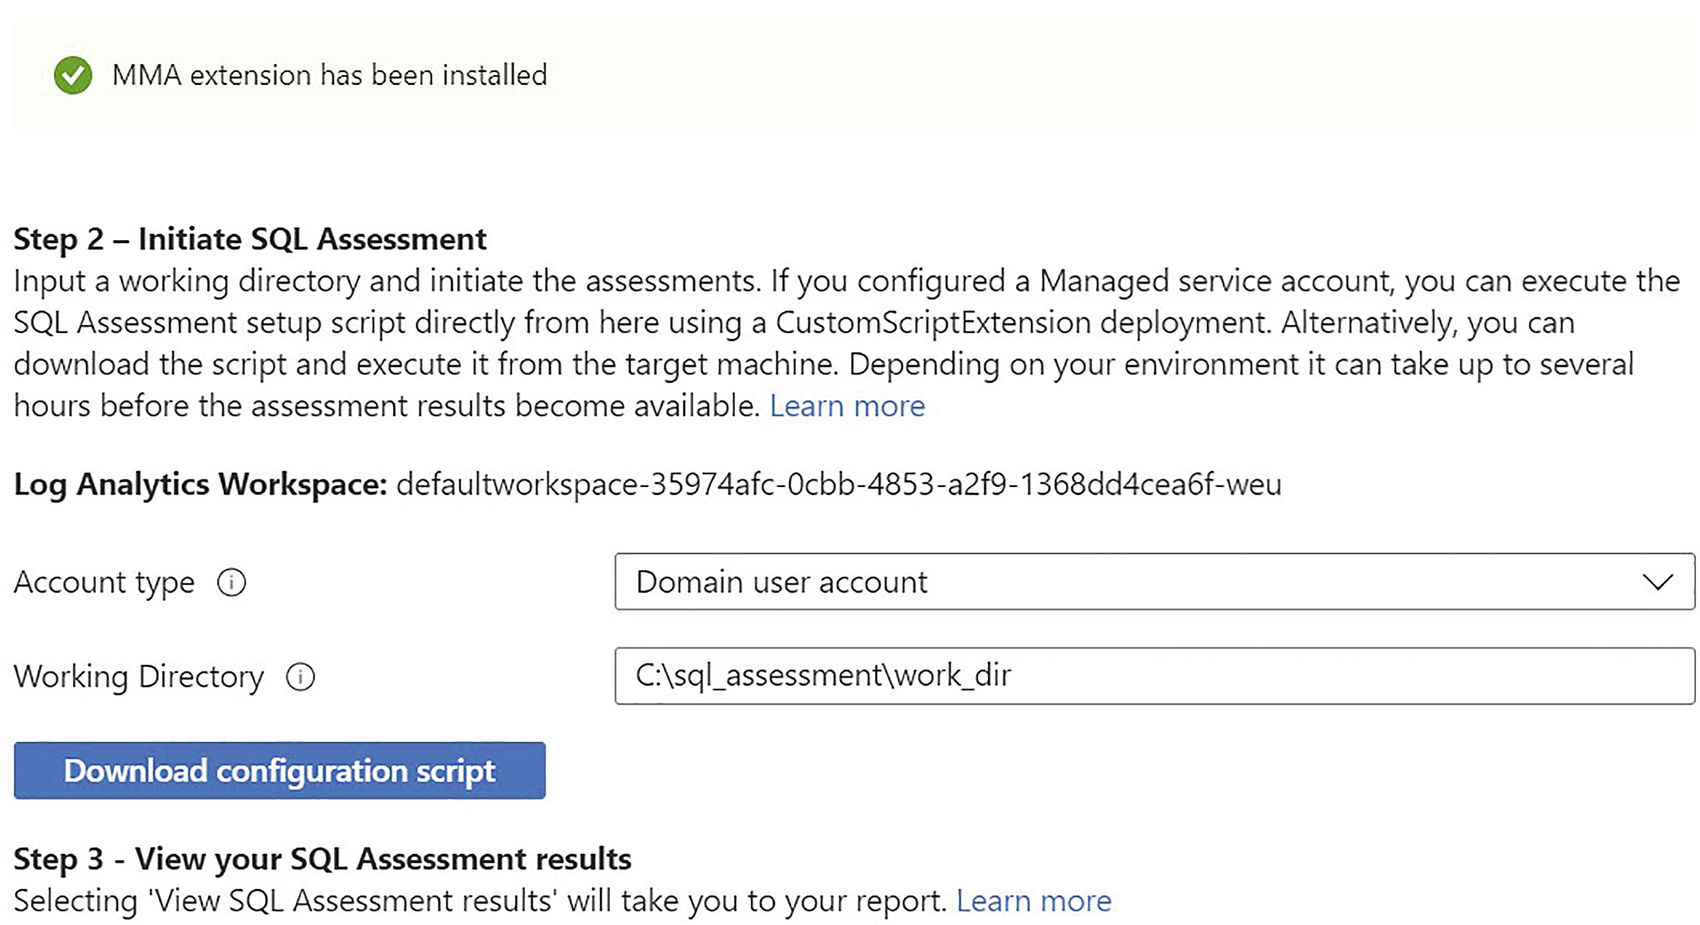
Environmental health configuration
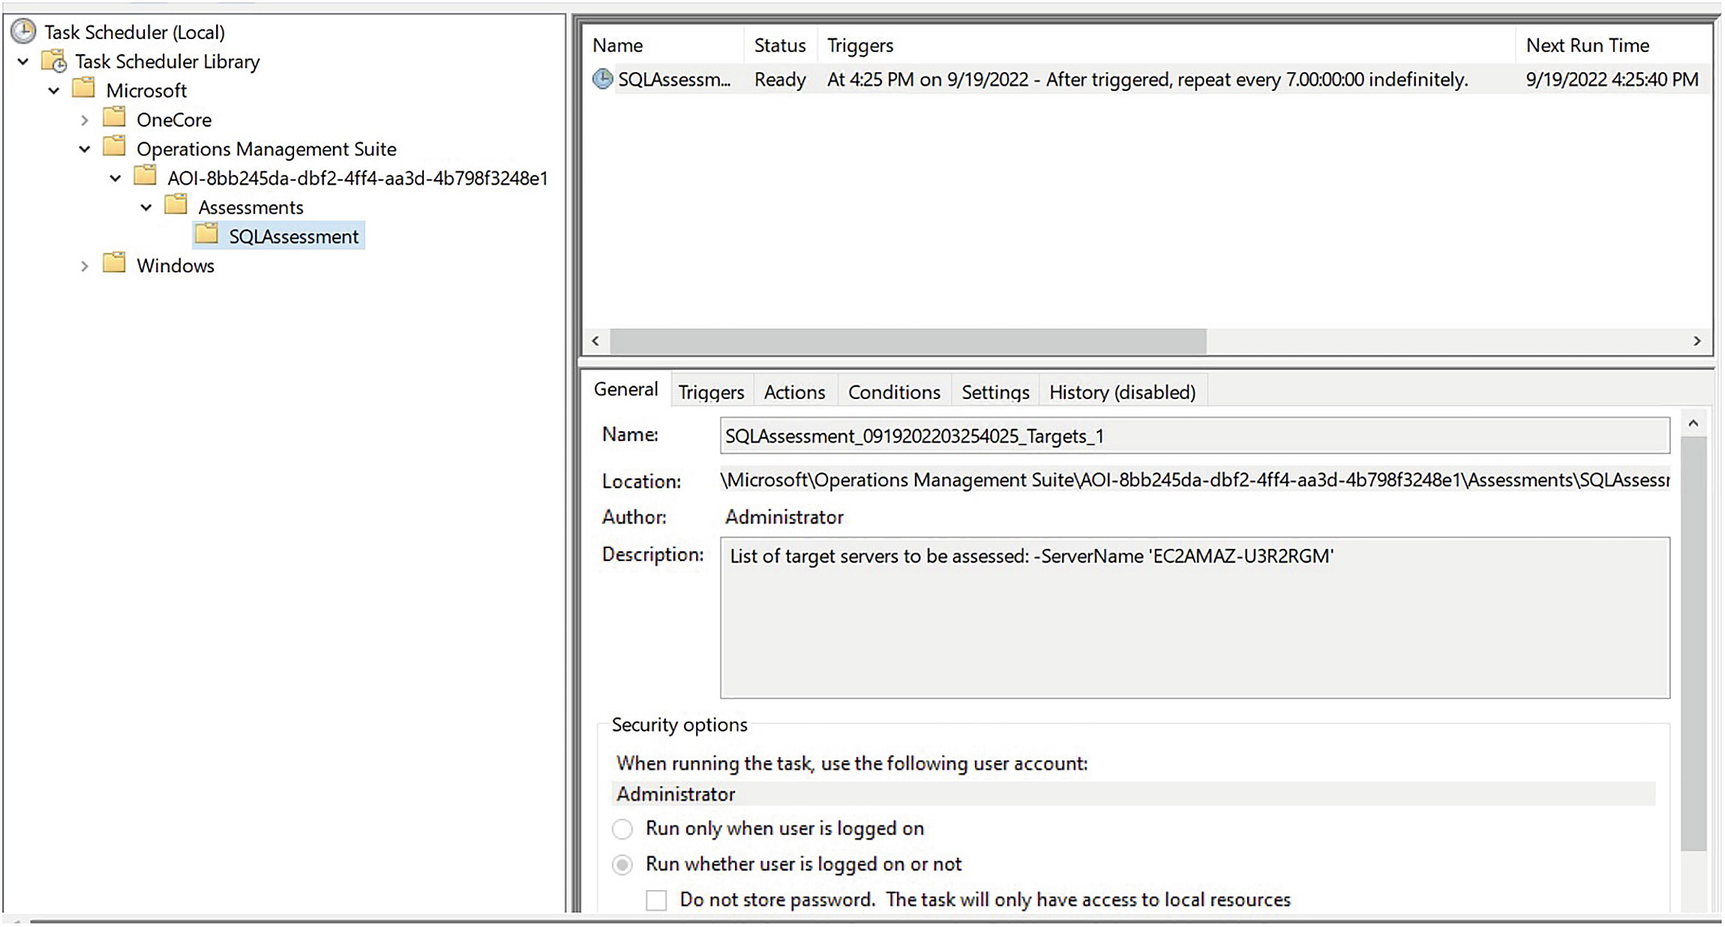
SQL Assessment Scheduled Task
By default, the Logon as a batch job user rights assignment is assigned to administrators anyway. If your organization has a strict security stance, however, you may need to specifically assign the user rights assignment, using the Local Security Policy console.
For reference, Listing 21-2 shows the script that can be downloaded from the Azure portal. If you are comfortable with PowerShell, then you can just use the commands manually, as opposed to downloading the script.
Both the Microsoft Management Agent and the sqlserver PowerShell module must be installed on the target server.
Script to Create Scheduled Task
Figure 21-5 shows the Scheduled Task that is created.
Microsoft advise that it can take up to 24 hours for the assessment to register in Azure, but in my experience, it usually appears within an hour.
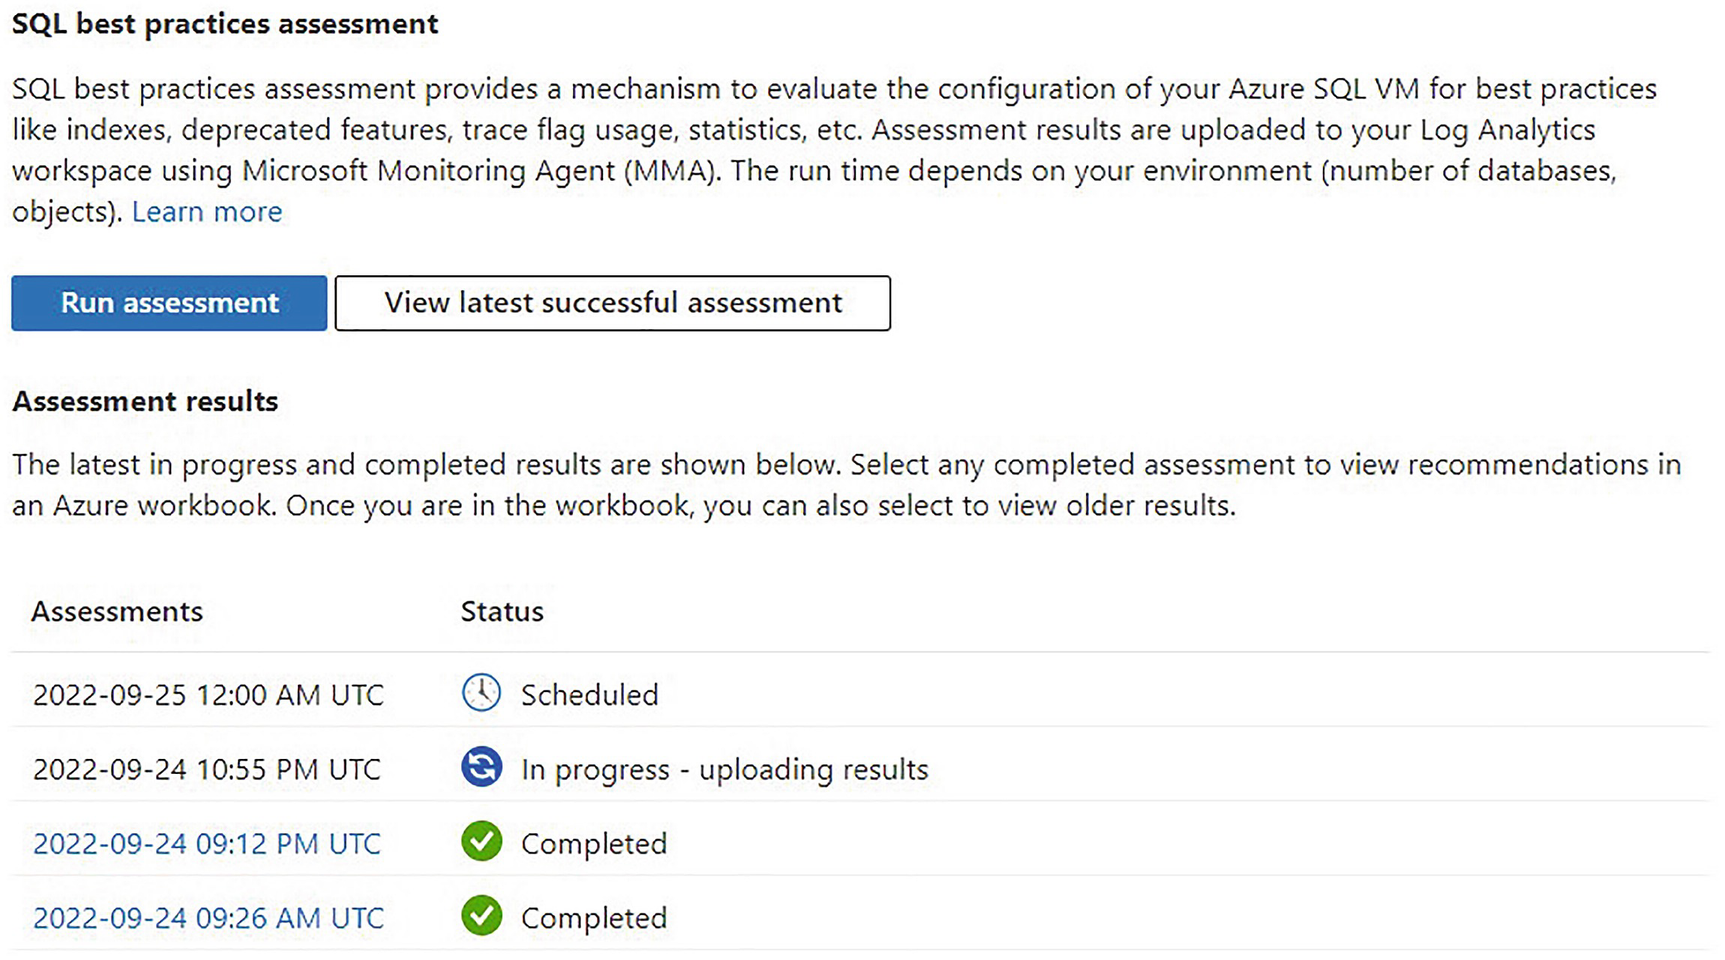
SQL BPA front page
Remember, we are now switching to SQL BPA, instead of Environmental Health, to discuss the reports.
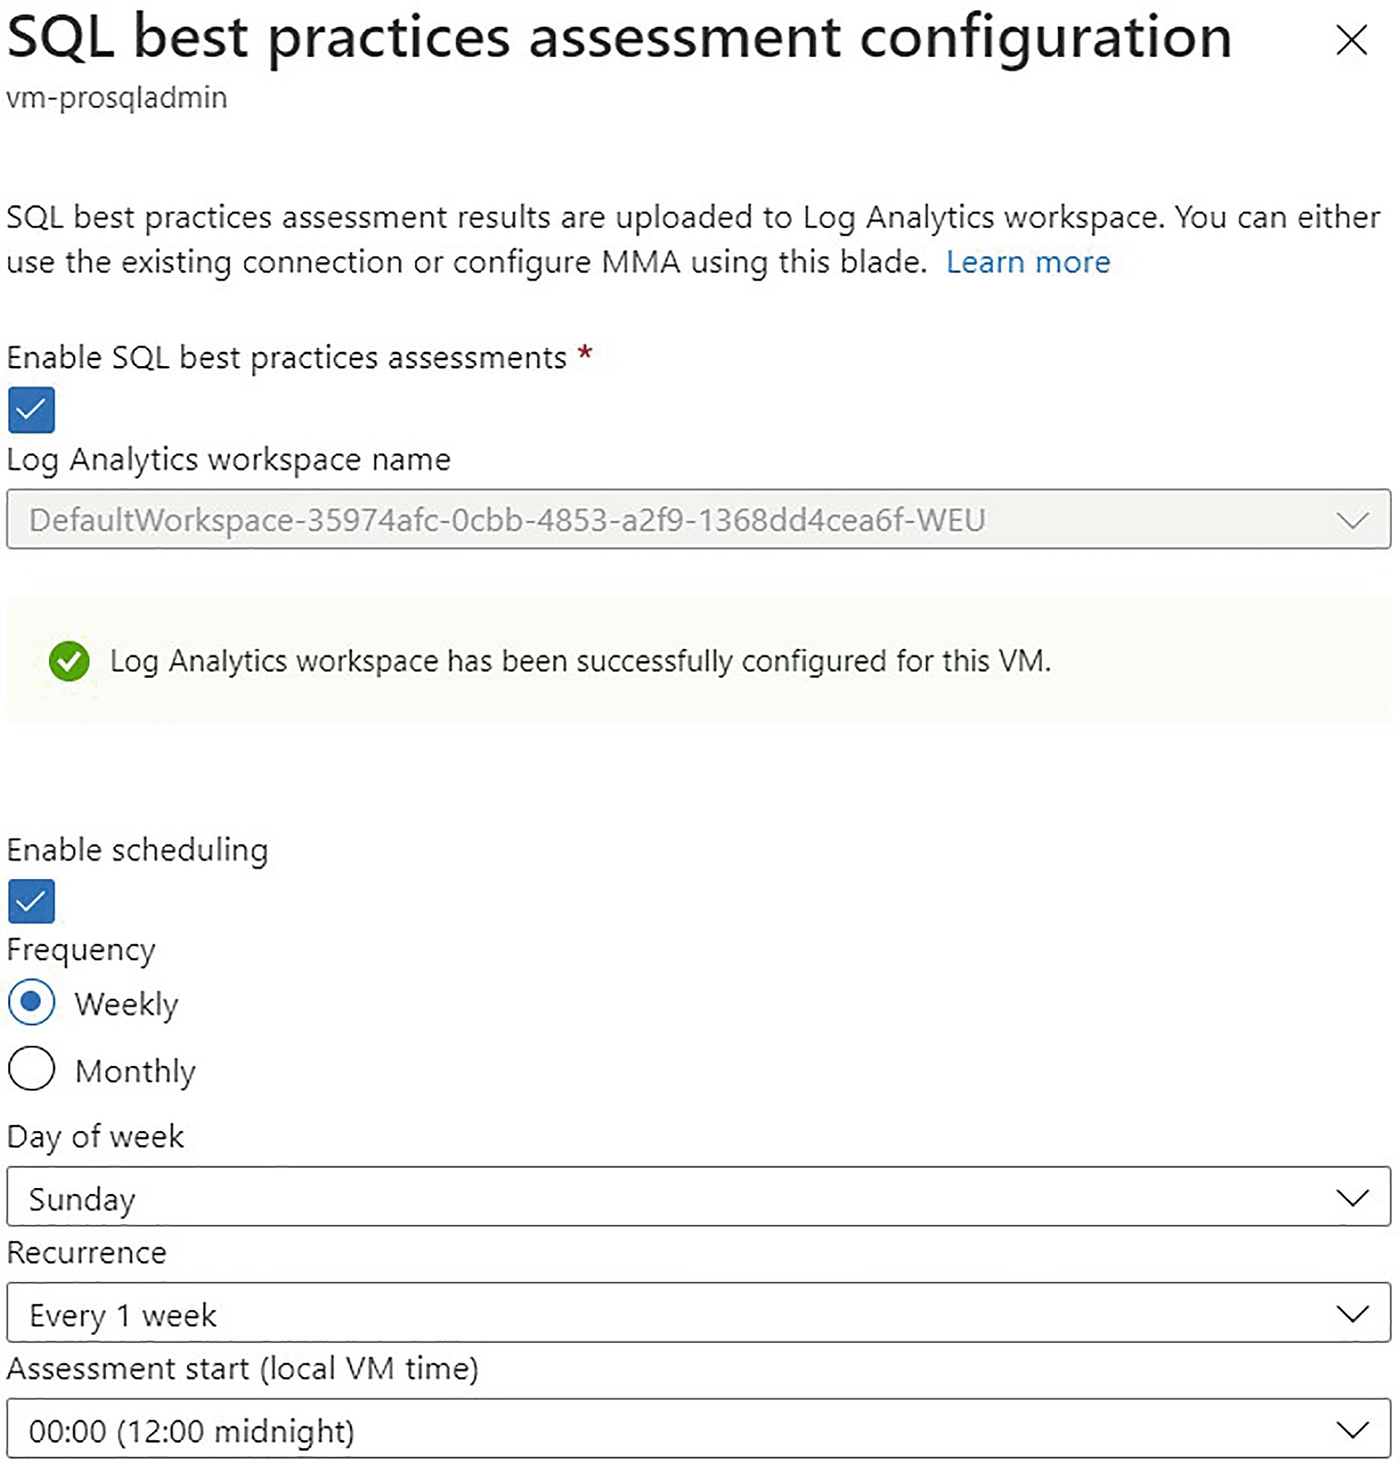
SQL BPA configuration

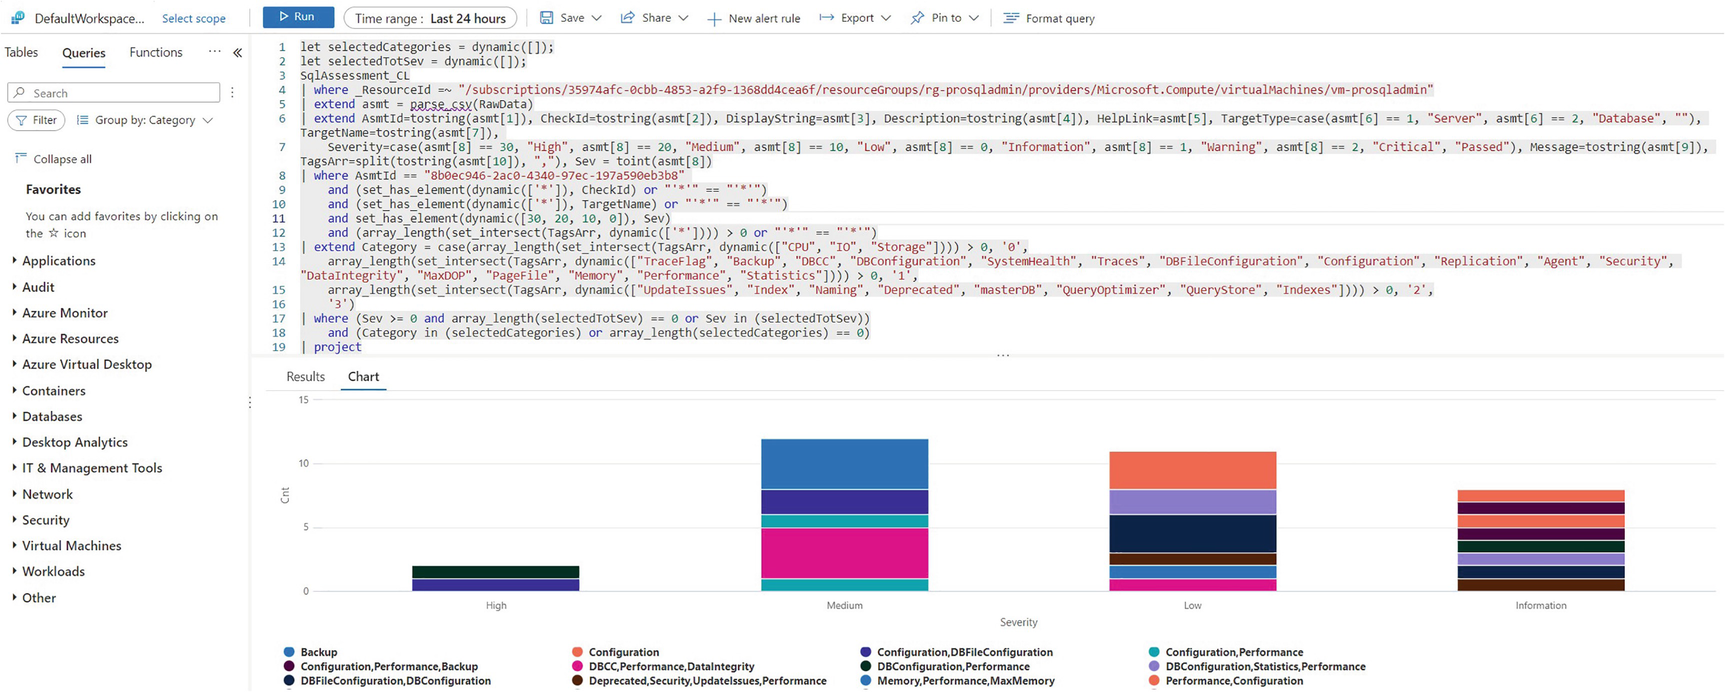
SQL BPA report
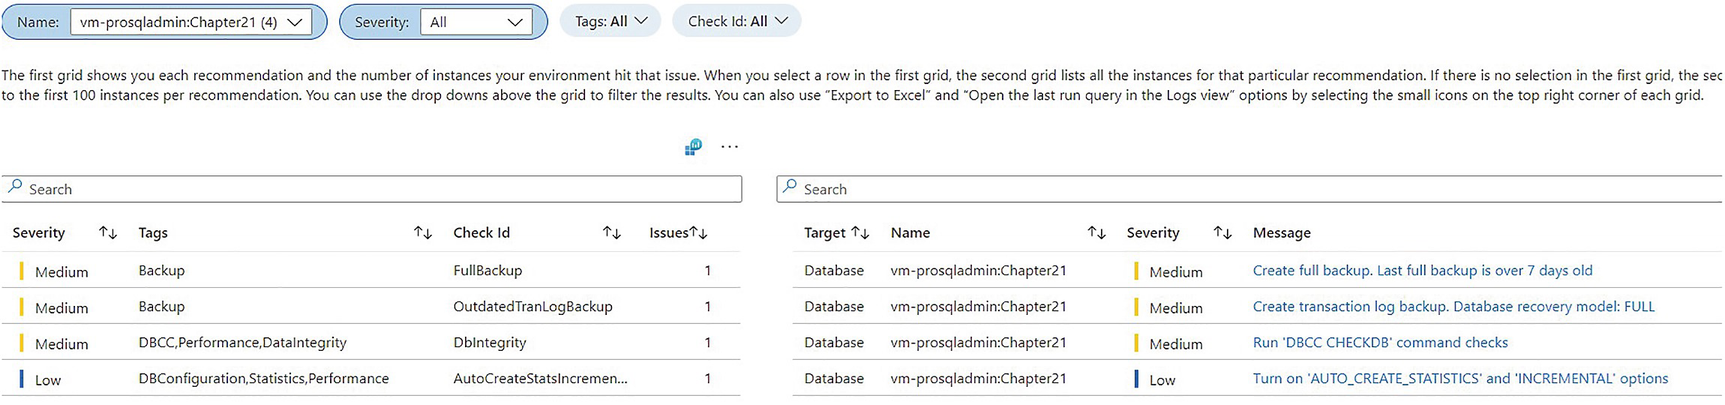
SQL BPA report filtered for Chapter21 database
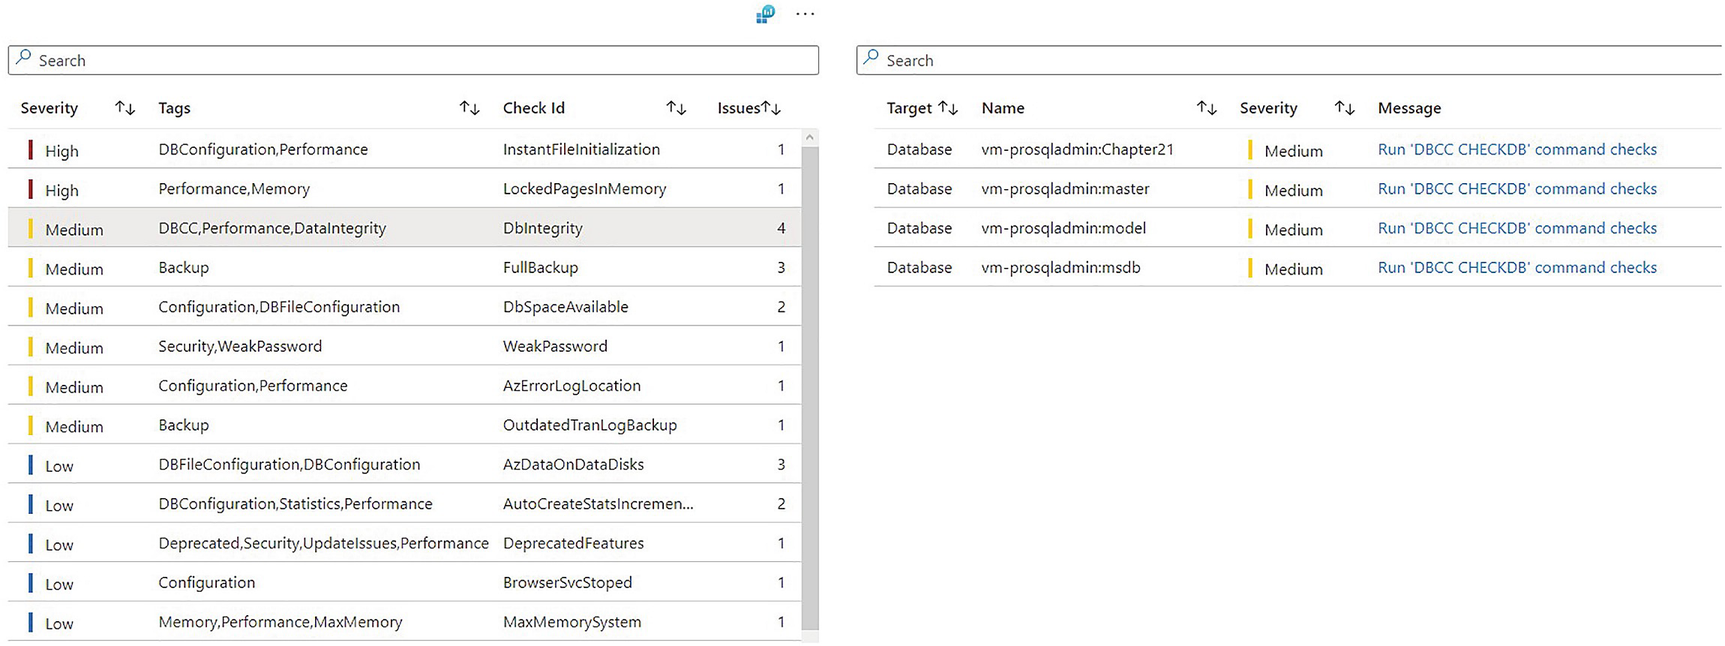
SQL BPA filtered by check
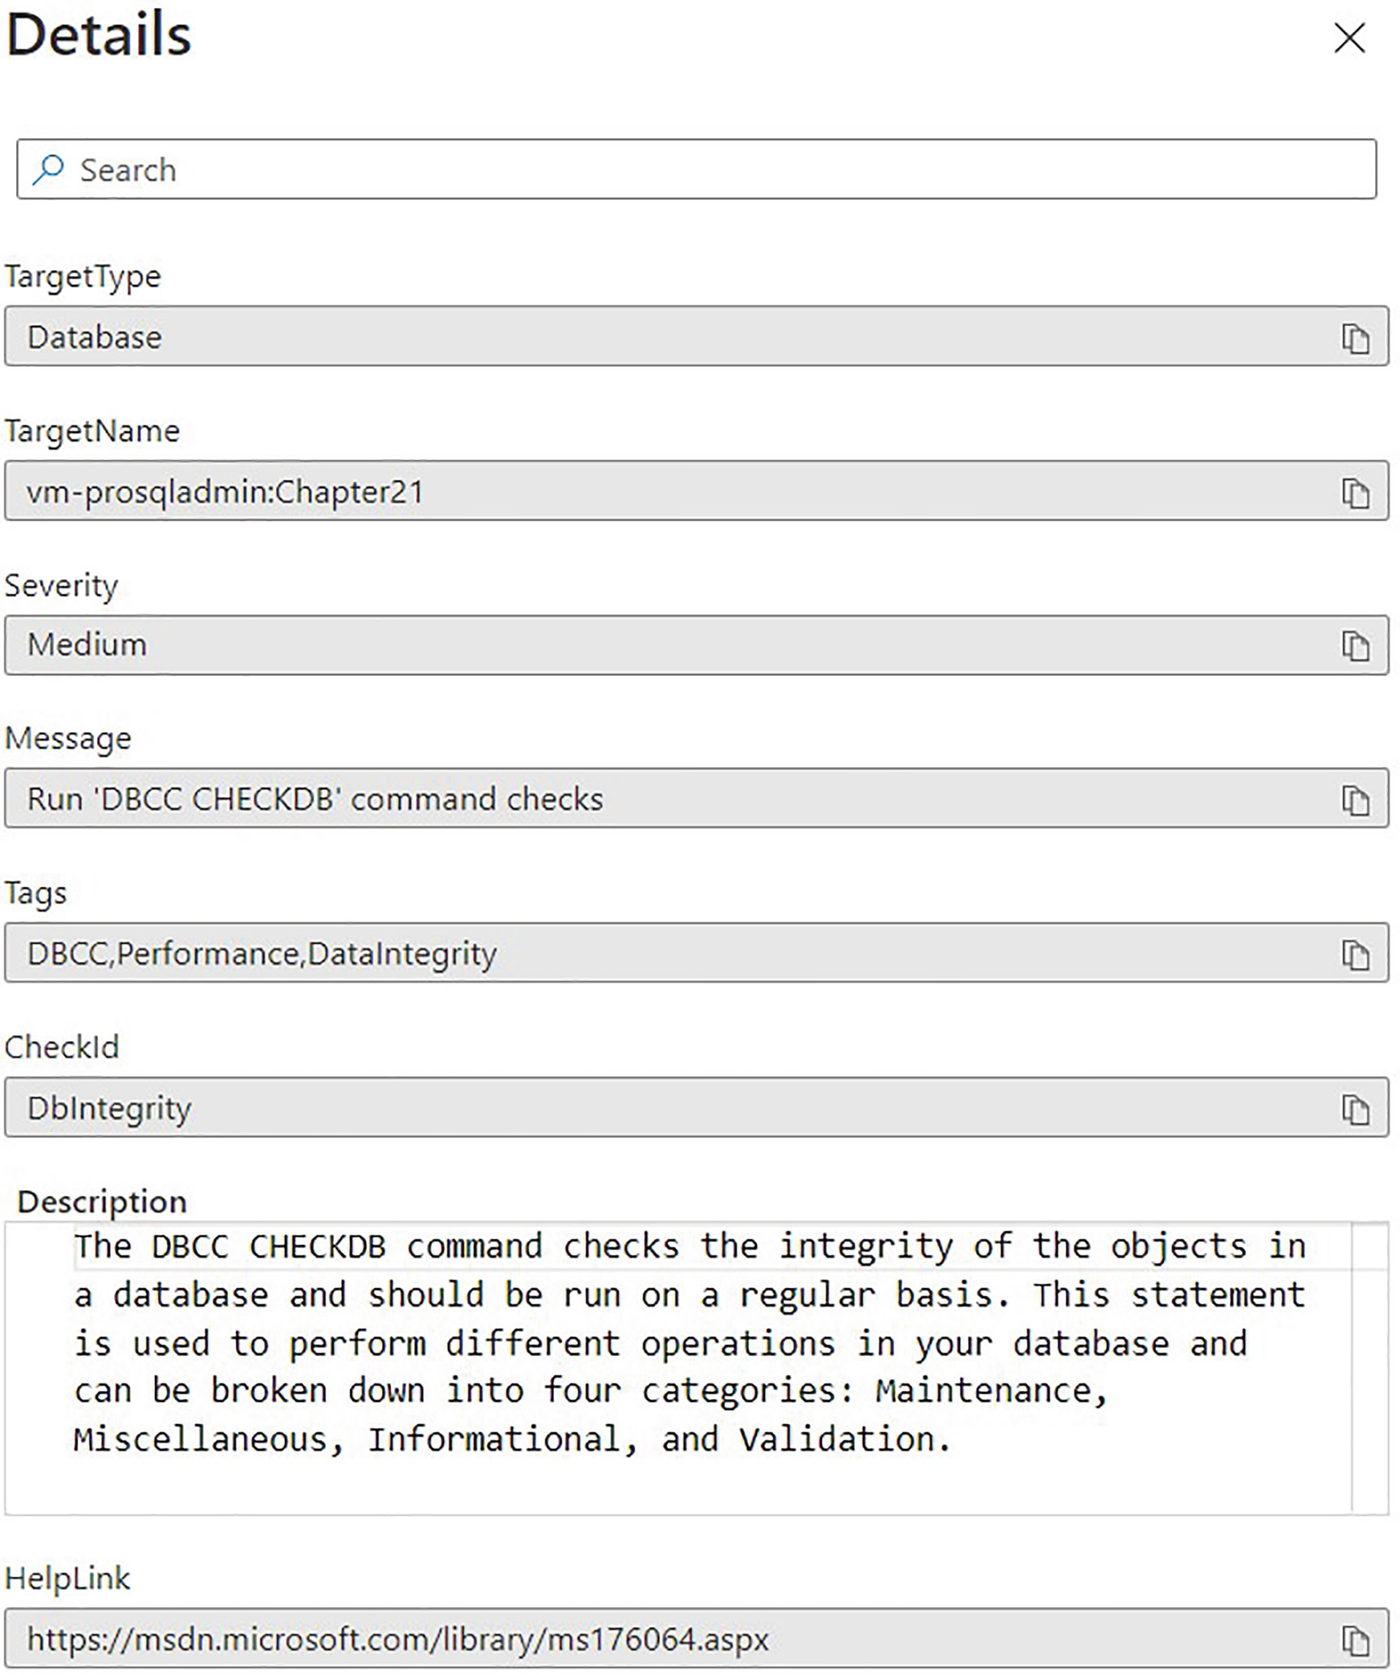
Message details
SQL BPA Issues tab

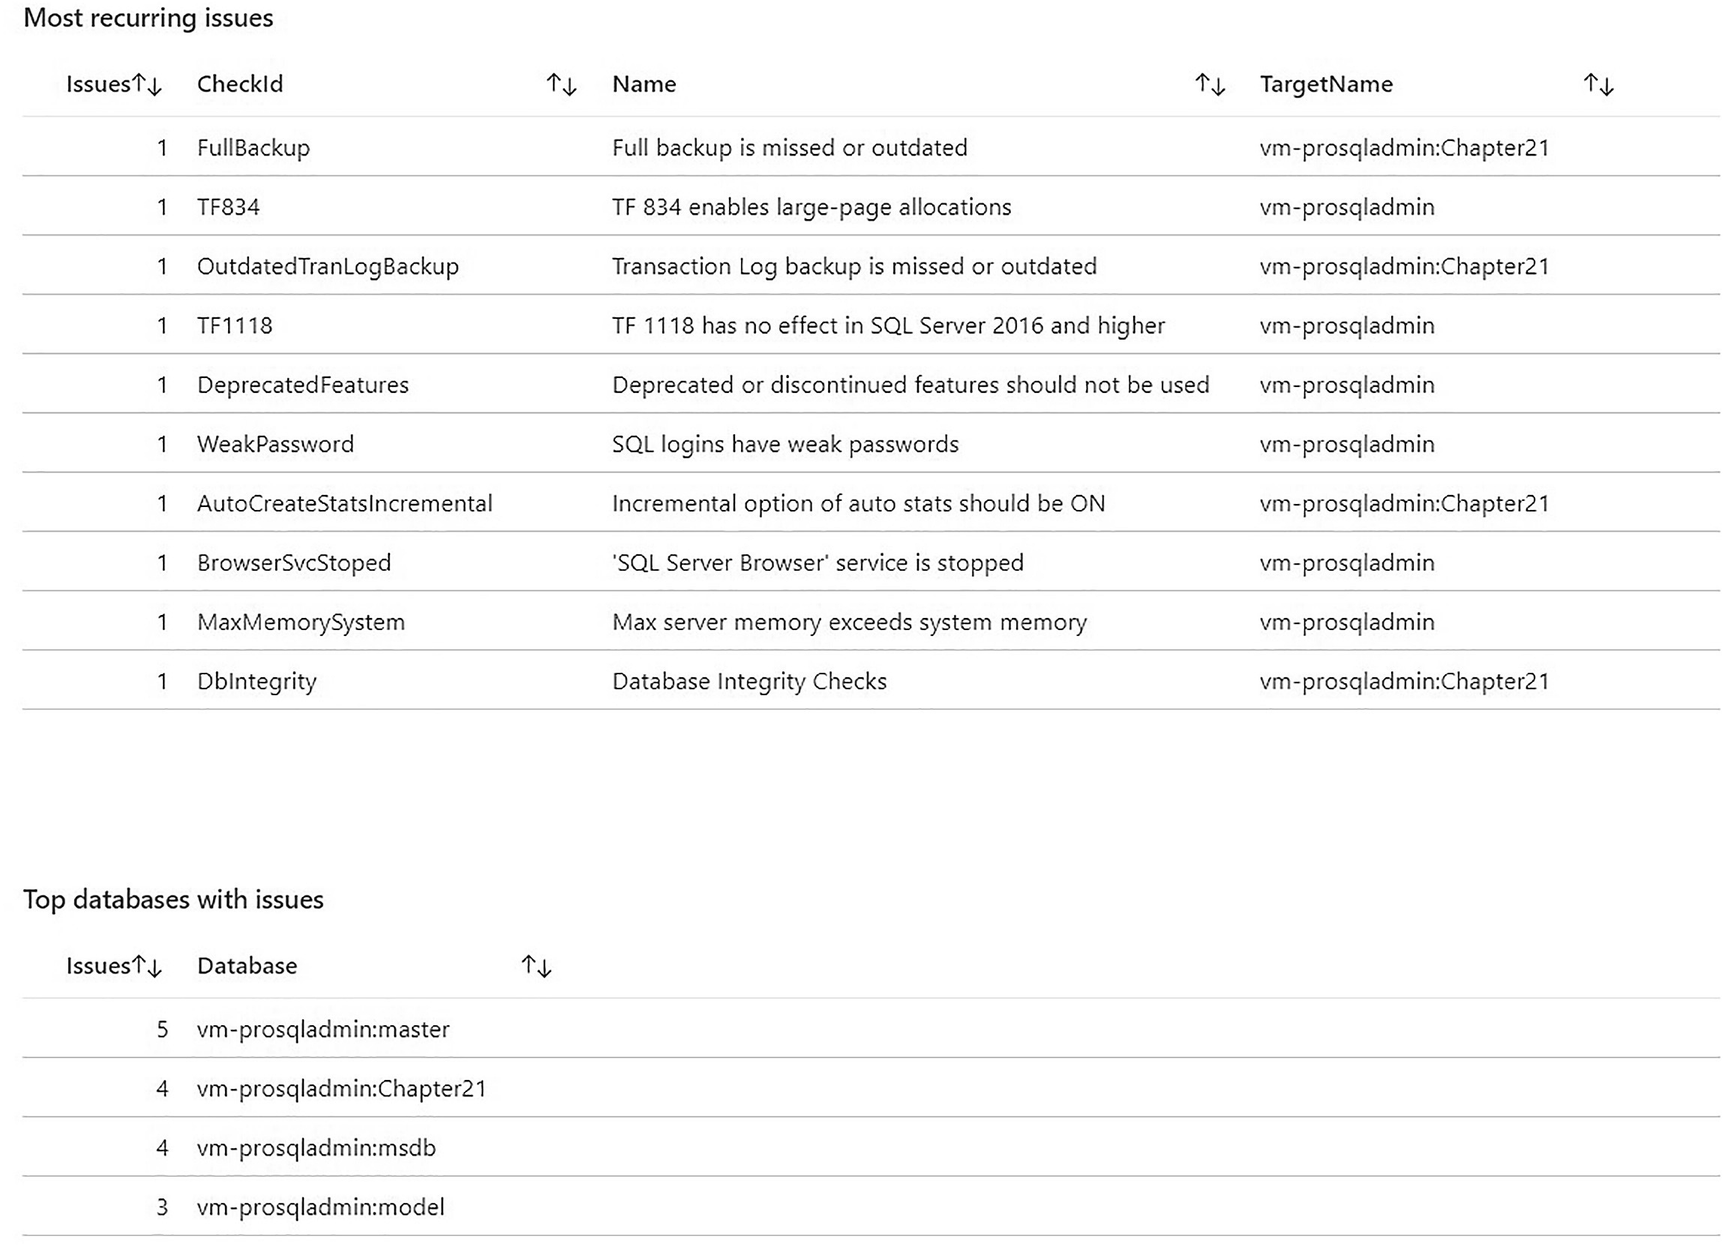
Trends tab
Logs query window
Kusto Query Language, or KQL, is a variation of SQL that can be used to search logs.
Kusto Query
A full discussion of how to use Kusto is beyond the scope of this book. A Microsoft tutorial, however, can be found at https://learn.microsoft.com/en-us/azure/data-explorer/kusto/query/tutorial.
Microsoft Defender
Microsoft Defender for Cloud is a rich, vulnerability assessment tool. A subset of this tool is Microsoft Defender for SQL, which can be used to discover and help remediate vulnerabilities in database settings, feature configuration, and permissions. It scans configuration against multiple benchmarks, including the CIS (Center for Information Security) benchmark.
It can not only be configured against native Azure components, such as SQL Server Managed Instances, Azure SQL Databases, and even CosmosDB, but it can also be configured to scan servers running SQL Server in a hybrid environment. The only requirement is that the SQL Server extension is installed and that there is a secure network path to Azure, such as a VPN or Express Route. This means that while Arc enabling a SQL Server instance is not a requirement in its own right, when you do this, the SQL extension is installed, meaning that you automatically have the ability to use Defender. Because this chapter focuses on the Arc use case, however, from this point, I will assume that the instance is Arc enabled.
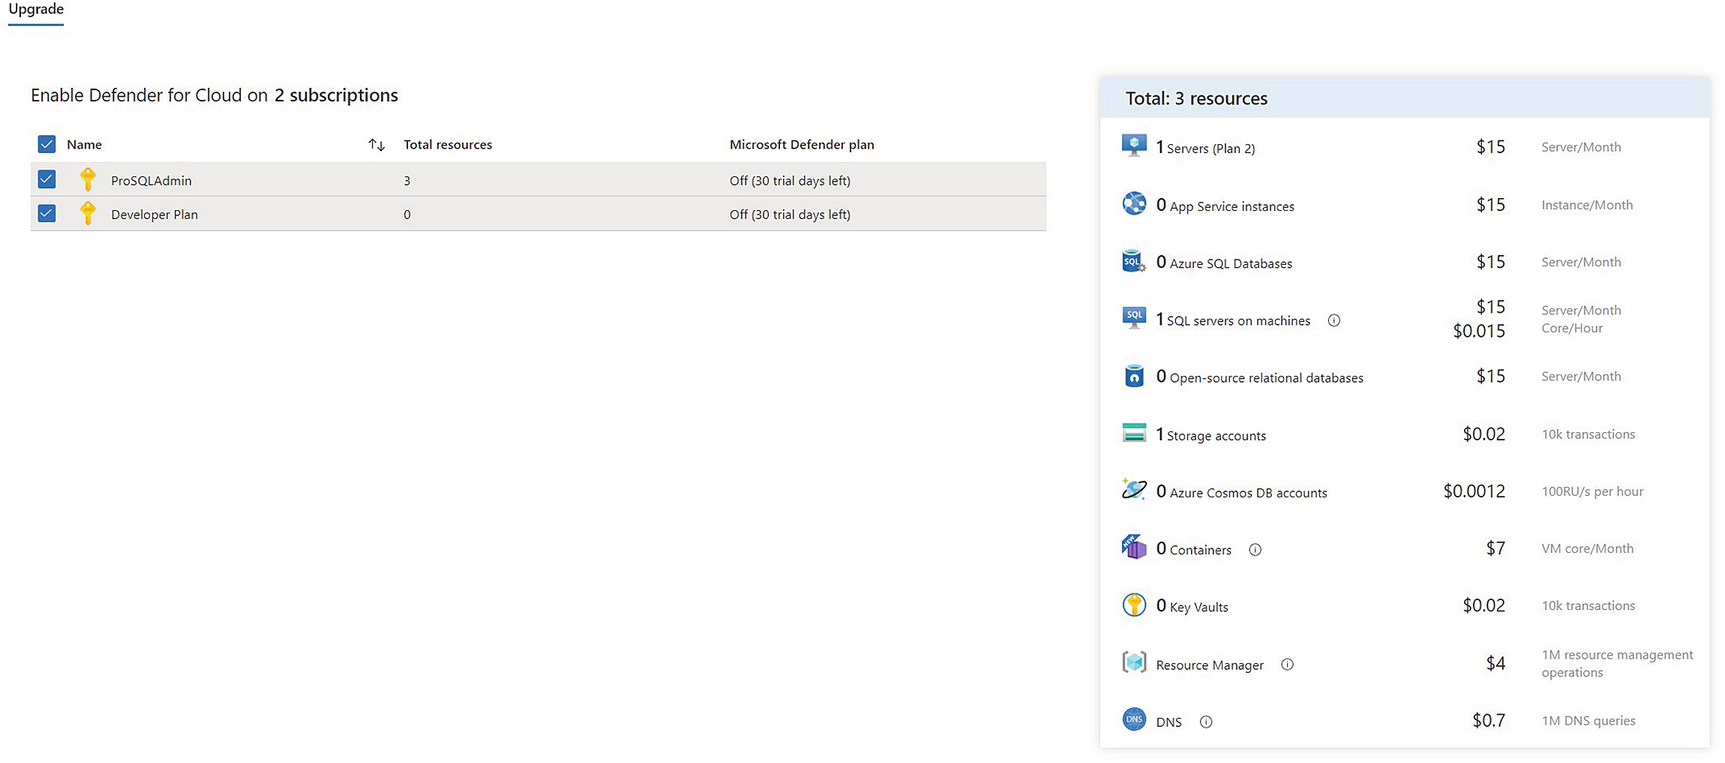
Upgrade to Defender for Cloud
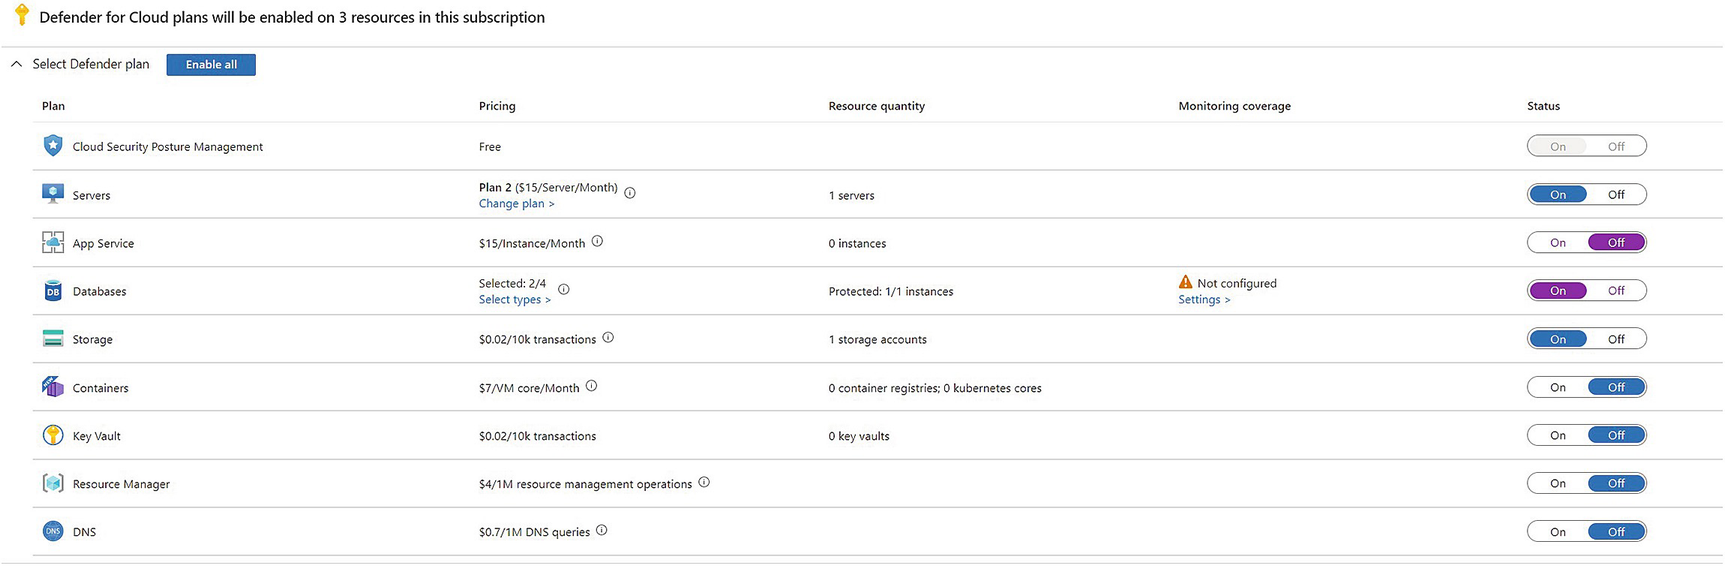
Selecting Components to Protect
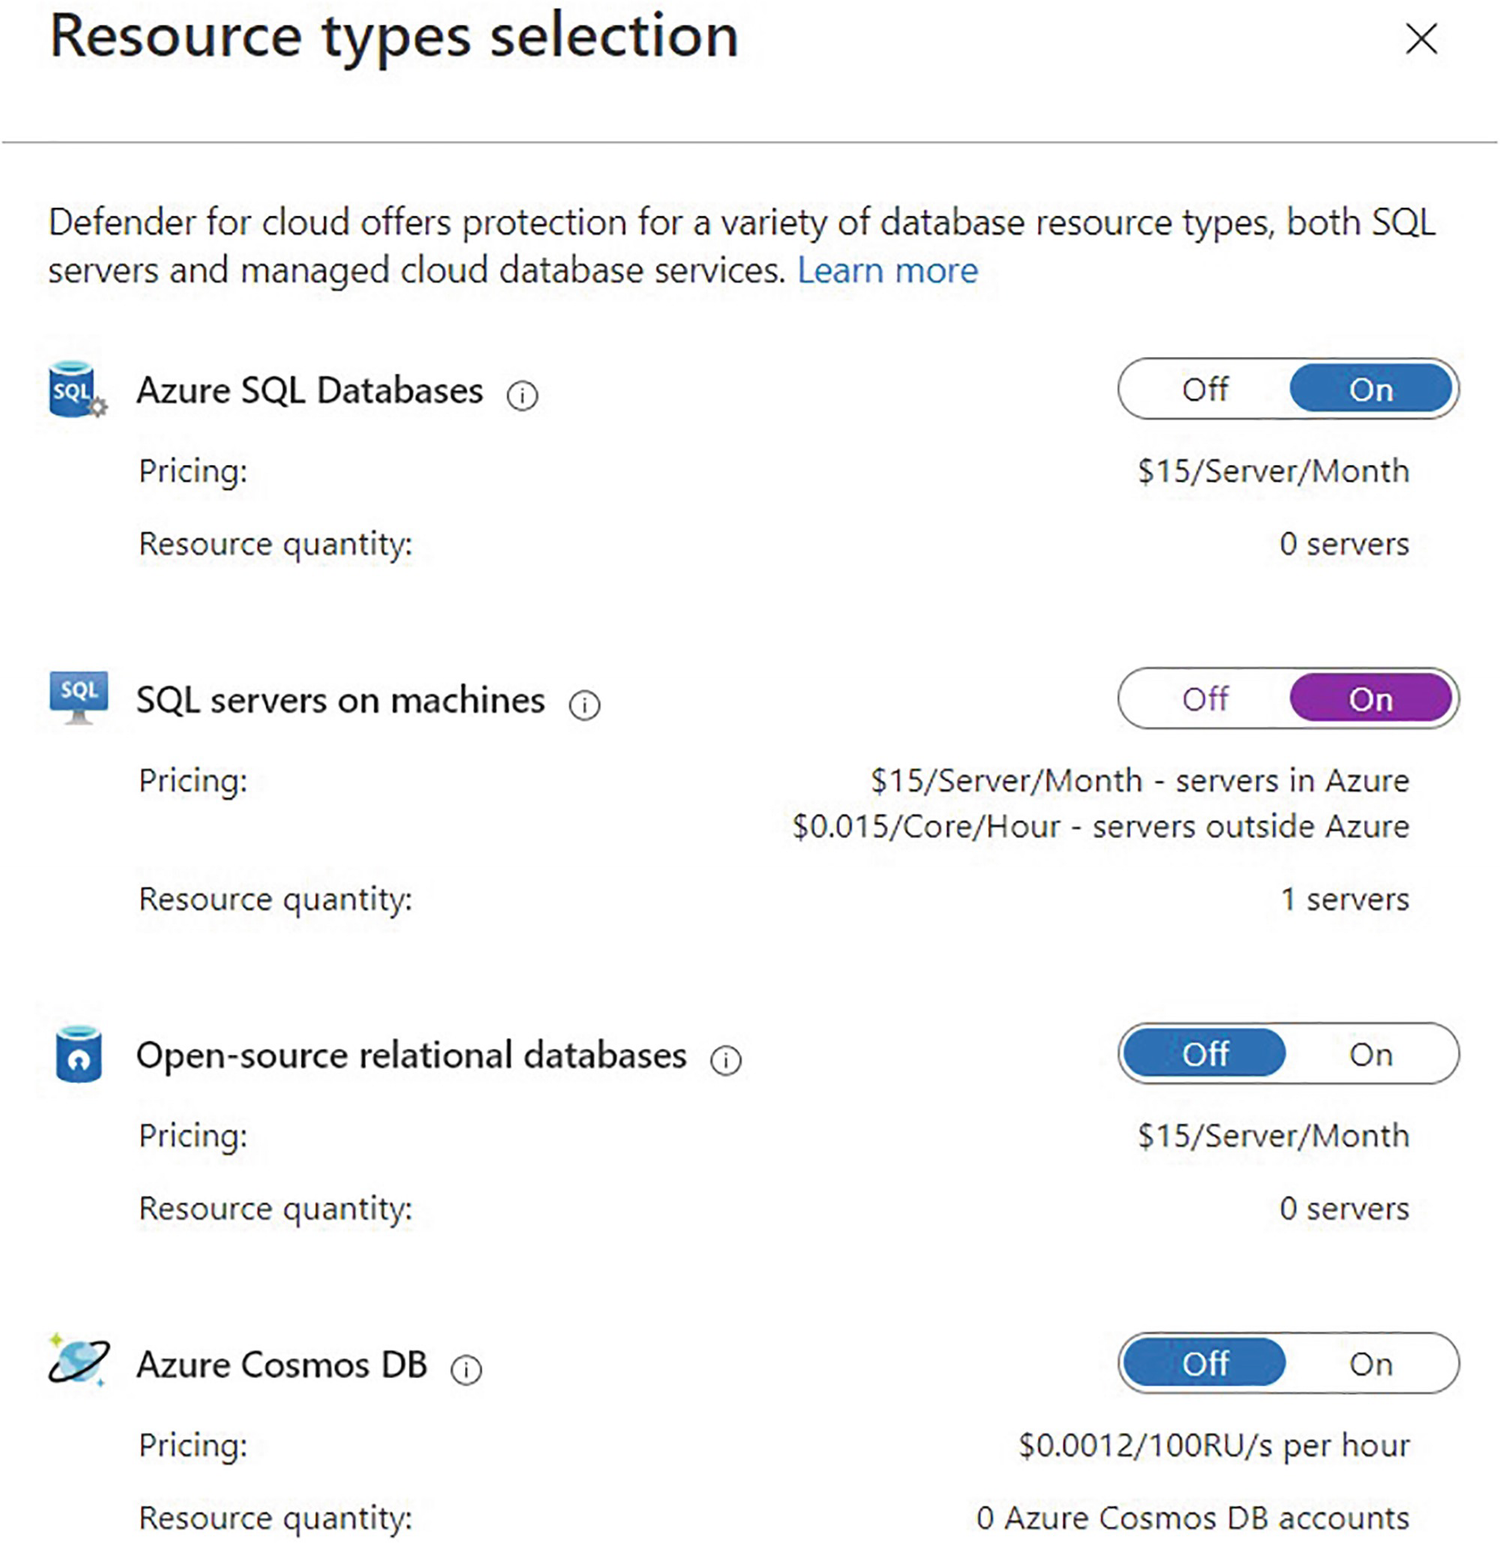
Selecting database types
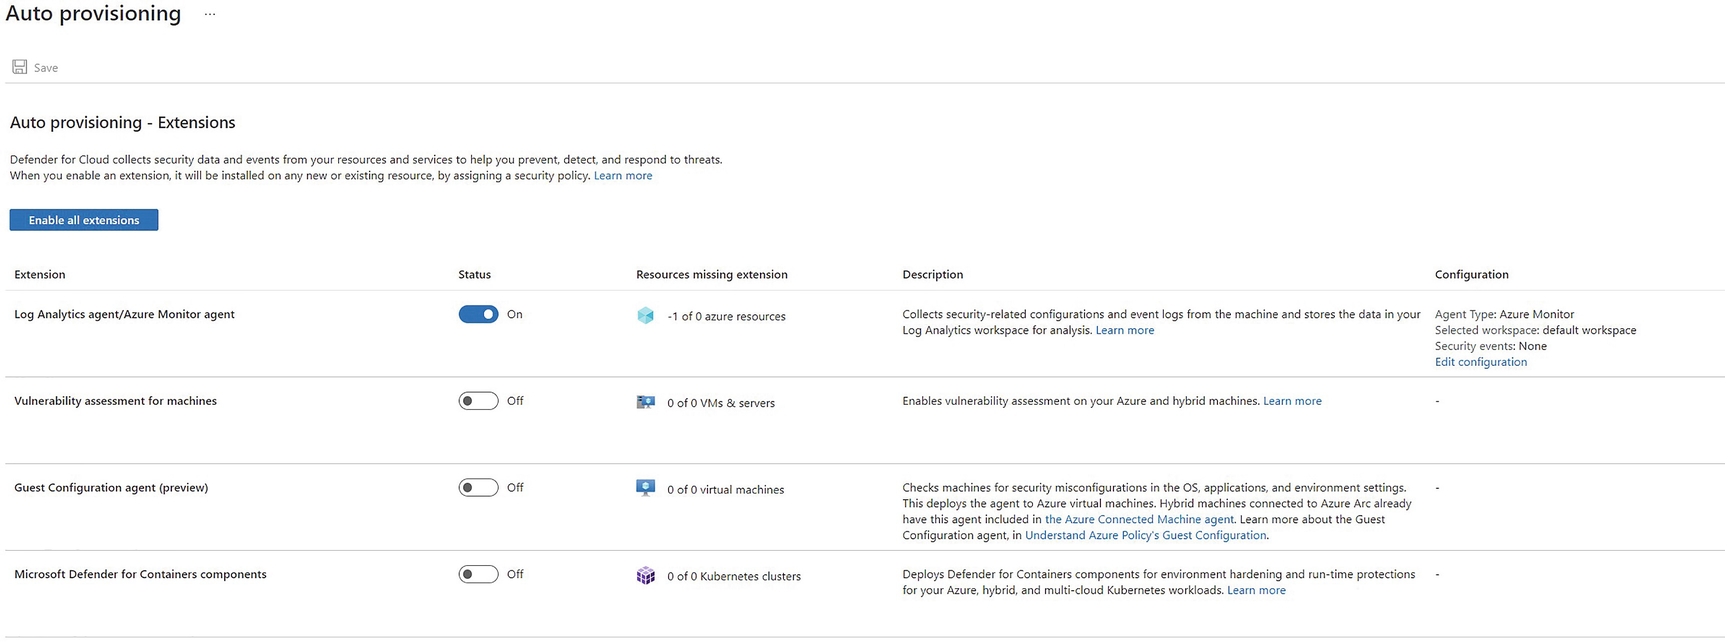
Advanced provisioning options

Defender scorecard
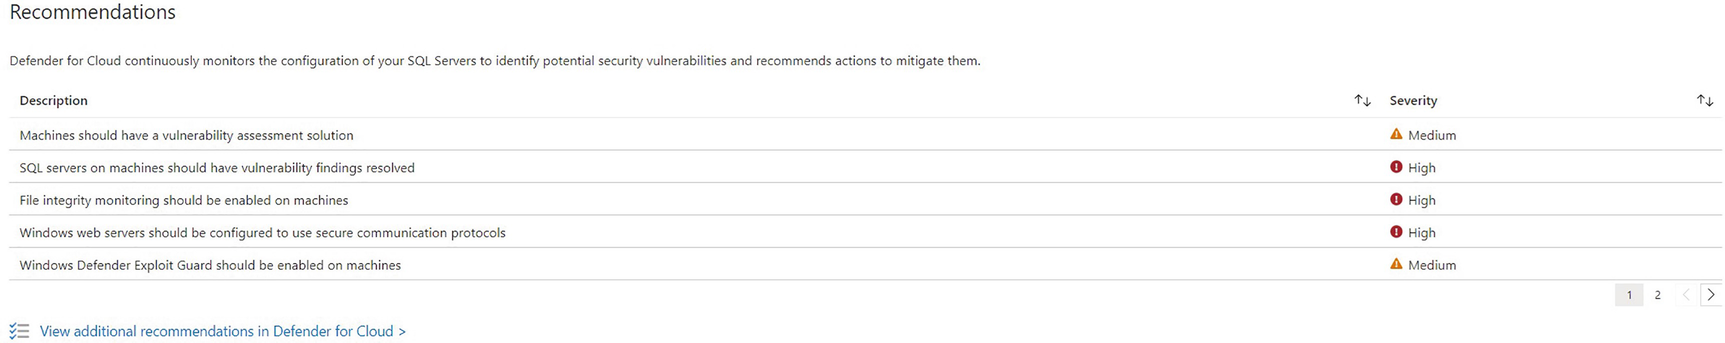
Defender recommendations
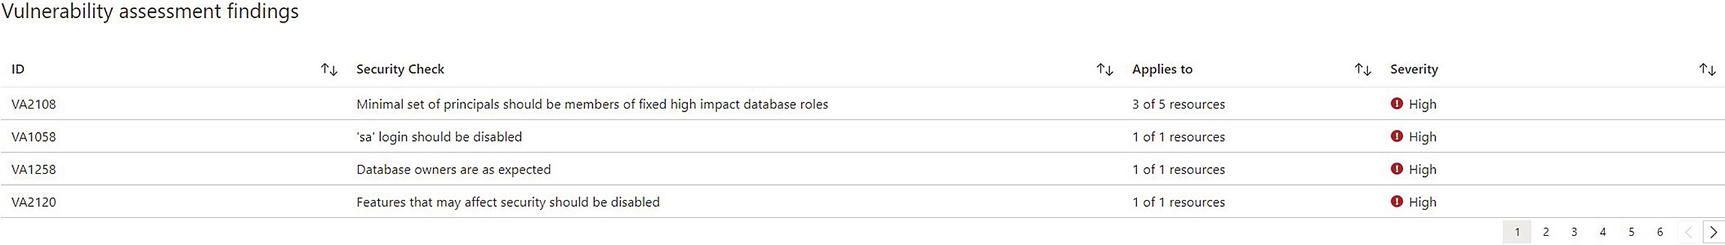
Defender findings
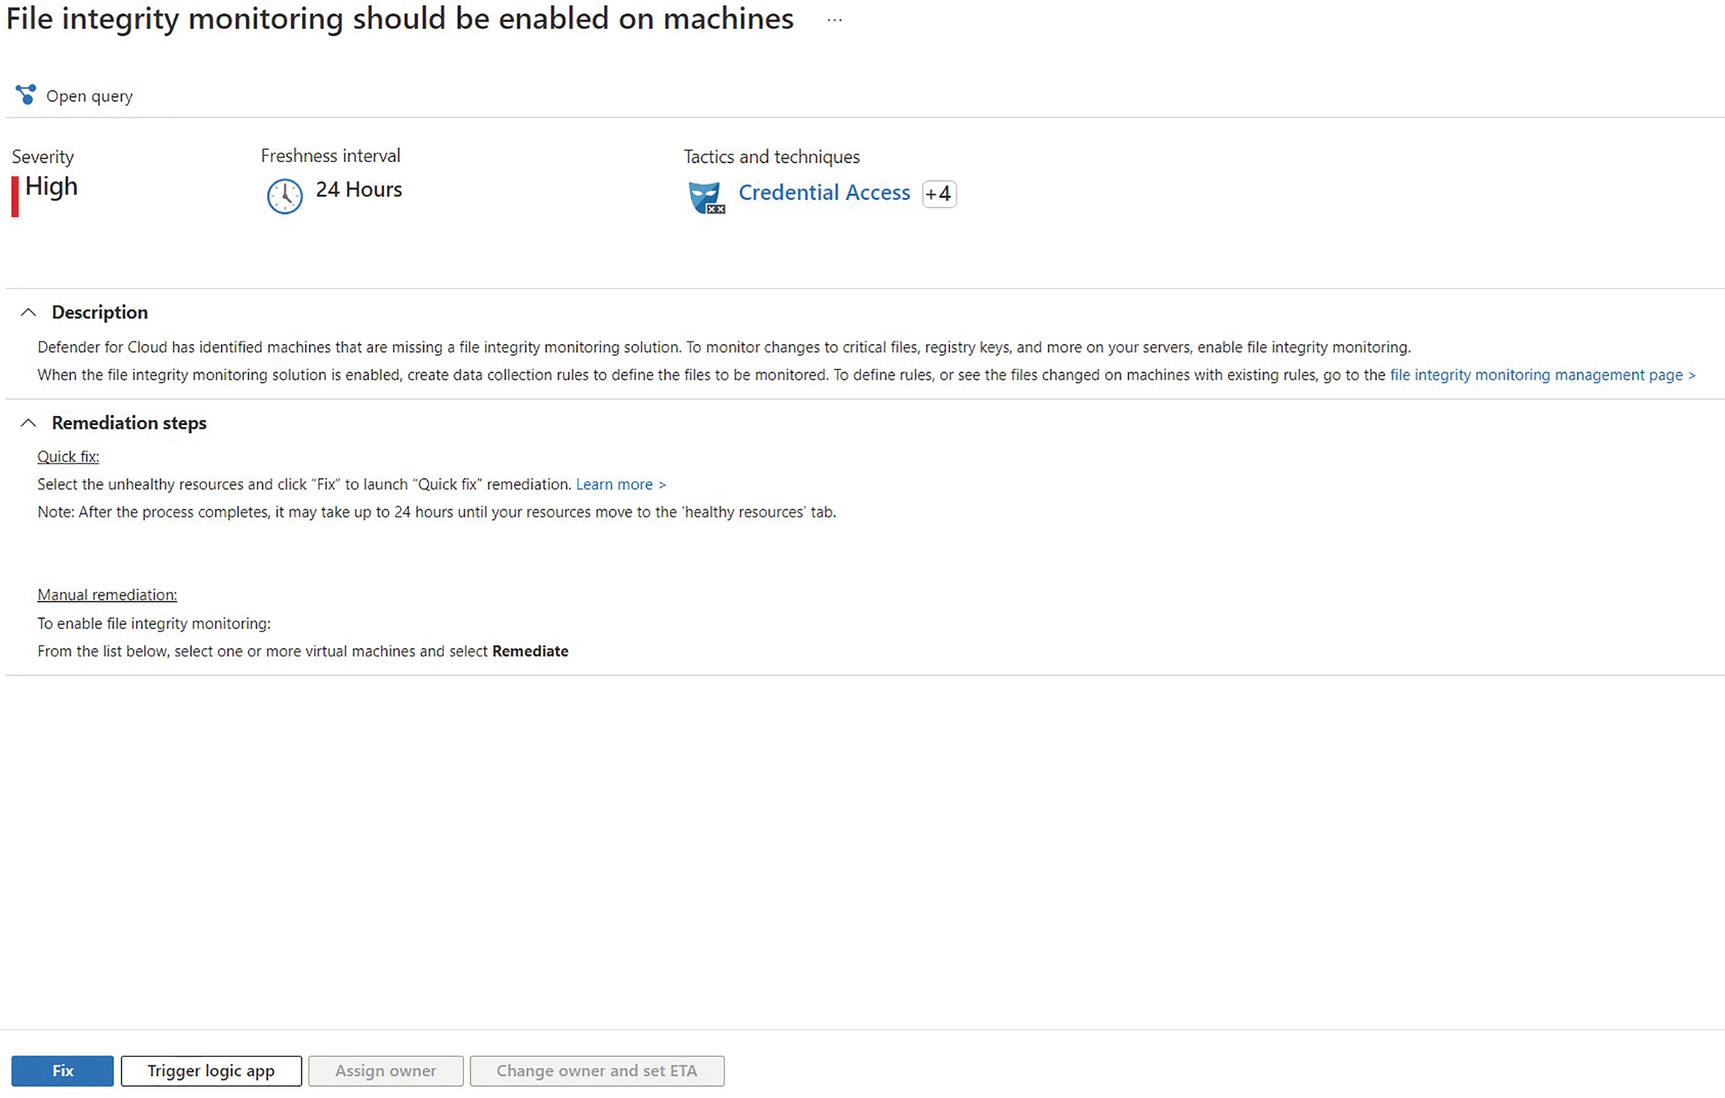
File integrity monitoring recommendation
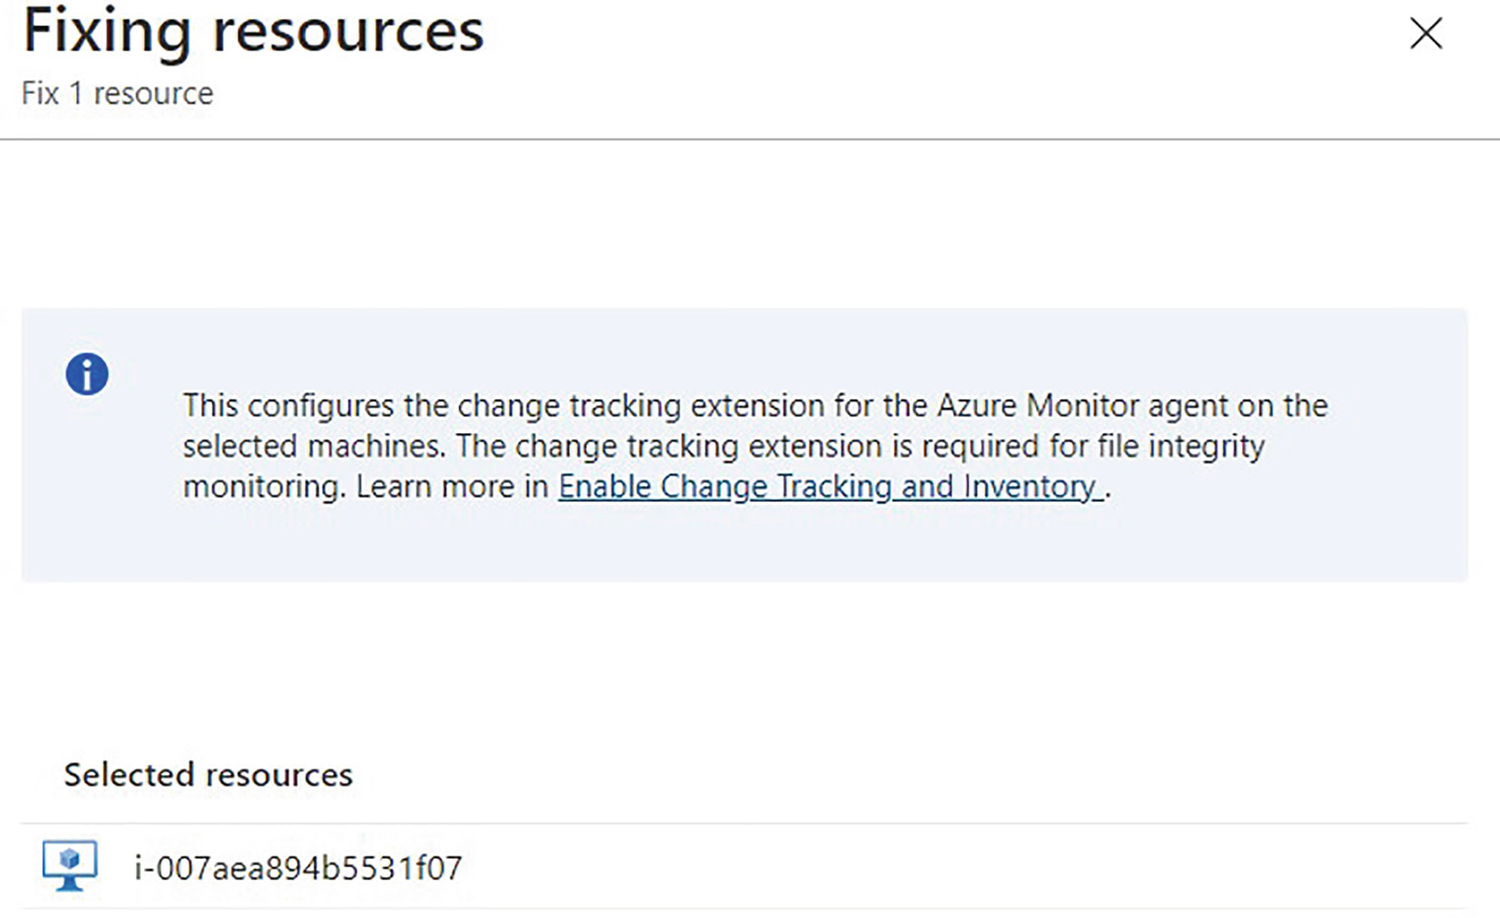
Fix confirmation window
In order to use the quick fix options, you must have an automation account in Azure and you must have Change Tracking and Inventory enabled.
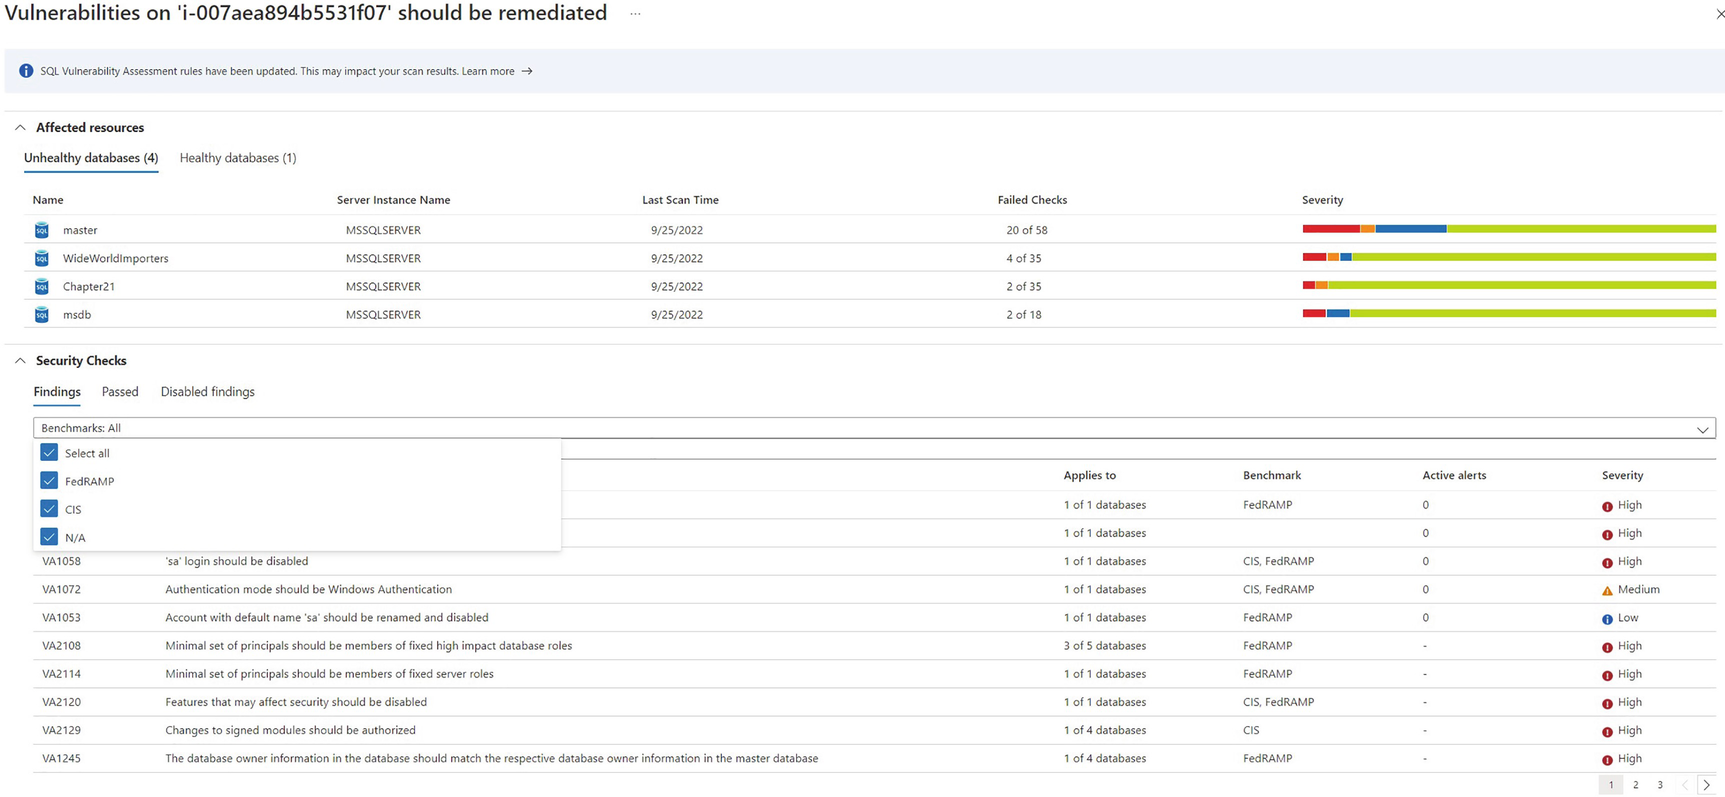
Vulnerabilities that should be remediated subreport
Vulnerabilities filtered by database
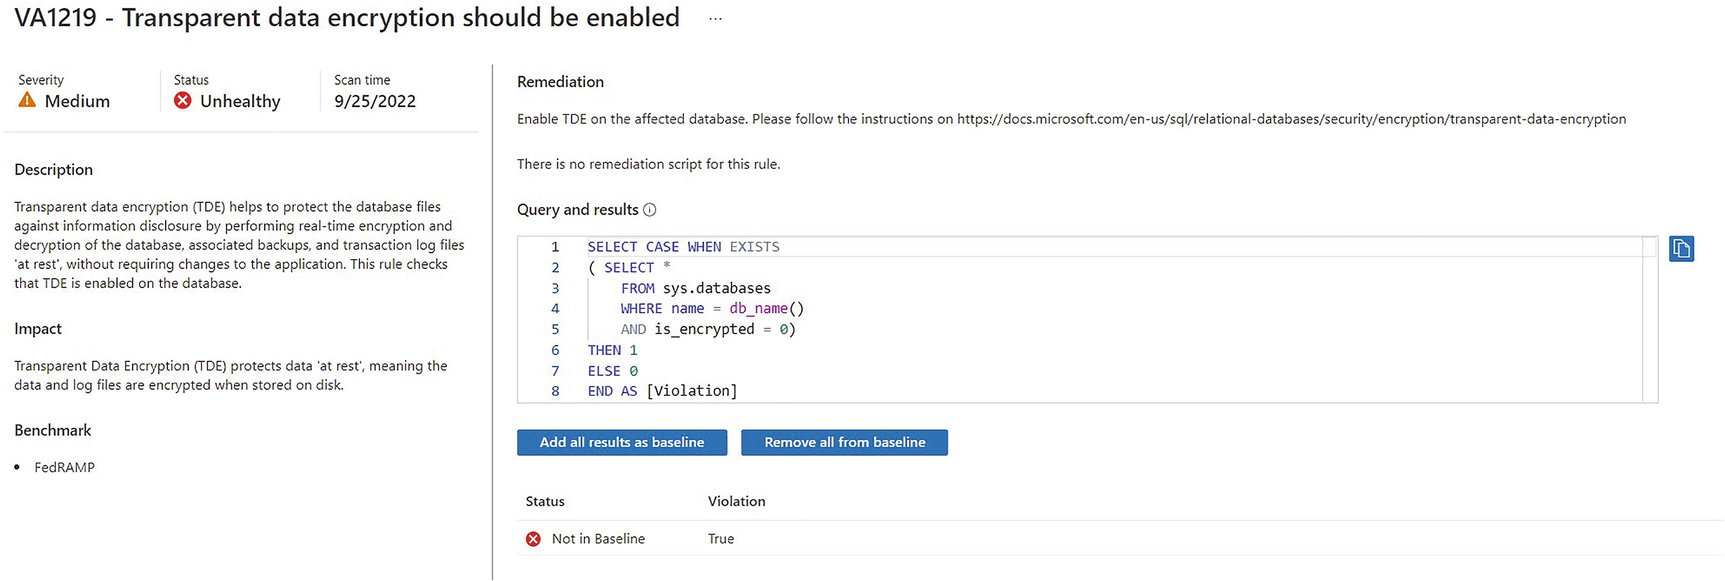
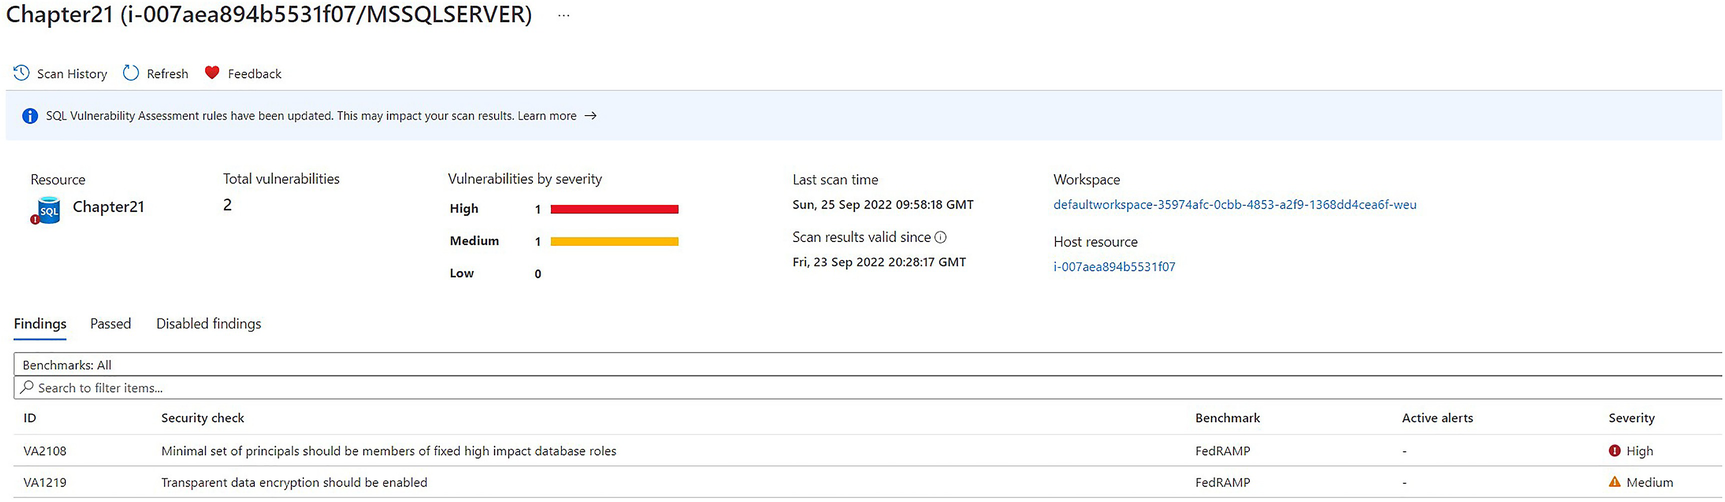
Vulnerability details page
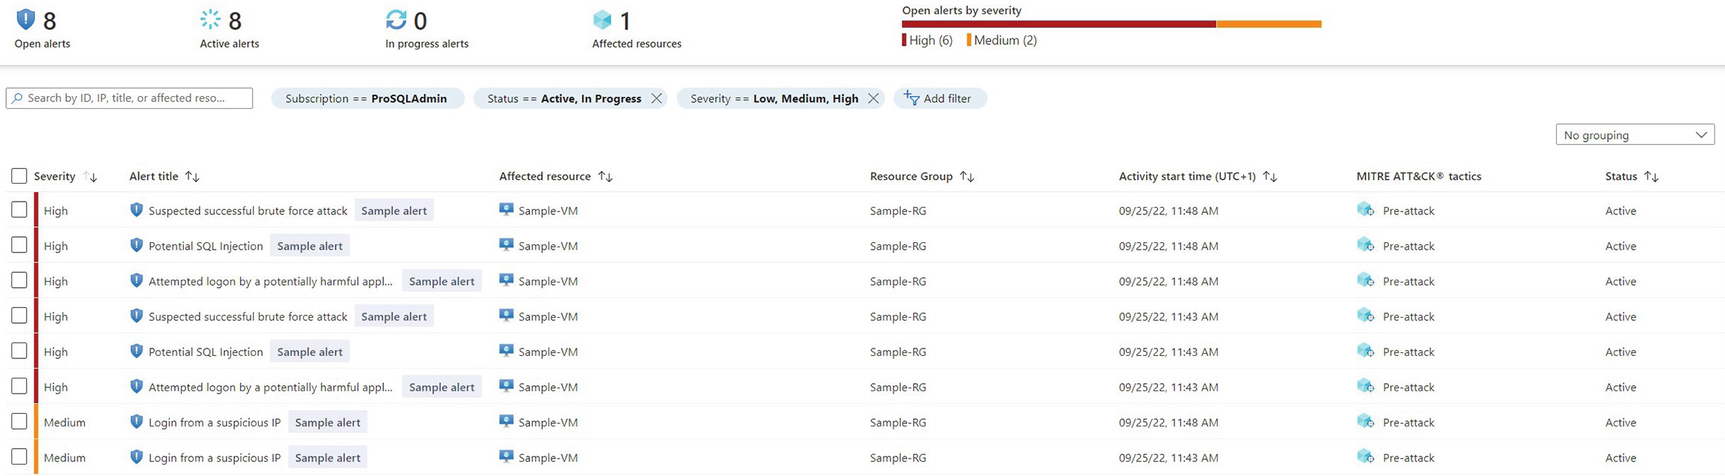
Defender alerts
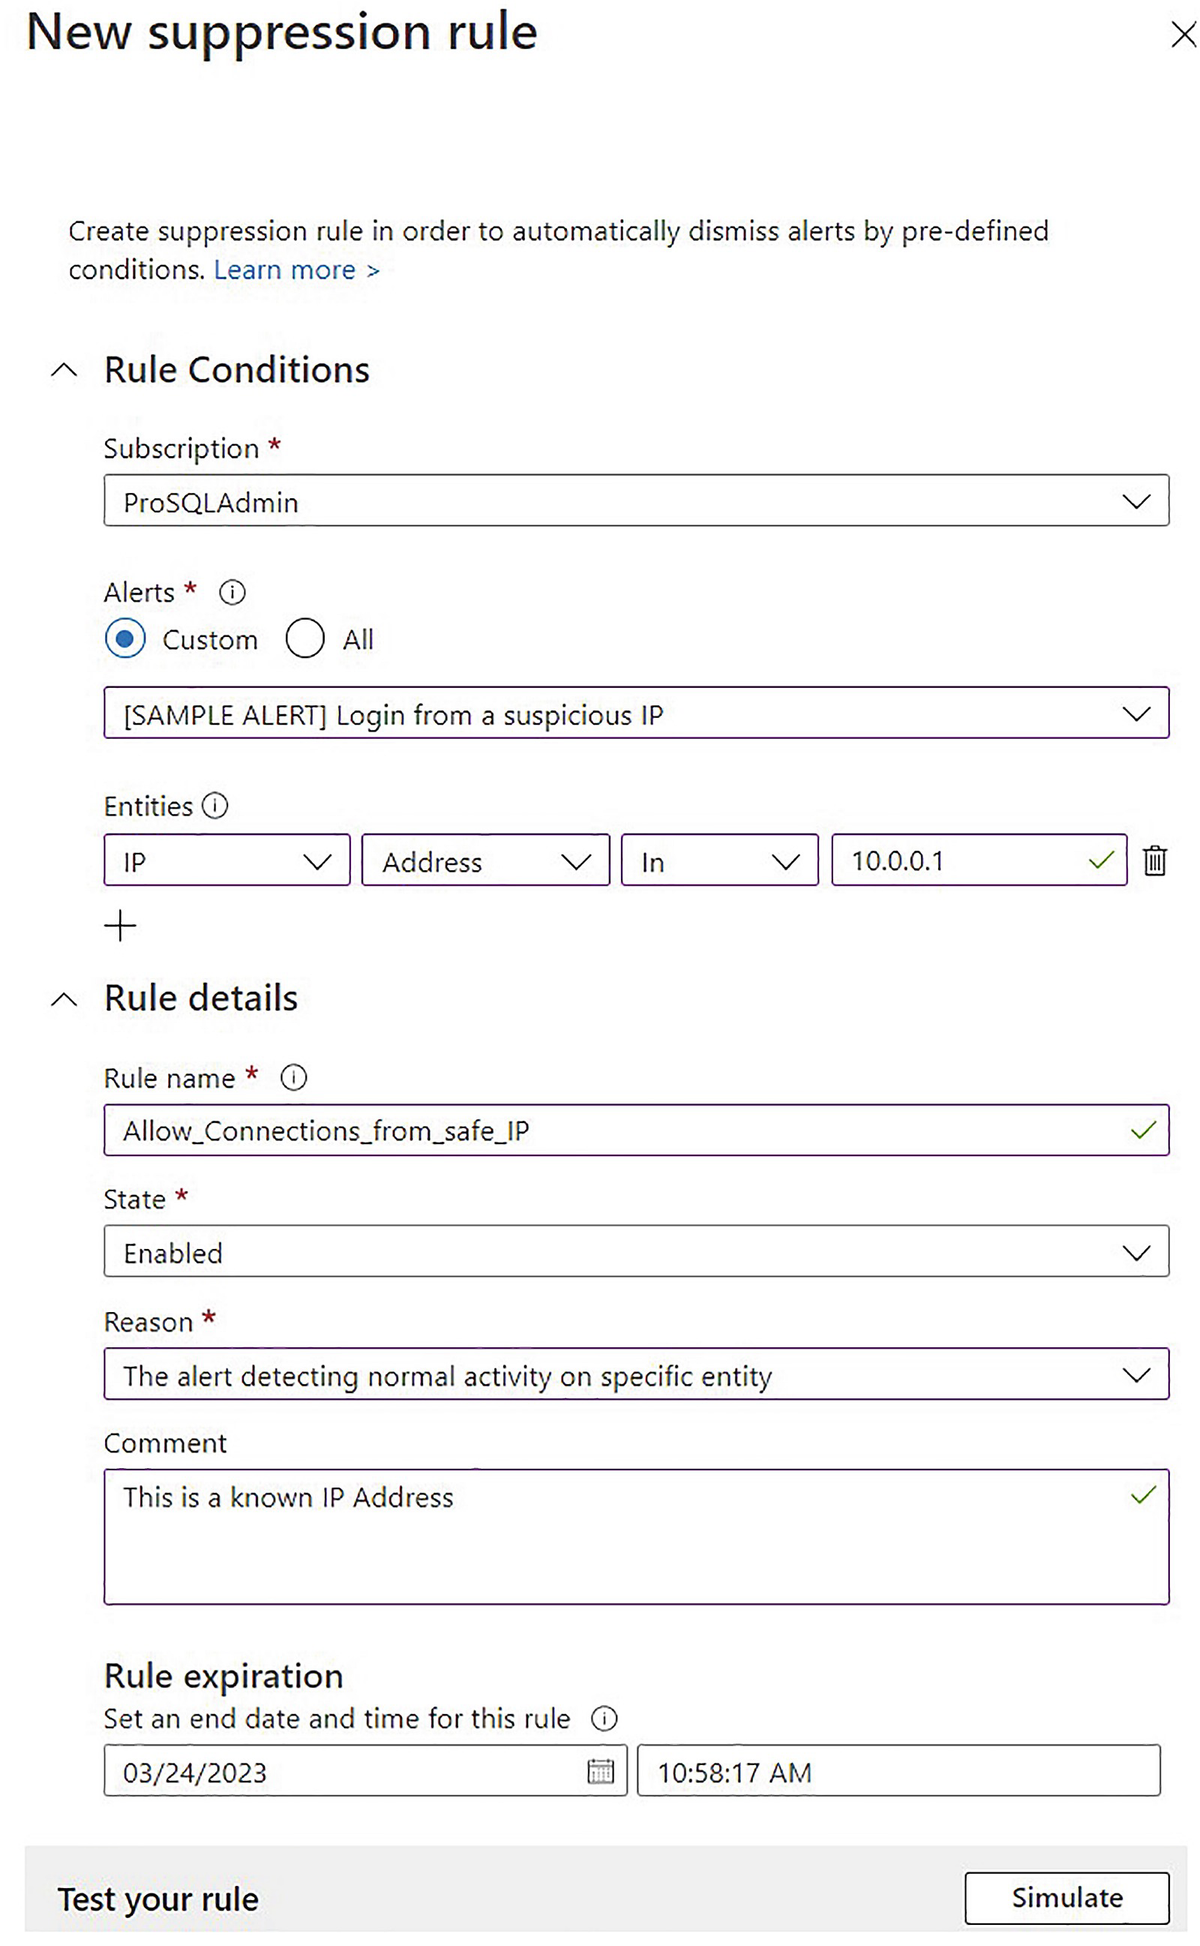
Create a suppression rule
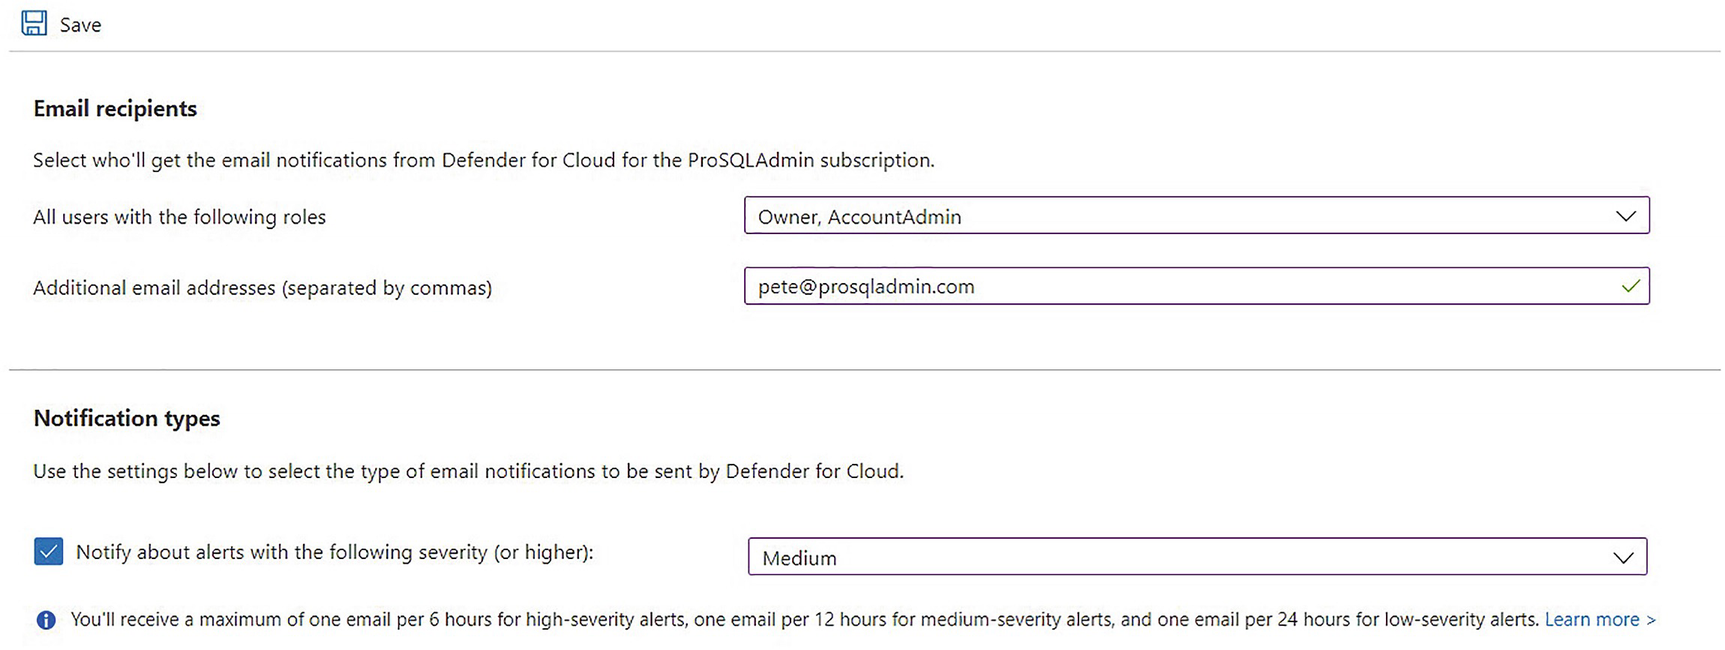
Configure e-mail notifications
Summary
Registering a SQL Server instance with Azure Arc is possible with supported versions of SQL Server, but doing so is a manual process, which involves running scripts and installing agents on your server. SQL Server 2022 makes the process far more simple, by building Arc registration into the SQL Server setup.
Once registered in Arc, the resource appears as a resource in your designated Azure resource group. This opens up many possibilities, including using Environmental Health/SQL Best Practice Assessment and Azure Defender for Cloud.
Although beyond the scope of this book, Arc-registered SQL Server instances can also be integrated with Azure Purview.
SQL BPA runs hundreds of checks against the full stack to ensure that your SQL Server environment is configured to best practices. SQL BPA provides a rich reporting interface, with drill-throughs that allow you to easily target the highest priority issues. It also provides trend analysis, so that you can keep track of the issues being addressed over time. This can feed into agile project methodology or BAU metrics.
Azure Defender for Cloud protects SQL Server workloads, both with vulnerability assessments and machine learning that alerts when anomalous activity is detected. The assessment provides drill-through reports, with the bottom level containing full details, including a description of the finding, the potential impact, and suggested remedial actions. In some instances, a quick fix feature is provided that allows you to resolve the issue directly from within Defender, although this does require addition agent installation and an Azure automation account.
The attack scanning provides alerts in situations such as brute-force attacks, SQL injection attacks, and access from unexpected IP addresses. These alerts appear in the Defender console, but can also be sent to members of Azure subscription roles, such as Owner or Contributor. Alerts can also be suppressed if the anomaly detection has made an error.