
Chapter 23
Manual Testing
What's In This Chapter?
- Using Microsoft Test Manager to create and manage test plans
- Running test cases and publishing the results
- Conducting exploratory testing
- Taking advantage of fast-forward for manual testing to speed up test runs
Across the software development industry, manual testing still makes up about 70 percent of the testing efforts as compared to creating automated tests, or specialized testing efforts such as performance and scale testing. Yet, manual testing has historically been overlooked by most software development tool vendors. With Visual Studio 2010, Microsoft set about to fix that disparity by building an entirely new set of tools targeted specifically at the generalist tester. A generalist tester is a person who tests software manually by directly interacting with the software in the way a user might, and filing bugs when the tester encounters broken functionality or unexpected behavior. Microsoft has continued to improve that experience with Visual Studio 2012.
In this chapter, you learn how Visual Studio 2012 can make generalist testers more efficient at authoring, managing, and executing manual test cases. You begin to understand how the testing framework in Visual Studio 2012 bridges the gap between testers and developers by capturing rich diagnostics during test runs, which can then be analyzed by developers to help them diagnose and resolve bugs. You find out about the new exploratory testing approach enabled in this release, which works in tandem with the formal testing approach introduced in 2010. You also learn about some of the fit-and-finish work that has gone into this release since this functionality was first introduced in 2010.
Microsoft Test Manager
Microsoft Test Manager is a tool designed specifically for generalist testing teams. With Test Manager, you can create and manage test plans and test cases, author and execute manual tests, and file rich bugs. In Chapter 26, you also see how you can use Test Manager to create and manage physical and virtual test environments.
Test Manager requires a connection to Team Foundation Server. Team Foundation Server stores all testing artifacts used by Test Manager, such as test plans, test cases, bugs, and the results of test runs. Test Manager also encourages the use of Team Foundation Build for building the software that you are testing and reporting on the results of each build, although it is possible to use Test Manager even if you don't use Team Foundation Build.
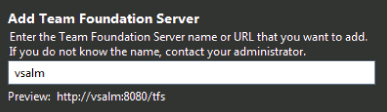
The first time you start Microsoft Test Manager, you are prompted to connect to Team Foundation Server, as shown in Figure 23.1. Type in the name of your server as provided by your Team Foundation Server administrator and click Add. If your Team Foundation Server is configured for a nonstandard port, type the server name as servername:portnumber. If your Team Foundation Server instance has been configured for a nonstandard virtual application directory, you may need to supply the full URI path. Consult with your Team Foundation Server administrator for assistance. Click Add when you are finished.
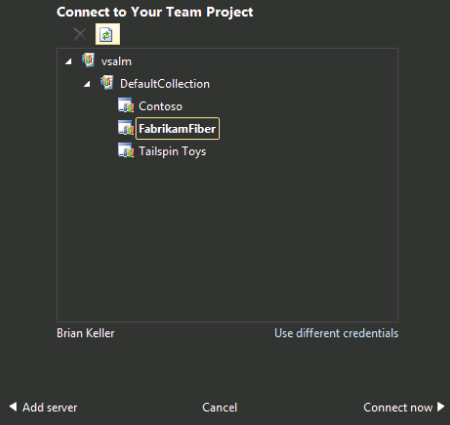
Next, you are prompted to connect to a team project, as shown in Figure 23.2. Select your team project and click Connect Now.
Using Test Plans
A test plan is used within Test Manager to manage your entire testing effort for a given iteration. This includes your test cases, test results, the configurations you plan to test (for example, different operating systems and web browsers), and several other settings that are covered in this chapter.
You will usually have different test plans for different iterations of your application's development lifecycle. For example, early test plans may focus on testing core functionality, whereas future test plans may be targeted at fit-and-finish work (such as layout, rendering, spelling, and so on).
If your team project doesn't already include a test plan, you need to create one, as shown in Figure 23.3. Click Add to create a new plan. After the plan has been created, select the plan and click Select Plan.

You are now ready to begin working with your test plan. If at any time you want to switch to a different test plan or Team Foundation Server instance, you can click on the name of your test plan in the upper-right hand corner of Test Manager.
You should spend a few minutes familiarizing yourself with the navigation menu at the top of Test Manager. Test Manager is divided into two activity centers, the Testing Center and the Lab Center, which can be toggled by clicking the text for Testing Center. This chapter focuses on the Testing Center. (You learn more about the Lab Center in Chapter 26.)
Each activity center consists of several activities. You can access activities by clicking the headings for each activity center and then clicking the subheadings underneath those headings. The Testing Center is divided into the following four main areas of activities:
- Plan—The Plan area is used to manage your overall test plan. This includes the plan's properties, as well as the individual test suites and test cases that make up your plan. Your plan's results are also available here, which shows several graphs related to the progress of your testing efforts.
- Test—The Test area is used to view the list of test cases that are ready to be run. From here, you can launch test runs to execute test cases and save the results, file bugs, and so on. You can also start conducting exploratory testing from here, which is discussed later in this chapter.
- Track—The Track area enables you to change the build that you are currently testing. This tab also helps testers discover which tests might be most important to run based on the build in use.
- Organize—The Organize area provides an easy way of accessing and modifying all your test cases, test configurations, and other test plans.
You read more about these areas in the remainder of this chapter.
For now, focus on configuring the properties of your test plan. Click Plan and then click Properties. Test Manager displays the test plan properties activity for your test plan, as shown in Figure 23.4.
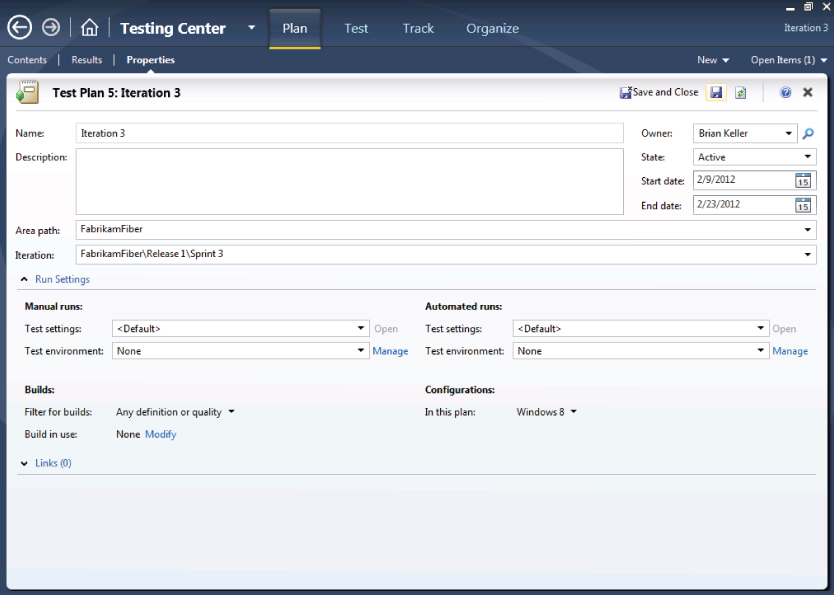
The upper portion of your test plan's properties includes metadata that you can use to describe the plan (such as name, description, and owner). This metadata can be useful for planning purposes, but it doesn't actually affect the functionality of your test plan. For example, setting your plan's State to Inactive or the Iteration Start Date to occur in the future doesn't prevent this plan from being used by testers. It's only useful for describing your plan.
Now take a look at the rest of the properties you can set for your test plan.
Configuring Test Settings
Test settings define which data diagnostic adapters will be used when conducting your test runs. Data diagnostic adapters were introduced in Chapter 22. Data diagnostic adapters can collect data from the machines being tested or affect the machines being tested (such as by emulating a slower network connection). This data can be very useful for developers when they receive a bug by providing rich data about how the bug was encountered and even the state of the application at various points in time leading up to the bug discovery.
From within your plan properties, you can select the default test settings, which should be used for both manual and automated test runs. You can also create a new test setting entry, or modify existing test settings. You learn more about test settings for automated runs in Chapter 26 when you learn about configuring test environments.
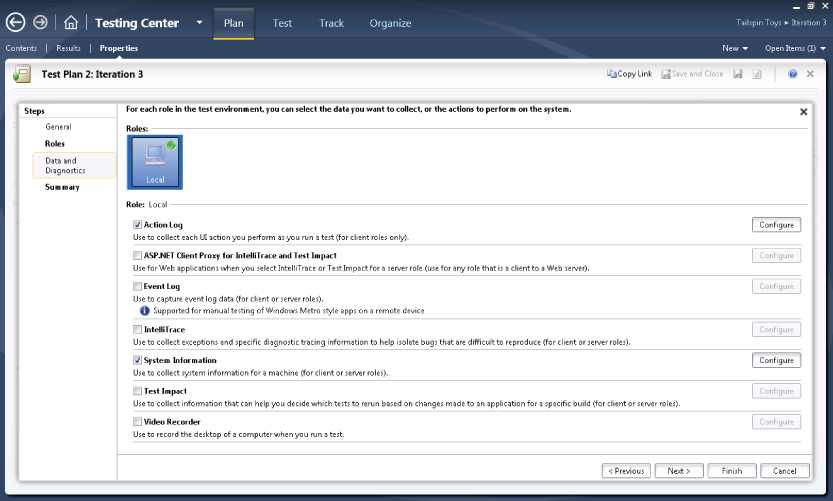
Figure 23.5 shows an example of test settings for manual runs. The Data and Diagnostics tab enables you to configure which data diagnostic adapters should be enabled when this test setting is used. Note that some data diagnostic adapters have additional options that can be configured (such as the frame rate and bit rate to use when capturing video recordings).
It is a good practice for the testing team to work with the development team in defining which data diagnostic adapters should be enabled for each machine within the environment. This helps ensure that developers have everything they need to diagnose a problem when they receive a bug, along with attachments from the test run.
Using Builds
As your testing progresses, you will periodically select new builds to test. From your test plan's properties, you can first configure the filter for your builds to match the build definition (as defined in Team Foundation Build) and, optionally, the build quality to use as a filter from among all available builds.
For example, it is common to have a tester scout a build before the rest of the team tries the build. Scouting usually involves installing the software and running some initial tests to ensure that it's worth using by the rest of the team. After a build is scouted, you can change the status of that build to indicate that it's a suitable build candidate to be used by the rest of the team.
After you configure a build definition and filter, you can click Modify to view the Assign Build dialog shown in Figure 23.6. Start by choosing with which build to begin testing and click Assign to Plan.
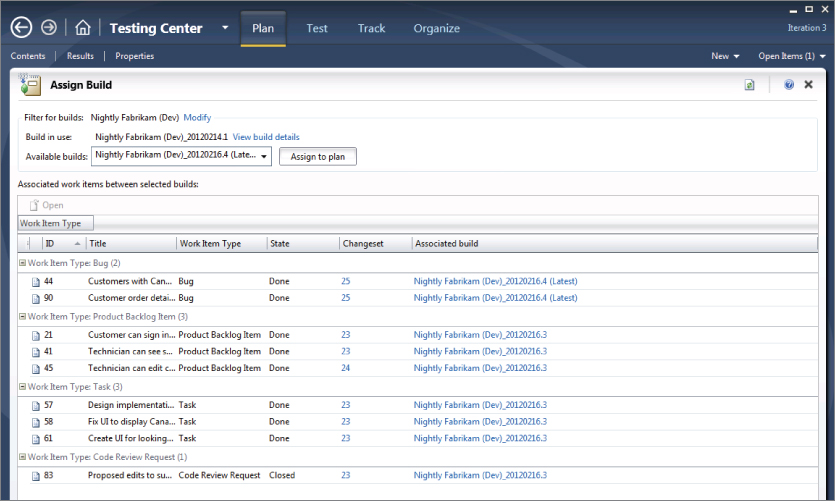
After you choose your initial build, you can view newer builds by using the Available Builds dropdown. When examining a newer build, any work items (such as requirements or bugs) that have been changed since your currently selected build are displayed in the lower portion of the dialog. This is determined by compiling a list of work items that are linked to changesets from all builds between the current build and the build you are considering.
This information can help you decide whether to continue testing with your existing build or to switch to a newer build (by clicking Assign to Plan). For example, maybe your testing efforts for a given feature are blocked until a requirement is implemented or a bug is fixed. In Figure 23.6, you can see that three product backlog items and two bugs have been changed since the currently assigned build. Clicking Assign to Plan updates the test plan to use that newer build. Afterward, results from test runs are recorded against this newer build by default, although it is possible for testers to override this value by clicking Run with Options when starting their test runs.
You can also access the Assign Build activity by clicking Track ⇒ Assign Build.
Analyzing Impacted Tests
Test impact analysis is a powerful feature that can help improve the productivity of testers by enabling them to quickly identify tests to rerun based on changes to code. You can enable test impact analysis to run in the background while tests are being executed. This feature records which sections of code are executed while each test runs. Test impact analysis works with managed code (that is, code based on .NET Framework 2.0 and above).
To use test impact analysis, click Track ⇒ Recommended Tests to get to the Recommended Tests activity. Here, you can see a list of test cases that may have been affected by recent changes to source code. Test impact analysis works by comparing your newly assigned build to the previously assigned build. Test impact analysis compiles a list of the test cases which passed the last time they were run. It then analyzes the blocks of code that were executed the last time those tests were run and compares that result with the list of code changes in the new build you are selecting. Using this technique, test impact analysis provides a recommended list of tests that appear to have the highest risk of failing based on those code changes.
Use the Recommended Tests activity to quickly compile a list of tests that might be useful to rerun. To mark a test to be rerun, click that test (or select a range of tests) and then click the Reset to Active button. This causes that test case to appear as Active from the Run Tests activity (which you learn about later in this chapter, see “Running Tests and Tracking Results”).
Defining Test Configurations
Often, your software must be supported on a variety of hardware and software configurations. Correspondingly, your test plan should account for these configurations if they have the potential to affect the functionality or behavior of the application you are testing. Test Manager enables you to define test configurations to represent the matrix of environments that you want to test and tracks the pass/fail status separately for each assigned configuration.
The test plan properties page enables you to select the default test configurations that should be applied to tests in your plan. You can override these defaults for an individual test case or test suite, but, by default, if you want all your tests to be run on Windows 7 with Internet Explorer 9 and Windows 8 with Internet Explorer 10, you must specify that in your test plan properties.
Figure 23.7 shows the Test Configuration Manager that is used to build the matrix of test configurations you might want to include in your test plan. Creating a new test configuration enables you to select one or more configuration variables (such as operating system and browser) and their assigned values.
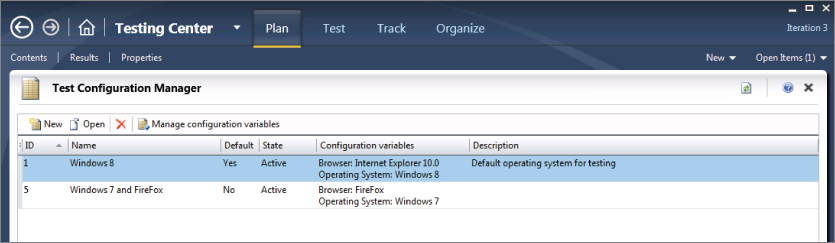
Configuration variables for operating system and browser are provided to you by default. But you might want to create your own configuration variables, or modify the existing variables to include additional browser and operating system choices. You can do this by clicking Manage Configuration Variables. You can create configuration variables for anything that you want to track for your testing efforts. For example, maybe it's important to test with different operating system languages, service pack levels, database versions, or even keyboard layouts. All these changes in the environment can be represented using configuration variables.
After you have created your configuration variables in Test Configuration Manager, click New to assign variables and their values to a test configuration. You can then add these test configurations to your test plan from within the Test Plan Properties activity.
In Chapter 26, you learn how you can use the new Lab Management feature of Visual Studio 2012 to help you run tests in a variety of environments to quickly address a wide range of test configurations. For now, you will be running all of your tests locally.
Plan Contents
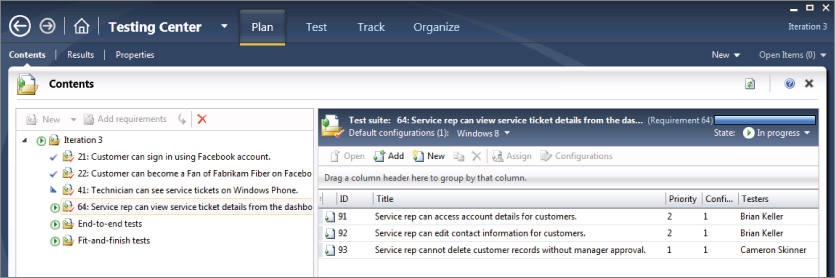
If you click Plan ⇒ Contents, you can use the Contents planning activity to create and organize the test cases that make up your test plan. A test case is simply a set of interactions with a software application that are designed to validate application functionality or behavior. For example, you might have a test case that confirms that a new user can create an account within your application. Test cases are represented as work items in Team Foundation Server, and, correspondingly, in Test Manager. In this chapter, you will learn how to author test cases and manage them within your test plan. Figure 23.8 shows the Contents planning activity.
Test cases are organized into one of the following three types of test suites:
- Requirements-based test suite—This includes any test cases that are linked to requirement work items via a “Tests” relationship. For any given iteration of an application's development, you usually want to start by adding all the requirements that are being implemented in that iteration. This way, you can create and execute test cases that verify an application is on track to deliver the promised functionality. Click Add Requirements to add a requirements-based test suite to your plan. You are prompted to select the requirement work items for which you want to create test suites.
- The work item types used here vary based on the process template you're using for your team project. For example, for a team project created with the MSF for Agile process template, the default requirement work item type is a User Story; for a team project created with the Visual Studio Scrum process template, the default work item type is a Product Backlog Item.
- Query-based test suite—This enables you to specify a dynamic work item query for selecting test cases. For example, you might want to include all test cases with a priority of 1, even if they are for requirements that were finished in earlier iterations. This can help ensure that critical functionality that used to work doesn't break (or regress) as the application progresses. Click New ⇒ Query-based suite to add this to your plan. You will be prompted to create the work item query to which to bind this suite. The sort order of the query will define the test order of the suite.
- Static test suite—This is simply a list of test cases that can be added manually to the suite. A static test suite can also be used as a container for other test suites, giving you a hierarchical option for organizing your tests. Click New ⇒ Suite to add a static test suite to your plan.
You can also copy suites from other plans by clicking the blue arrow. For example, when you create your Beta 2 test plan, you might want to carry forward some of the Beta 1 test suites.
If you highlight a test suite, you see all of that test suite's test cases to the right. You learn how to work with test cases next. For now, note that you can change the State of a test suite by clicking the State dropdown. Test suites can have one of the following three valid states:
- In planning—This state indicates that you are still authoring your test cases and that they aren't yet ready to run.
- In progress—This state means that test cases in this suite should be run by the testing team. Only test suites that are “In progress” show up in the Test activity for testers to run. This is the default state for new test suites.
- Completed—This state should be used when you no longer want to run the test cases that make up this suite. For example, if all of the test cases that make up this suite are passing for current builds, then you may deem it unnecessary to continue to run those tests.
Authoring Test Cases
You can add a test case to a requirements-based test suite or a static test suite by first highlighting that suite, and then clicking New or Add on the right side of the activity window. Click New to create a brand new test case, or Add to browse for an existing test case. When you are adding test cases to a requirements-based test case, a “Tests/Tested By” link is made between your test case work item and the requirement work item.
Clicking New displays a new test case form. Figure 23.9 shows a test case that has already been authored.
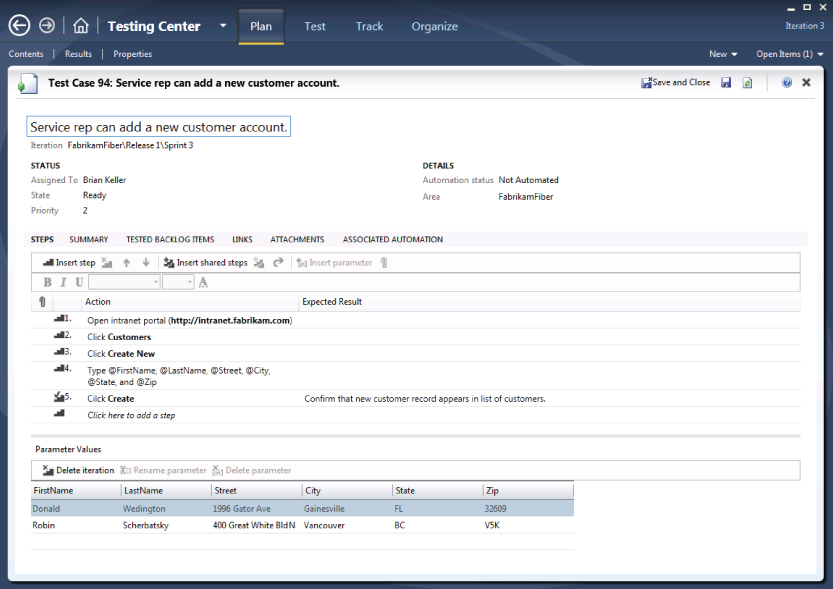
The top portion of this form should look familiar if you've worked with any other work items in Team Foundation Server. But the Steps tab is where the test case form gets interesting because this is where you can author the steps that a generalist tester should take when running this test case.
You can start by simply typing the actions that you want the tester to perform during the test case. Each step should go on a new row. Starting with Visual Studio 2012, you can add rich text within test steps to help improve readability for your testers. For example, you might choose to make any text that a tester needs to type bold to make it easier to read.
You can place your cursor on a new row and begin typing, or press Enter when you are ready to type a new row. You can also use the toolbar to manage the insertion/deletion of steps or to move steps up or down in the list of test steps.
The Expected Result column is used to tell the tester what he or she should be verifying as the tester runs the test case. For example, after creating a new account, the tester should see a message indicating that the account creation was successful. Specifying an expected result changes the test step to be a validation step. The tester is expected to report on the status of each validation step to indicate whether that test step was successful.
You can also add attachments (such as an image) to a test step to provide further instructions to a tester about what to do or what the tester should be verifying. To add an attachment, right-click a test step and click Manage Test Step Attachments. You are prompted to upload the files that you want to attach to this test step.
Finally, you can use parameters to provide different values for a test step. For example, you might want to test the process of creating a new user account by trying different values for username, password, and so on. Instead of writing a new test case for each set of values you want to test, you can simply parameterize a single test case with multiple values. Each row of data you specify results in a separate iteration of the test case during a test run. To create a new parameter, use the @ symbol within a test step preceding a variable name, as shown here:
Type @username and @password and click OK
This creates two parameters, username and password, in the Parameter Values table at the bottom of the test case. You can then supply values for these parameters within the table. These values will be used later when you run the test. Each row of your Parameter Values table corresponds to a unique iteration when running this test case.
Using Shared Steps
There may be times when you have steps within your test plan that are repeated across multiple test cases. A good example of this is the process of creating an account, or signing into a website, before completing other steps within a test case. Instead of authoring (and maintaining) these common steps within each test case, you can utilize shared steps.
Shared steps enable you to author and maintain common test steps within a unique container. Like test cases, shared steps are also persisted as work items within Team Foundation Server. Shared steps are most valuable for protecting your test cases in the event that these common test steps change, such as if you modify the process of creating an account or signing into the application. Instead of needing to change these steps within multiple test cases, you can simply update the shared steps work item. Test cases that include those shared steps are updated automatically. Action recordings, which you learn about later, are also stored within shared steps. This means that you can update the action recordings for a set of shared steps in a single location, instead of needing to re-create the action recording for each test case that includes those shared steps.
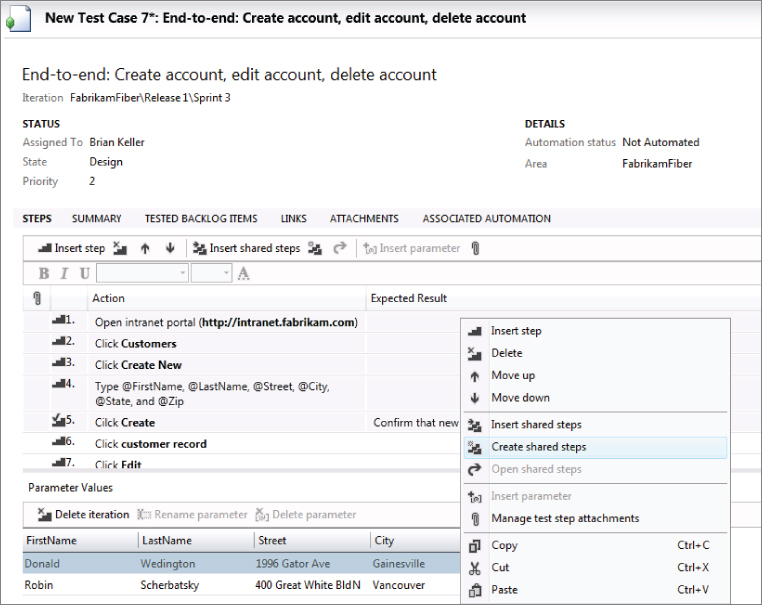
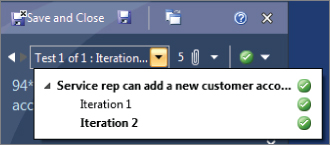
To create shared test steps from within a test case, highlight the first step in the series of common steps that you want to convert into shared steps. While pressing the Shift key, click the last step in the list of steps that you want to convert into shared steps and then right-click this range of steps and select Create Shared Steps, as shown in Figure 23.10.
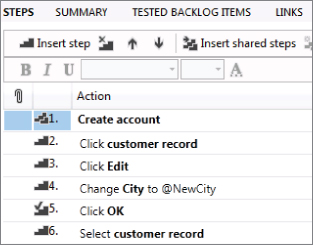
You are prompted to give your shared steps a name. Afterward, the common steps in your test case are collapsed into a single, bolded test step, as shown in Figure 23.11. You can open and edit shared steps by right-clicking them and selecting Open Shared Steps. You can also re-use other shared steps by right-clicking and choosing Insert Shared Steps.
Assigning Configurations
In the “Defining Test Configurations” section of this chapter, you learned how you can assign test configurations to a test plan. This defines the default test configurations that all test cases in this test plan should utilize. However, you can also override your test plan's test configurations setting for individual test cases, or for an individual test suite.
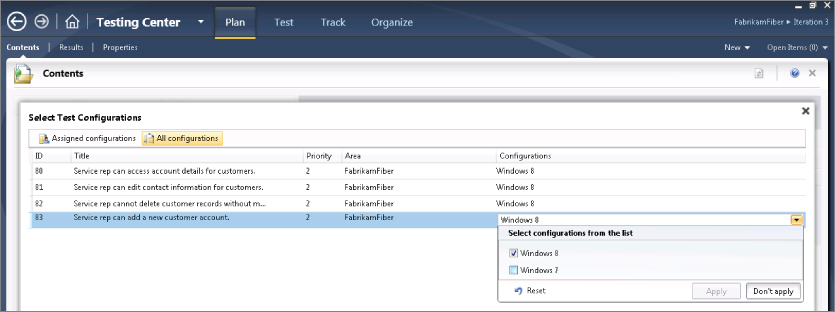
To override the test configuration for an individual test case, first select a test suite from within the Contents planning activity. Then select one or more test cases from the right-hand pane of the activity. Click Configurations to display the Select Test Configurations activity shown in Figure 23.12. Click All Configurations to display the full list of configurations available. From here, you can select the test configurations that should be assigned to this test case.
To apply new test configurations to an entire test suite, right-click the test suite and choose Select Test Configurations for All Tests.
Assigning Testers
You can assign test cases to the testers who should run them. Do this by selecting a test suite and then clicking Assign from within Plan Contents activity. The Assign Testers activity displays, which enables you to assign test cases to individual testers.
Now that you know how to work with test plans, it's time to learn how to run test cases and track their results using Test Manager.
Running Tests and Tracking Results
Open the Run Tests activity (click Test ⇒ Run Tests) to see a view of your test suites and test cases like the one shown in Figure 23.13. The Run Tests activity helps you select which tests to run and track the status of previous test runs.
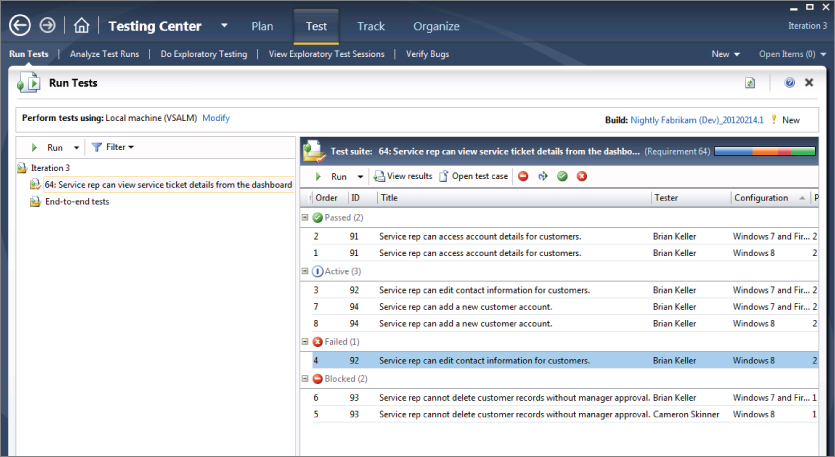
Any test suites that are set to a status of “In progress” are shown along the left side of the activity pane. Along the right side of the activity pane you see the test cases within the currently selected test suite.
Note that each test case may be listed multiple times if there are multiple test configurations assigned to that test case. You can use the Filter button to choose which test configurations you are ready to test. This way, you can show just the test configurations that you can support on the machine configuration you are currently testing with.
This view also shows you the status of each test case from the last time it was run (passed, failed, or active for tests that have not yet been run). Tests that are not ready to be run are marked with a blocked icon. You might want to block certain test cases if they are not yet implemented in the current build you are using, or if you know that they will fail because they depend on other test cases that are failing. For example, a test case that relies on logging in as a new user account could fail if the test case for creating a new account is failing. You can toggle which test cases are blocked by using the Block Test and Reset Test to Active buttons on the right side of the activity pane.
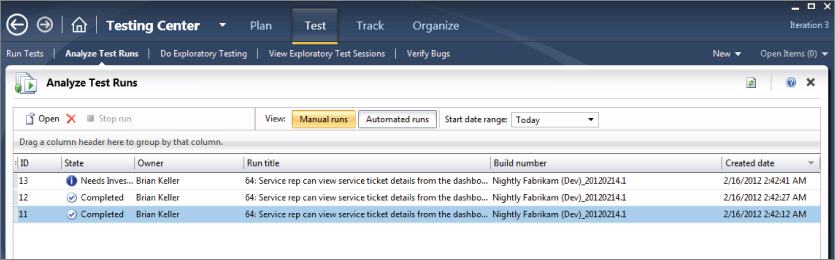
You can learn more about previous runs for a test case by selecting that test case and clicking View Results. You can also use the Analyze Test Runs activity (click Test ⇒ Analyze Test Runs) to view a list of test runs, as shown in Figure 23.14. A test run is a continuous testing session during which one or more test cases are executed, or can represent an exploratory testing session as well (which you learn about later).
The Verify Bugs activity (click Test ⇒Verify Bugs) can provide a list of bugs that were either created by you or assigned to you, as shown in Figure 23.15. Click Assigned to Me or Created by Me to toggle between these views. If a developer has fixed a bug, he or she usually assigns it back to the tester to confirm that the bug can be closed. You can use this activity to determine if any bugs are ready to be verified before being closed. The Integration Build column shows you which build the bug fix has been checked in to so that you can ensure that you are testing with that build (or newer) before attempting to verify a fix. Selecting a bug and clicking Verify launches a new test run for the test case that was originally used to discover that bug.
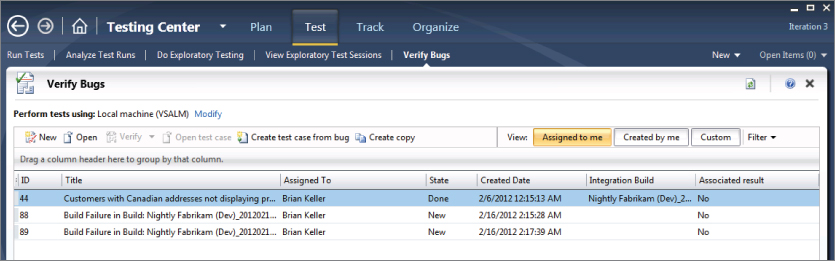
You can also click Custom to construct a custom query from this view, such as to build a query composed of the bugs belonging to all of the members of your team.
Using Test Runner
Test Runner is used to exercise test runs. To start a test run, return to the Run Tests activity (Test ⇒ Run Tests) and select a test case that you want to run. You can also select a range of test cases to run by pressing Shift-click or Ctrl-click. Click Run above the list of test cases to begin a test run.
Test Runner launches as shown in Figure 23.16. Test Runner is now ready to help you run the test cases that you selected for this run.
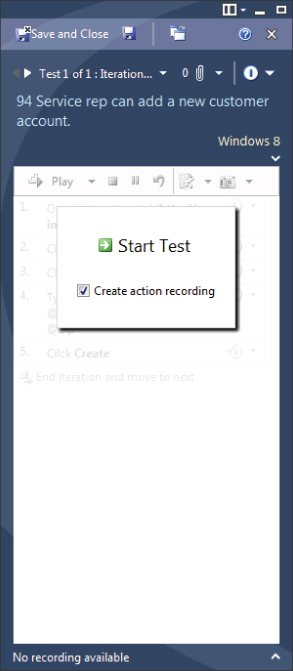
Test Runner enables you to record an action recording that you can use to “fast-forward” through test steps during future test runs. This feature is known as fast-forward for manual testing. Playing back an action recording can dramatically speed a manual test run by performing actions far faster than a human can perform them. Action recordings also make a generalist tester's job less mundane by enabling the tester to focus on examining an application for bugs instead of following a mindless script of clicking and typing repeatedly. You can even use action recordings as the basis for creating fully automated coded UI tests, as you see in Chapter 24.
To create an action recording, select Create Action Recording and click Start Test.
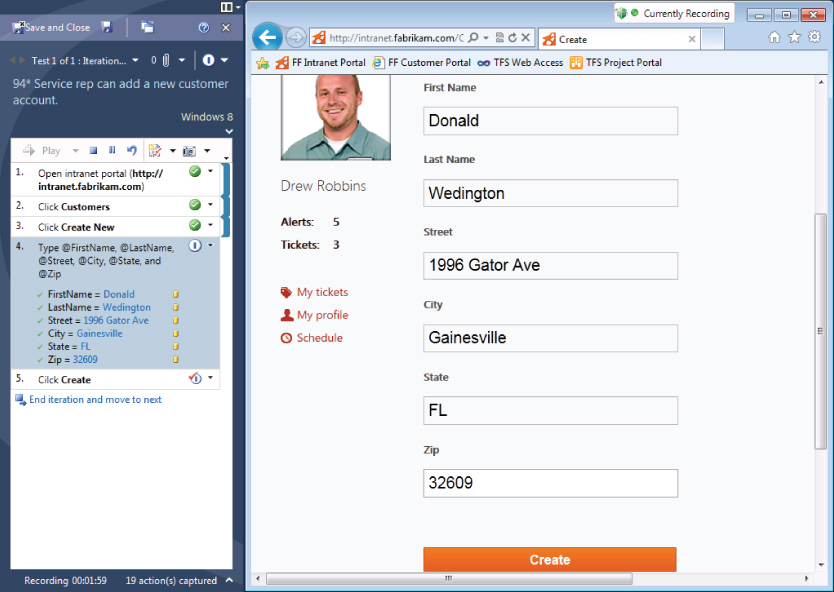
Test Runner opens a list of test steps for the test case you are currently running, as shown in Figure 23.17. If a step has an Expected Result value, it is shown here as well to help guide the tester about what he or she should be validating.
If you choose to create an action recording then every interaction you have with the applications you are testing are captured. To gather a clean recording, you should be careful not to perform steps that are not part of your test case. This includes launching other applications or interacting with the desktop. Interactions with the Test Runner user interface are excluded from your action recording by default, so you don't have to worry about these polluting your recording. You can exclude other applications (such as an instant messaging application) by configuring the test settings for the Action Log, as shown in Figure 23.5. You can also use the Pause button on the Test Runner toolbar to pause the action recording, which enables you to interact with other applications before returning to your test run.
As you are running a test case, you can report on whether each test step passes or fails. Do this by clicking the dropdown to the right of each test step or by using the keyboard shortcuts. By default, Windows key + Shift + P passes a test step, and Windows key + Shift + F fails a test step.
You are only required to report on the status of validation steps, those that are marked with a check mark icon. Failing to indicate whether or not a validation step has passed causes the test case to default to a failed state.
If you are capturing an action recording, you should report on the status of each test step as you perform it. This makes it possible for the action recording log to correlate individual test steps with the actions that they are composed of. This is important for playing back individual test steps later on, and produces more maintainable code when using the action recording to create coded UI tests.
If your test has parameter values, they are automatically copied to your clipboard as they are encountered in your test case. This way, you can simply place your cursor where these values should be entered and press Ctrl + V to paste them. If you are capturing an action recording, Test Runner remembers the field that you pasted those values into and binds that field to the parameter. The binding is used later during playback. Figure 23.17 shows a test step with parameter values being bound to fields on a web application.
After you have finished running your test case iteration, click End Iteration. If your test run includes multiple test cases, or multiple iterations for a given test case, then you can select the next test case or iteration to run from the dropdown menu, as shown in Figure 23.18. A test case can consist of multiple iterations if you are using parameter values. Each row of your parameter values generates a unique iteration.
If an action recording is available for the test case you are running, you see the text Action Recording Available at the bottom of Test Runner. This means that you can use this action recording to play back one or more test steps.
To play back an action recording, select the first step that you want to play back and then press Shift and click the last step that you want to play back. Now, click Play, as shown in Figure 23.19.
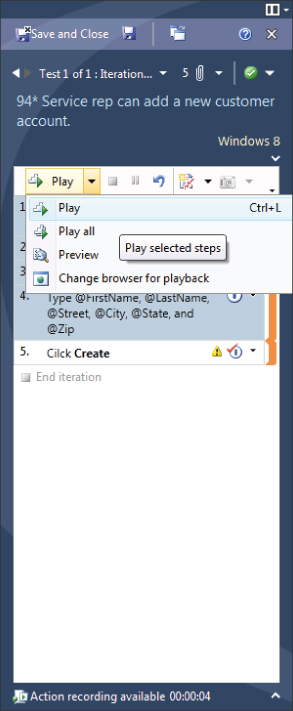
Test Runner begins playing back the actions that you recorded earlier. This includes launching applications, clicking windows and controls, and entering values. It is important that you don't use your mouse or keyboard while this is being played back, or else you might interfere with the playback.
You can use action recordings to play back an entire test case or just sections of a test case. You can also launch playback multiple times within a test case, selecting a new range of test steps each time. Launching multiple times is helpful to give you a chance to inspect the application and verify that it's behaving properly. You may also choose to play back steps of the recording that you know work, and manually perform actions that may not match the last recording (such as if the user interface for the application you are testing changed for a given set of steps). Depending on the type of user interface change, it may eventually become necessary to rerecord the action recording for a test case.
Supported Technologies for Action Recordings
Fast-forward for manual testing requires that your application be built using one of several supported technologies. The testing framework requires that it understands the underlying technology so that it can interact with the application being tested. The list of supported technologies is expected to grow over time, and Visual Studio 2012 offers an extensibility framework to allow third parties to build their own testing providers. However, if your application uses a technology for which there is not a testing provider available, you are unable to benefit from fast-forward for manual testing. You can still benefit from the other capabilities of Microsoft Test Manager.
Filing Bugs and Saving Test Results
You can use Test Runner at any time during a test run to file bugs by clicking the Create Bug icon. If you are adding new information to an existing bug, click the down arrow next to the Create Bug icon and choose Update an Existing Bug to add your new test attachments and test run information to the existing bugs. When you file a bug with Test Runner, all of the attachments from your active test run iteration are included with the bug, making it easier for the developers to understand how your bug was discovered, and providing them with richer information that may be helpful for resolving the bug later on. For example, if you opted to capture an IntelliTrace file it is included here. When the developer opens this bug, he or she can use this data to help diagnose and fix the bug more quickly.
When you are finished with a test run, you should publish the results to Team Foundation Server by clicking Save and Close to save your test run results. You can alternatively abandon a test run by clicking on the X to close Test Runner. These test results can be viewed later from within Test Manager, as shown in Figure 23.20.
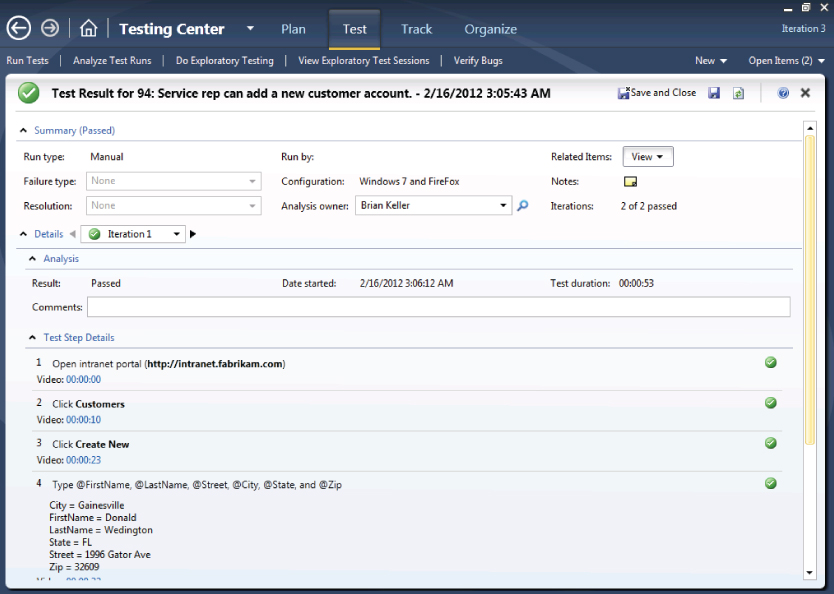
Depending on the test settings you are using, and whether you are capturing an action recording, you may have a variety of attachments included with your test runs. This might include a video recording, action recordings, system information, or any other artifacts that are captured by the data diagnostic adapters you have configured in your test settings. You can also capture additional information (such as screenshots or comments) by using the toolbar above the list of test steps within Test Runner. Some test settings, such as IntelliTrace, only include attachments if a test fails. This is helpful in reducing the amount of storage space required for your test runs.
Exploratory Testing
The process outlined earlier is sometimes referred to as formal test case management. With formal test case management, a test team starts with a list of requirements that a development team is planning and they write a series of test cases designed to validate that the requirements are implemented correctly.
Consider a requirement that a customer can pay for an order with a credit card, which might result in several test cases. One of those test cases should validate that an order is successful when a customer enters a valid credit card number. Another one of those test cases should validate that an error message is displayed if the user attempts to provide an invalid credit card number. Any good test plan captures those test cases and runs tests to validate that each case is successful.
Oftentimes, though, a seasoned tester has other ideas for finding bugs based on applying creative reasoning and experience from finding other software bugs in the past. What happens if the billing address is too big for the textbox provided on the payment page? What if a user presses the web browser's Back key after submitting a payment and then submits it again—is the customer charged twice for the same order? What if a user is very sensitive about privacy when paying for an order online—is it clear from every page in the process where to find a link to the privacy policy?
One could argue that all of the example cases are legitimate test conditions and that an organization should author and run test cases for each of them. And some organizations take this approach. But taking this approach for every single requirement in the system could result in test plans that become cumbersome to author and maintain.
With exploratory testing, also referred to as agile testing, an organization puts their trust in testers to spend time applying their experience and creativity to trying to find these types of bugs. Oftentimes a tester who is unhindered by a scripted test case can find a multitude of bugs very quickly by attempting to break the application from a variety of angles. The tester might spend an hour or two at a time just trying to break the application in different ways and could file several bugs along the way; oftentimes these bugs are ones for which nobody thought to write a formal test case. This is the promise of exploratory testing and why it has grown in popularity in recent years.
However, exploratory testing has its critics. The following reasons are often used to argue against an exploratory testing approach:
- Exploratory testing can generate poor bugs because a tester doesn't always remember exactly what they were doing in the moments leading up to filing a bug.
- Management has poor visibility into what testers are doing during exploratory testing sessions. How do you know when you are “done” with exploratory testing unless you have a good record of what you tested?
- If a bug is discovered during an exploratory testing approach, how can you ensure that after the bug is fixed it won't be regressed in the future? This assumes that a subsequent testing session also happens to take this same approach, and the very nature of exploratory testing means that this isn't guaranteed.
These are all valid criticisms of traditional exploratory testing approaches. However with Visual Studio 2012, Microsoft has addressed these criticisms by building first-class support for exploratory testing directly into Microsoft Test Manager:
- Testers can capture rich data, based on their test settings (discussed earlier in this chapter), which can provide contextual, actionable information about test runs if bugs are encountered.
- Exploratory testing session results can be stored in Team Foundation Server and analyzed to determine who conducted exploratory testing, what approaches they used, how many bugs they uncovered, and so on. This can give management the metrics they need to understand the effect of exploratory testing and to help understand when you are “done” testing an application.
- If a bug is encountered, a test case can be created at the same time to help determine if bugs are regressed in the future.
To understand this approach it may be useful to take a look at an exploratory testing session being run with Microsoft Test Manager. To get started with an exploratory testing session, click Test ⇒ Do Exploratory Testing. You see a screen similar to that of Figure 23.21.
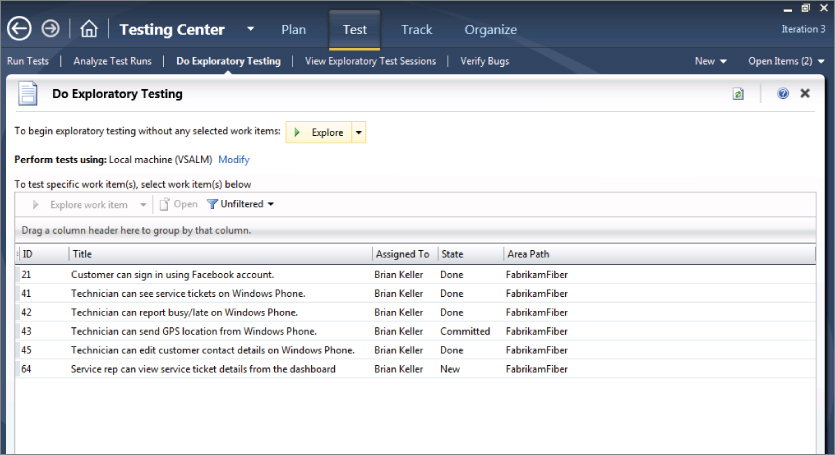
From this screen you can either click Explore to start an ad hoc exploratory testing session, or you can click on one or more work items in the list below then click Explore Work Item. By default this list of work items includes the requirements for your test plan iteration, but you can click Unfiltered to edit this query.
If you selected a work item for your exploratory testing session, your test results are automatically linked to that work item. This enables you to report on a given work item later to see if a tester has spent time testing it with an exploratory testing approach. It also means that any bugs you file during this exploratory testing session by default are linked to that work item, although you can modify this before filing the bug if desired.
After you have started your exploratory testing session, Test Runner launches and you can begin testing your application. Test Runner begins collecting data based on your test settings. The main difference is that Test Runner does not provide a list of test steps because you are not running a specific test case. At this point you can begin testing your application in an exploratory fashion using whatever approach you want to look for bugs.
If and when you find a bug, you can use Test Runner to capture notes, screenshots, and file a bug as you normally would. When filing a bug from an exploratory testing session, however, the bug looks slightly different from a bug created with a test case. Figure 23.22 shows a bug that was created from an exploratory testing session.
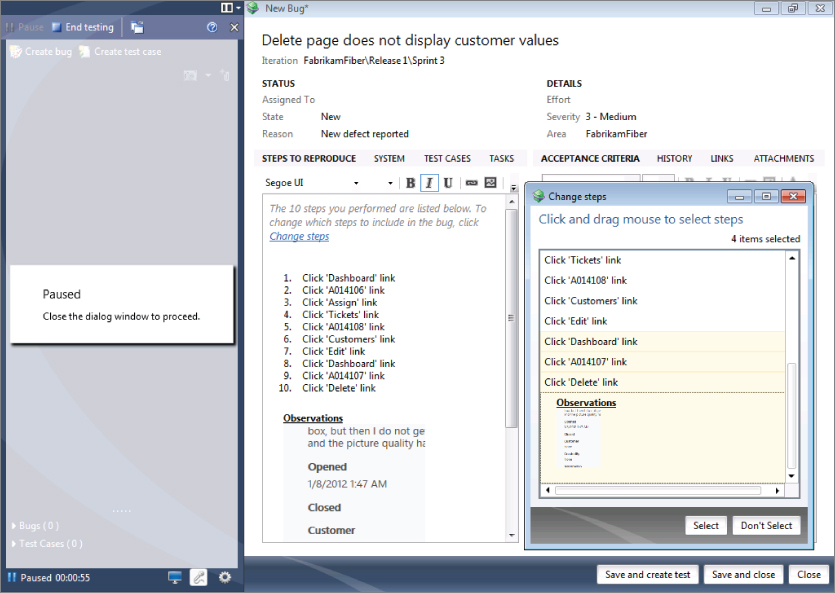
Notice that all of the steps you took since starting the exploratory testing session are listed in the bug by default, assuming that the application you are testing is supported for action recordings as discussed earlier in this chapter. But with an exploratory testing session, you might be testing multiple aspects of the application before you run across a valid bug. Including all of these actions might cause confusion for a developer who is looking at this bug trying to understand what the root cause was.
You can click Change Steps if you want to scope your actions down to the steps you believe are most relevant for the bug you have found. Use the Change Steps dialog (also shown in Figure 23.22) to select the range of test steps you believe are relevant to the bug. When in doubt, you should err on the side of including additional steps. The root cause of the bug might be because of some action you performed during a preceding action. When you change the steps for your bug, the action log is scoped accordingly.
You can choose to save this bug at this point, but you can also create a test case from this bug as well by clicking Save and Create Test. Creating a test case based on this bug helps to ensure that it becomes a part of your formal test plan in the future. That way after the bug is fixed, you ensure that your team tests this functionality in future builds to verify that it doesn't regress.
Your test case is prepopulated with all the steps you selected earlier. You can modify this list of test steps before saving it. For example, if the bug you discovered was on a customer details page several levels deep in your application you might need to add some preliminary steps that instruct the tester on how to get to that particular page.
Running Automated Tests
Over time, you may decide to add automated tests to your test plan. Automated tests are more expensive to author and maintain, but they have the benefit of being capable of running without manual interaction, making them suitable for quickly catching bugs caused by changes to source code. In Chapter 22 you learned how you can use Visual Studio to manage automated tests (such as unit tests, coded UI tests, and web performance tests). But you can also manage automated tests as part of the same test plans that you use within Test Manager.
Automated tests can be run as part of your automated builds, and the status of those tests can be published along with the rest of the tests within your test plan. The main advantage of managing your automated tests along with your manual tests is that you can gain a consolidated view across your entire test plan of how your application's quality is trending. Automated tests can also be triggered automatically as part of a build-deploy-test workflow, which you will learn about in Chapter 26.
To utilize automated tests within Test Manager, you must first create an automated test in Visual Studio and check it in as part of your Team Foundation Server source control. Next, from within Visual Studio, open the work item corresponding to the test case that you want to automate. Click the Associated Automation tab, as shown in Figure 23.23.
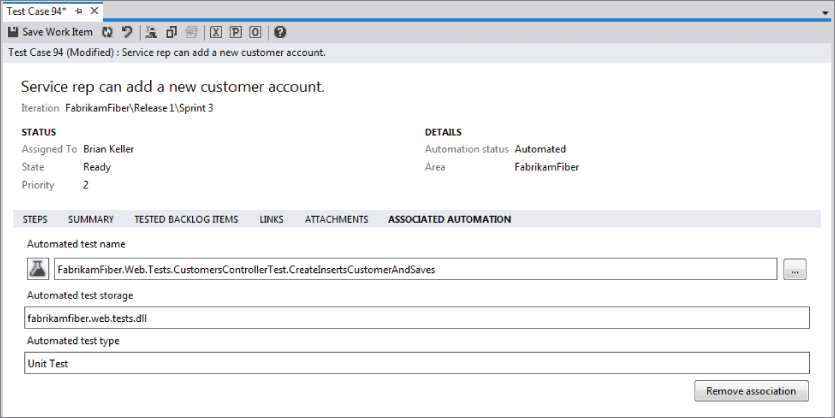
Use the ellipsis (…) to the right of the Automated Test Name field to browse for the automated test you want to use when running this test case. After you've selected it, the rest of the fields on this form are populated for you. Save the work item.
Now, when you run this test from within Test Manager, it runs automatically without requiring user intervention. Additionally, if you configure Team Foundation Build to run this test as part of an automated build (see Chapter 5), then the status of this test is automatically reported back to your test plan, so there is no need to run this test from within Test Manager unless you want to reproduce a test run.
You learn how to create a coded UI test in Chapter 24. After creating a coded UI test, you may want to revisit this topic to wire up your coded UI test as associated automation for an existing test case.
Summary
This chapter provided you with a basic understanding of how Microsoft Test Manager can help testers author, manage, and execute manual test plans. You learned how features such as test impact analysis can help you determine which test cases to run next.
You learned how Test Runner guides a generalist tester through the steps that make up a test case, and how it allows for granular reporting of whether each test step passed or failed. You saw how action recordings can make generalist testers more efficient by helping them “fast forward” through ranges of test steps. You also learned how you can run tests in an exploratory fashion, and how you can discover and create new test cases as required during this approach.
You also learned how Microsoft Test Manager combined with Team Foundation Server 2012 can improve communications between testers and developers by automatically capturing rich information about test runs. This information can help developers understand how bugs were encountered, and can even provide them with information to help them more quickly resolve those bugs.
In Chapter 24, you discover how you can convert manual test cases into fully automated UI tests by starting with the action recordings you captured using Test Runner. In Chapter 26, you learn how Microsoft Test Manager can be used to create virtual environments for running your tests.