
45.4. .NET Framework Reference Source
One of the more interesting trends that has emerged from Microsoft in recent years is an increased openness and even willingness to embrace open source. The ASP.NET MVC framework, covered in Chapter 37, is a good example of this, because the source code for this has been released as a buildable Visual Studio project solution.
However, arguably more significant than this has been the release of the source code for a large number of base class libraries in the .NET Framework. Available under the read-only Microsoft Reference License, it allows you to step into and debug the .NET Framework code as part of a debugging session. Though we could always infer the programmer's intent by using Reflector, there is no comparison to browsing the actual source code, including the inline documentation. The really good news is that this documentation is quite comprehensive.
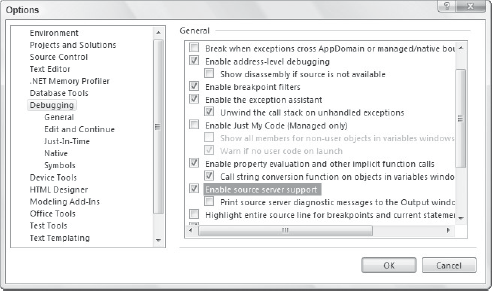
The first step to enabling access to the source code is to configure a couple of Debugger settings. Open the Tools ![]() Options menu item and select the Debugging tab. If you are using the Visual Basic Profile, you'll need to select the Show All Settings option to see all these options. Ensure that the Enable Just My Code option is unchecked, and the "Enable source server support" option is checked, as shown in Figure 45-9.
Options menu item and select the Debugging tab. If you are using the Visual Basic Profile, you'll need to select the Show All Settings option to see all these options. Ensure that the Enable Just My Code option is unchecked, and the "Enable source server support" option is checked, as shown in Figure 45-9.
Figure 45.9. Figure 45-9
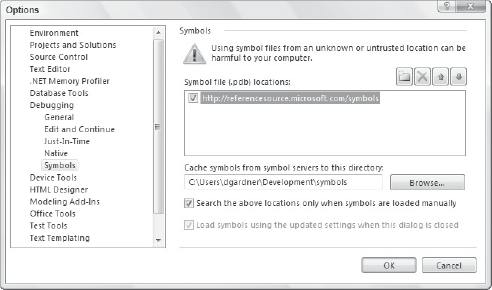
Secondly, navigate to the Symbols tab in the Options dialog and add a new symbol file location. Specify http://referencesource.microsoft.com/symbols as the new location. Next, enter a local directory to store the cached symbol files. It is important that you have read/write access to this directory without requiring elevated permissions. Finally, ensure that the "Search the above locations only when symbols are loaded manually" option is enabled. When you have finished, your screen should look similar to Figure 45-10.
Figure 45.10. Figure 45-10
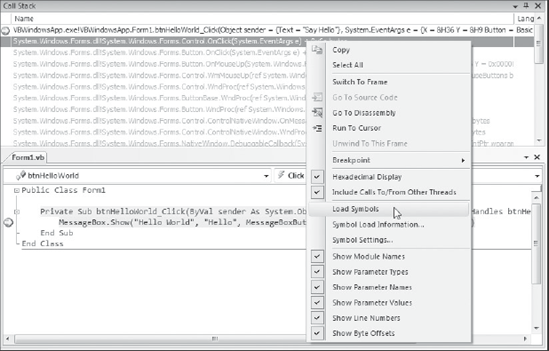
You will now be able to download and browse the .NET Framework base class libraries during a debugging session. Set a breakpoint in your application code and run in debug mode. When the breakpoint is hit, open the Call Stack window (Debug ![]() Windows
Windows ![]() Call Stack) to display the execution path. You can load the source code for a framework assembly by right-clicking the reference in the Call Stack window and selecting Load Symbols, as shown in Figure 45-11.
Call Stack) to display the execution path. You can load the source code for a framework assembly by right-clicking the reference in the Call Stack window and selecting Load Symbols, as shown in Figure 45-11.
Figure 45.11. Figure 45-11
The Microsoft symbol server will be queried to determine which source code files are available. Once completed, the code that is available for debugging will no longer be grayed out, and you will be able to double-click the entry in the Call Stack to download the source code from the Microsoft symbol server and cache it on your local computer. If this is the first time you have downloaded the code, you will be prompted to accept the Microsoft Reference Library license.
Depending on the size of the assembly and your available bandwidth, the symbols could take a minute or so to download, during which time Visual Studio will be unresponsive. Once completed, you will be able to double-click the entry in the Call Stack, or step into the source code during your debug session, as shown in Figure 45-12.
Figure 45.12. Figure 45-12
