
WHAT'S IN THIS CHAPTER?
Using Visual Studio to debug both server-side ASP.NET code and client-side JavaScript running in a web browser
Enabling and viewing ASP.NET trace logs for an individual web page or the entire application
Configuring Health Monitoring so that you are notified as soon as a problem occurs in an ASP.NET application
With Visual Studio 2010, debugging solutions for the Web is just as straightforward as doing the same for Windows-based applications. You can use most of the same debugging windows already discussed in previous chapters, as well as deal with errors through the Exception Assistant. However, there are some differences and additional features specific to web applications that you can use to target your debugging practices more closely to the web paradigm.
In addition to the standard debugging techniques, ASP.NET also provides you with a comprehensive tracing capability, and even the capability to perform health monitoring on your system to ensure it is running in the manner you expect, and exposing problematic scenarios when it doesn't.
Note
If you are using Windows Vista or Windows 7 with UAC, and you use IIS rather than the built-in web development server for debugging, then you must launch Visual Studio with administrator rights. Right-click the Visual Studio 2010 shortcut and select Run as Administrator. To always launch as administrator, right-click the shortcut and select Properties, and then select the Compatibility tab and check the Run This Program as an Administrator checkbox.
Before you can perform any level of debugging in a web application, you first need to ensure that ASP.NET debugging is enabled in your web-application or web site project. For web application projects, enable debugging options by right-clicking the project entry in the Solution Explorer and selecting Properties. Select the Web tab option page and ensure that the ASP.NET debugger option is checked, as illustrated in Figure 42-1.

If you want to be able to include unmanaged code, stored procedures, or Silverlight in your debugging of the web applications, you can activate the Native Code, SQL Server, and Silverlight debuggers here. Native code and SQL Server debugging are explained in the next chapter and Silverlight debugging is discussed later in this chapter.
Note
Enabling debugging in other web application projects, such as ASP.NET Web Service or ASP.NET MVC applications, is exactly the same as for standard ASP.NET web applications. In fact, from a debugging perspective, there are really no differences between any of these project types.
Because web site projects do not have a project file, you must use a slightly different procedure to enable debugging. Enable debugging in web site projects by right-clicking the project entry in the Solution Explorer and selecting Property Pages from the context menu. When the Property Pages dialog is displayed, navigate to the Start Options page, and ensure that the ASP.NET debugger option is checked, as shown in Figure 42-2.
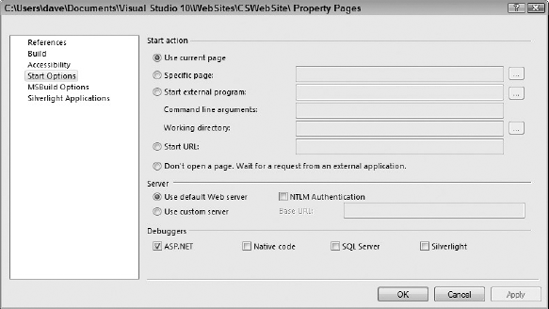
As with web application projects, you can also customize how a web site project is to be started, including not opening any specific page, but running the server so it listens for a request from another application.
In addition to enabling the ASP.NET debugger in the property pages, you must enable the compiler debug option in the web.config file. Locate the compilation node within system.web and set the debug attribute to true. The following code shows a minimal web.config file with the debug option enabled, ready for hooking the debugger to the application:
<?xml version="1.0"?>
<configuration>
    <system.web>
        <compilation debug="true" targetFramework="4.0" />
    </system.web>
    <system.webServer>
        <modules runAllManagedModulesForAllRequests="true" />
    </system.webServer>
</configuration>
Note that even when you activate the ASP.NET debugger in the Start Options, without setting the debug attribute to true you will be unable to debug the application. However, Visual Studio will detect this discrepancy and present you with a dialog informing you that in order to debug you will need to change the web.config file. It also provides an option for Visual Studio to automatically change this attribute for you.
Note
You should never deploy an ASP.NET application into production with the debug="true" option set within the web.config file. Doing so will cause your application to run slower, use more memory, and prevent some items from being cached.
By default, when your web application encounters an exception it displays the ASP.NET server error page, as shown in Figure 42-3. Colloquially called the Yellow Screen of Death, this page displays the exception details including the stack trace.
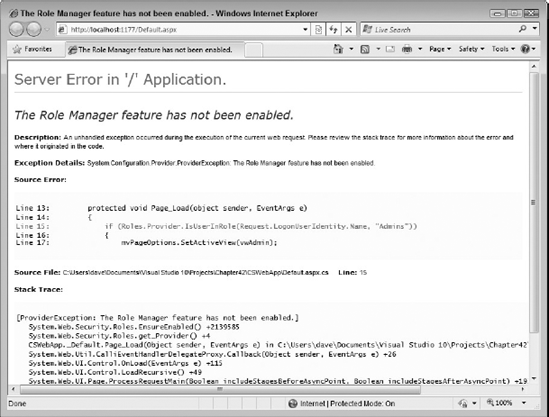
The server error page is generated under both debug and normal execution. Although it is useful to have this information during development, it is not something that you should be displaying to your end users. Fortunately, there is an easy way to configure redirections for exceptions, including standard HTTP errors, by editing the customErrors section in the web.config file.
Modifying the previous web.config file to include these redirection options for 403 (access denied) and 404 (page not found) can result in a configuration similar to the following:
<?xml version="1.0"?>
<configuration>
    <system.web>
        <compilation debug="true" targetFramework="4.0" />
        <customErrors mode="RemoteOnly" defaultRedirect="GenericErrorPage.htm">
            <error statusCode="403" redirect="AccessDenied.html" />
            <error statusCode="404" redirect="PageNotFound.html" />
        </customErrors>
</system.web>
<system.webServer>
<modules runAllManagedModulesForAllRequests="true" />
</system.webServer>
</configuration>The mode attribute of the customErrors section defines three options for displaying a custom error page instead of the default server error page. These are:
On: The custom error page will always be displayed.
Off: The server error page will always be displayed.
RemoteOnly: The server error page will be displayed if the browser request is coming from the local computer; otherwise, the custom error page will be displayed.
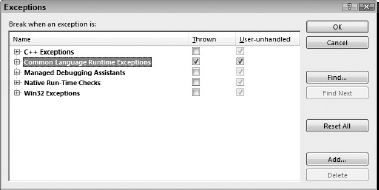
The server error page is useful in production scenarios where you cannot run the application in Debug mode. However, when debugging, it is much more useful to break execution as soon as an exception occurs. You can do this by enabling the Break When an Exception Is Thrown option for the Common Language Runtime. Figure 42-4 shows how this option is set in the Exceptions dialog under the Debug
Once you have enabled this option, when an exception occurs, Visual Studio drops back into the IDE and positions the workspace so the statement at issue is visible. Just like Windows-based applications, Visual Studio can aid you when errors occur by displaying the Exception Assistant. As shown in Figure 42-5, web errors are fully detailed and include information about which part of the statement is in error.
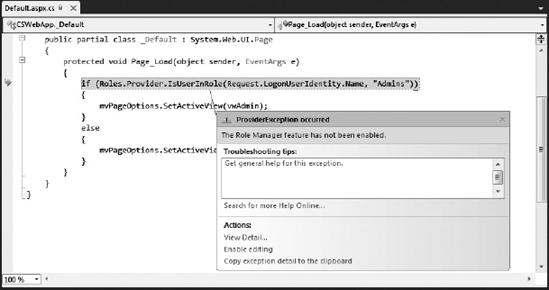
You can gather additional information on the error by clicking the View Detail link, which provides you with a comprehensive exception object visualizer that you can navigate to determine the content of the error at hand.
Edit and Continue, which enables you to modify code when the application is paused in a debug session, is disabled by default in ASP.NET web applications. This useful feature can be enabled by right-clicking the project entry in the Solution Explorer and selecting Properties. Under the Web tab option page, check the Enable Edit and Continue option. This is only supported for the built-in Visual Studio development web server.
Web site projects do not support Edit and Continue, however, because they naturally support a very iterative style of development; it is not such a useful feature for those projects. Edit and Continue is explained in more detail in Chapter 40.
Although debugging your applications is indeed easy with the tools Visual Studio 2010 provides, it is always best to try to avoid error situations proactively. You can do this in web applications with structured Try-Catch exception handling, but you will also want to make your solutions more solid by including code to handle any errors that fall outside any Catch conditions.
Note
Notice we are using the term error handling and not exception handling here. This is because it is broader than trapping program exceptions and also covers HTML errors, such as Page Not Found and Authentication Required.
You can catch errors on two levels — on an individual page you can intercept unexpected errors and produce a custom-built error, or you can catch errors on an application-wide level through the implementation of a routine to handle errors in the global.asax file.
To handle an error on an individual page, you need to implement an event handler routine that intercepts the MyBase.Error event. When this event is raised, you can then perform whatever actions you need to take place when unexpected errors occur. A typical routine might look like this:
- C#
void Page_Error(object sender, EventArgs e) { Response.Write("An unexpected error has occurred."); Server.ClearError(); }- VB
Private Sub Page_Error(ByVal sender As Object, ByVal e As System.EventArgs) _ Handles MyBase.Error Response.Write("An unexpected error has occurred.") Server.ClearError() End Sub
As discussed previously, you can also set custom redirections for standard HTTP error codes in the web.config file, so you should use this method only for errors that are not already handled and are specific to the individual page.
At the web application level, you can also trap a series of errors through the global.asax file. By default, Visual Studio 2010 web projects do not include this file, so you'll first need to add it to the project through the Add New Item dialog. Select the Global Application Class item, leave the name as global.asax, and click Add to add the file to your project.
When this class is added to the project, the template includes stubs for the commonly encountered application events, including the error event. To handle any errors that are not catered to elsewhere in the project, add your processing code to this Application_Error routine, like so:
- C#
protected void Session_End(object sender, EventArgs e) { Server.Transfer("UnexpectedError.aspx"); }- VB
Sub Application_Error(ByVal sender As Object, ByVal e As EventArgs) Server.Transfer("UnexpectedError.aspx") End Sub
This sample routine simply transfers the user to an errors page that determines what to do by interrogating the Server.GetLastError property.
One of the most useful features of Visual Studio 2010 for front-end web developers is the excellent support for debugging client-side JavaScript code. Combined with the IntelliSense support for JavaScript, this significantly eases the difficulty of developing JavaScript code.
Note
JavaScript debugging works only if you are using Internet Explorer as your web browser during the debug session.
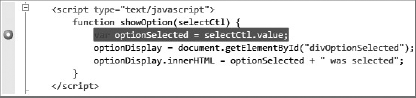
Setting breakpoints for JavaScript code is no different from setting any other breakpoint. Within the editor window, any breakpoints in JavaScript code are displayed with a white circle in the center, as shown in Figure 42-6.
Warning
JavaScript debugging will be disabled if the Silverlight debugger is enabled.
Note
JavaScript breakpoints have the same functionality as standard breakpoints. This includes setting conditions, hit counts, or even running a macro as part of a tracepoint.
When the debugger hits a breakpoint, it pauses execution and displays the HTML code that has been rendered on the client, as shown in Figure 42-7. This provides a true debug experience, because it includes all client-side elements such as the ViewState and server controls rendered in HTML.
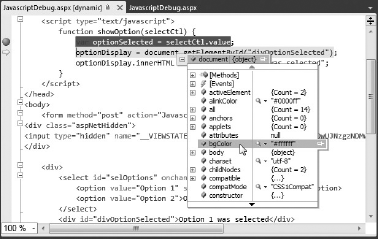
Visual Studio 2010 also has comprehensive watch visualizers for client-side elements. Figure 42-7 demonstrates this with a tooltip that shows the properties and methods of the document object.
It is also possible to set both client-side JavaScript breakpoints and Visual Basic or C# server-side breakpoints at the same time on the same page. This enables you to step through both server-side and client-side code in a single debug session.
Several scenarios exist where ASP.NET sends down to the client JavaScript that has been dynamically generated on the server. For example, the ASP.NET AJAX controls such as the Update Panel will generate client-side JavaScript files that are actually stored as resources in the ScriptManager control.
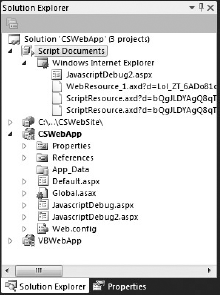
When you are running a web application in Debug mode, the Visual Studio Solution Explorer shows a list of all the script references that the page you are debugging has loaded, as shown in Figure 42-8. Double-clicking any of the links under the Script Documents node displays the JavaScript code and enables you to set breakpoints within those scripts.
ASP.NET AJAX provides both Debug and Release versions of its client JavaScript libraries. The Release version is optimized for performance and minimizes the size of the JavaScript that must be downloaded to the client. The Debug version is more verbose and provides additional debugging features at runtime, such as type and argument checking.
If debugging is enabled in the web.config file, ASP.NET AJAX uses a debug version of the client libraries. You can also enable the debug version on a per-page basis by setting ScriptMode="Debug" on the ScriptManager control.
ASP.NET AJAX also includes the Sys.Debug class, which can be used to add debug statements to your client JavaScript. This class can be used to display the properties of objects at run time, generate trace messages, or use assertions.
Visual Studio 2010 includes a native debugger that makes it easy to debug Silverlight applications. When you create a new Silverlight application, Visual Studio prompts you either to generate an HTML test page to host the Silverlight application, or to utilize an existing or new web project, as shown in Figure 42-9.
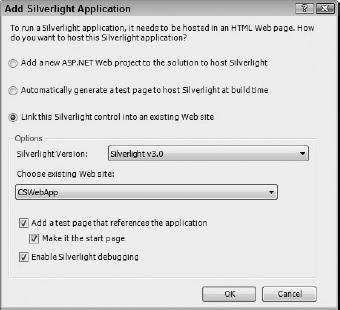
In Figure 42-9, we've chosen to create a test page that hosts the Silverlight application in the web application project that is part of the existing solution, and to enable Silverlight debugging in this web application. If you select either of the other two options, you will not need to perform any additional steps to enable Silverlight debugging.
You can always enable or display support for Silverlight debugging in an existing web application project under the Web option page of the project properties.
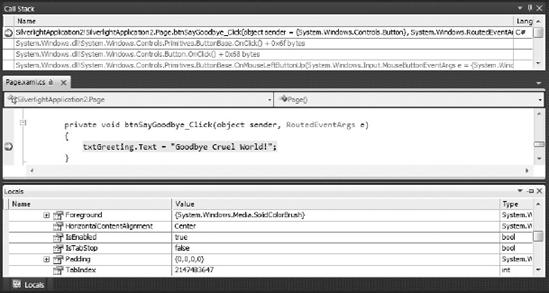
Once the Silverlight debugger is enabled, you are able to set breakpoints in the code-behind class files of the XAML pages. When the breakpoint is encountered during debugging, the session pauses and displays the current line of code, as shown in Figure 42-10. You will be able to step through the code, view the call stack, and interrogate the properties of objects, just as you would with any Web or Windows Forms application.
The only major limitations with Silverlight debugging are that Edit and Continue are not supported and JavaScript debugging is disabled.
In addition to actively debugging your web applications when things go wrong, you can also implement ASP.NET tracing functionality to look at the information produced in an individual page request. Using tracing enables you to add debug statements to your code that are only viewable when viewing locally; when the web application is deployed to the remote server, users do not see the trace information.
Trace information can include variables and simple objects to help you determine the state of the specific request and how it was executed. Note that ASP.NET tracing is different from using the Trace class in normal Windows applications in that its output is produced on the actual ASP.NET web page or in a standalone trace viewer, rather than the output windows that Trace commands use.
To implement page-level tracing, you simply need to include a trace attribute in the @Page directive at the top of the page you want to trace. A simple ASPX page with tracing activated might look like the following:
<%@ Page Language="C#" AutoEventWireup="true" Trace="true"
TraceMode="SortByCategory" CodeBehind="ShowTrace.aspx.cs"
Inherits="CSWebApp.ShowTrace" %>
<!DOCTYPE html PUBLIC "-//W3C//DTD XHTML 1.0 Transitional//EN"
"http://www.w3.org/TR/xhtml1/DTD/xhtml1-transitional.dtd">
<html xmlns="http://www.w3.org/1999/xhtml" >
<head runat="server">
<title>Trace Example Page</title>
</head>
<body>
<form runat="server">
<div>Hello!</div>
</form>
</body>
</html>In addition, you can specify how the tracing messages associated with the page request should appear by using the TraceMode attribute. Set this to SortByTime to output the tracing messages in the order that they were produced, or SortByCategory to categorize them into different message types. Figure 42-11 shows the trace output for the sample page defined in the previous code when sorted by category.

Application-level tracing can be enabled through the web.config file. Within the system.web node, you need to include a trace node that contains the attribute enabled with a value of true. When using application-level tracing, you can control how the tracing is produced through the pageOutput attribute. When set to true, you receive the tracing information at the bottom of every page (similar to how it appears in Figure 42-11), whereas a value of false ensures that the tracing information never appears on the page, and is instead only accessible through the Trace Viewer (covered later in this chapter). You can also restrict the amount of information to trace with the requestLimit attribute. Including a trace node for the web.config file you saw earlier in this chapter results in a configuration like the following:
<?xml version="1.0"?>
<configuration>
<system.web>
<compilation debug="true" targetFramework="4.0" />
<customErrors mode="RemoteOnly" defaultRedirect="GenericErrorPage.htm">
<error statusCode="403" redirect="AccessDenied.html" />
<error statusCode="404" redirect="PageNotFound.html" />
</customErrors>
<trace enabled="true" pageOutput="false" traceMode="SortByCategory"/>
</system.web>
    <system.webServer>
        <modules runAllManagedModulesForAllRequests="true" />
    </system.webServer>
</configuration>
</system.web>
</configuration>Tracing output is voluminous. The simple Hello page defined earlier produces almost three full printed pages of information, including the following categories of data:
Request Details: The specific details of the current session, time of the request, what type of request it was, and the HTTP code that is returned to the browser.
Trace Information: A full listing of each event as it begins and then ends, including the amount of time taken to process each event.
Control Tree: A listing of all controls defined on the page, including the page object itself, as well as HTML elements. Each object also has a size listed, so you can determine whether any abnormal object sizes are affecting your application's performance.
Session State and Application State: These two lists show the keys and their values for the individual session and the application overall.
Request Cookies Collection and Response Cookies Collection: A list of any known ASP.NET request and response cookies on the system that your application may be able to access.
Headers Collection: A list of the HTTP headers included in the page.
Response Headers Collection: The HTTP headers associated with the response, indicating what type of object is being returned.
Form Collection: A list of any forms defined in the page.
Querystring Collection: A list of any query strings used in the page request.
Server Variables: A list of all server variables known to the ASP.NET server and application you're currently executing.
As you can see, when tracing is implemented for a web page or application, you gain access to an enormous amount of information that you can then use to determine how your application is performing. You can see whether problems exist in the various collections in the way of missing or extraneous data, as well as analyze the Trace Information list to determine whether there are any abnormally long processing times for any specific events.
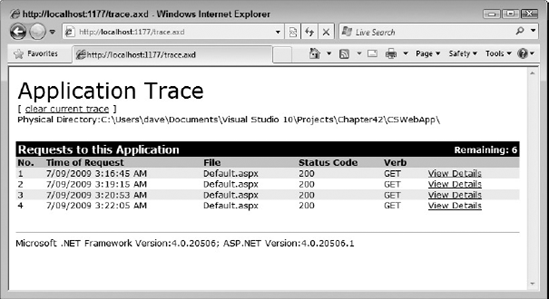
The Trace Viewer is a custom handler included in your web application when you have application tracing activated. When tracing is being reported at the application level, you can navigate to this page and view all page tracing output as it occurs. To view the Trace Viewer, browse to the trace.axd page in the root directory of your web site.
The Trace Viewer provides a summary table of all requests made in the application, along with the time the request was made and the HTTP status code returned in the response. It also provides a link to detailed information for each request (which is the same information that you can see on a page trace discussed earlier), as shown in Figure 42-12.
You can supplement the default trace information with your own custom-built trace messages, using the Trace.Warn and Trace.Write methods. Both have the same set of syntactical overloads, and the only real difference is that messages outputted using the Warn method are displayed in red text.
The simplest form for these commands is to include a message string like so:
Trace.Warn("Encountered a potential issue")However, you can categorize your warnings and messages by using the second and third forms of the methods, including a category and optionally an error object as well:
Trace.Warn("MyApp Error Category", "Encountered a potential issue", myAppException)ASP.NET includes a built-in framework for generating and capturing events for the purposes of monitoring a web application. This feature, called Health Monitoring, allows you to become more proactive in managing your production web applications, enabling you to be notified as soon as a problem occurs.
Note
The Health Monitoring provides much more than just alerting you that an exception has occurred. You can also instrument your code and generate alerts for custom events; for example, if a user fails to log on or attempts to access a restricted area.
Health Monitoring is enabled through the web.config file. Within the system.web node you need to include a healthMonitoring node that contains the attribute enabled with a value of true. This node will also contain the details of which provider to use and rules for handling different events. Extending the web.config file from earlier, we have created an SMTP provider and a rule that e-mails the details of any unhandled exceptions to the webmaster. The web.config file has also been modified to include a reference to an SMTP server, so that the provider can send the e-mail notifications.
<?xml version="1.0"?>
<configuration>
    <system.web>
        <compilation debug="true" targetFramework="4.0" />
        <customErrors mode="RemoteOnly" defaultRedirect="GenericErrorPage.htm">
            <error statusCode="403" redirect="AccessDenied.html" />
            <error statusCode="404" redirect="PageNotFound.html" />
        </customErrors>
        <trace enabled="true" pageOutput="false" traceMode="SortByCategory"/>
        <healthMonitoring enabled="true">
            <providers>
                <add name="SMTPProvider"
type="System.Web.Management.SimpleMailWebEventProvider"from="[email protected]" to="[email protected]" subjectPrefix="Exception on WebApp:" bufferMode="Critical Notification"/> </providers> <rules> <clear /> <add name="All Errors Default" eventName="All Errors" provider="SMTPProvider" /> </rules> </healthMonitoring> </system.web><system.net><mailSettings> <smtp><network host="mail.yourdomain.com"/></smtp> </mailSettings> </system.net> <system.webServer> <modules runAllManagedModulesForAllRequests="true" /> </system.webServer> </configuration>
Once this is in place, anytime an exception is generated and not handled, an e-mail is sent to the specified address. This e-mail message contains a large amount of useful troubleshooting information, including the exception details and stack trace. Figure 42-13 shows an example message.
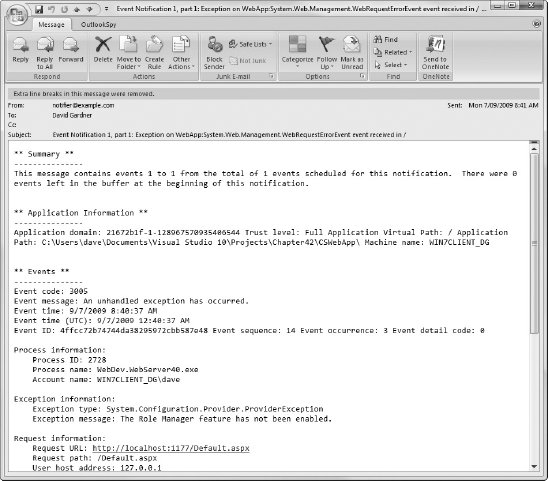
In addition to the SMTP provider, there is also an Event Log, WMI, and SQL Server provider. Quite complex rules can be enabled to direct the notifications to one of more of these providers. If none of these meet your needs, you can even write your own custom provider.
With the combination of Visual Studio 2010 and ASP.NET server-side capabilities, you have a wide array of tools to help you look after your web solutions. These features enhance the already impressive feature set available with normal Windows application debugging, with web-specific features such as JavaScript and Silverlight debugging, page- and application-level error handling, and the capability to trace code, which you can use to monitor the way pages are being executed in your web applications without interrupting your end users.
In addition, the ASP.NET Health Monitoring framework enables you to proactively manage your production web applications by notifying you as soon as a problem occurs.