
43.1. Attributes
This section begins by outlining a number of debugging attributes that can be applied to code to affect the way the debugger steps through it. Some of the debugging attributes can also be used to customize the appearance of your types when you hover over them in Break mode.
The debugging attribute classes are contained within the System.Diagnostics namespace. Rather than specify the full namespace for each attribute, the source code examples in this chapter assume that it has been added as an import.
43.1.1. DebuggerBrowsable
The first attribute you can apply to fields and properties that belong to a C# class is the DebuggerBrowsable attribute. Although this attribute can be applied to both C# and Visual Basic code, it is only interpreted by the C# debugger. This attribute takes a single parameter that determines how the member is displayed in the variable tree. In the following code snippet, the field Orders is set to Collapsed:
public class Customer
{
    [DebuggerBrowsable(DebuggerBrowsableState.Collapsed)]
    public List<Order> Orders;

}
Figure 43-1 (left) shows the same snippet of code with DebuggerBrowsable initially set to Collapsed (or not specified). Figure 43-1 (center) shows the same snippet with DebuggerBrowsable set to the RootHidden value, where the actual Orders item does not appear, just the contents of the collection. Finally, in Figure 43-1 (right) the Never value is used for DebuggerBrowsable, in which case the Orders member does not appear at all.
Figure 43.1. Figure 43-1

43.1.2. DebuggerDisplay
When you hover your mouse over a variable while you are in Break mode, the first thing you will see in the tooltip is the type of object you are hovering over. In Figure 43-1, a mouse was initially hovering over the Customer class, followed by the Order class. This information is not particularly useful, because most of the time you have a fairly good idea about the type of object you are dealing with. It would be better for this single line to contain more useful information about the object. This is the case for well-known types such as strings and integers where the actual value is displayed.
The DebuggerDisplay attribute can be used to change the single line representation of the object from the default full class name. This attribute takes a single parameter, which is a String. The format of this String can accept member injections using the String.Format breakout syntax. For example, the attributes applied to the Customer and Order classes might be as follows:
[DebuggerDisplay("Customer {CustomerName} has {Orders.Count} orders")]
public class Customer

[DebuggerDisplay("Order made on {DateOrdered} which is worth ${Total}")]
public class Order
This would give you the debugger output shown in Figure 43-2, which indicates that customer John Smith has one order, which, as you can see from the description, was made on March 6 and is worth $50.
Figure 43.2. Figure 43-2
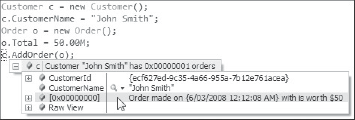
Looking back at the syntax for the DebuggerDisplay attribute, you can see that the output string consists of both static text and field and property information from the object. For example, the CustomerName property for the Customer object is referenced using the {CustomerName} syntax within the static text.
43.1.3. DebuggerHidden
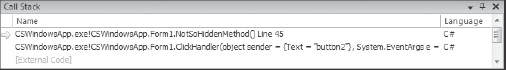
The DebuggerHidden attribute can be added to code that you don't want to step through when debugging. Code marked with this attribute is stepped over and does not support breakpoints. If this code makes a call to another method, the debugger steps into that method. Taking the following code snippet, a breakpoint can be set in both ClickHandler and NotSoHiddenMethod:
private void ClickHandler(object sender, EventArgs e)
{
    HiddenMethod();
}

[DebuggerHidden()]
public void HiddenMethod()
{
    Console.WriteLine("Can't set a breakpoint here");
    NotSoHiddenMethod();
}

public void NotSoHiddenMethod()
{
    Console.WriteLine("Can set a breakpoint here!");
}
If you step through this code, the debugger goes from the call to HiddenMethod in the ClickHandler method straight to the NotSoHiddenMethod. The call stack at this point is shown in Figure 43-3, and you can see that HiddenMethod does not appear in the stack.
Figure 43.3. Figure 43-3
43.1.4. DebuggerStepThrough
Like the DebuggerHidden attribute, when the DebuggerStepThrough attribute is applied to a piece of code, that code is stepped over when debugging regardless of whether this code calls other methods.
Similar to the DebuggerHidden attribute, breakpoints cannot be set within a block of code marked with the DebuggerStepThrough attribute. However, if a breakpoint is set within a section of code that is called by that code, the attributed code will be marked as external code in the call stack. This is illustrated in Figure 43-4, which shows the code that was listed in the previous section. However in this case DebuggerStepThrough has been set on HiddenMethod instead of DebuggerHidden.
Figure 43.4. Figure 43-4

DebuggerStepThrough is very useful when working with code that calls a lot of properties; for example, if you are calling a method that passes in a large number of properties as parameters. If you add the DebuggerStepThrough attribute to all the properties, you won't step into all of the properties when debugging the method call.
Visual Studio 2008 supports the Just My Code option, configurable from the Debugging node in the Options dialog (select Tools ![]() Options). Unchecking this option makes all code contained within your application appear in the call stack, as shown in Figure 43-5. This includes designer and other generated code that you might not want to debug. Once this option is unchecked, breakpoints can also be set in blocks of code marked with this attribute.
Options). Unchecking this option makes all code contained within your application appear in the call stack, as shown in Figure 43-5. This includes designer and other generated code that you might not want to debug. Once this option is unchecked, breakpoints can also be set in blocks of code marked with this attribute.
Figure 43.5. Figure 43-5

43.1.5. DebuggerNonUserCode
The DebuggerNonUserCode attribute combines the DebuggerHidden and DebuggerStepThrough attributes. When the Just My Code option is selected, breakpoints cannot be set in blocks of code marked with this attribute, and the code will appear as external code in the call stack. However, stepping through code will step into any code called by that block of code in the same way it does for the DebuggerHidden attribute.
43.1.6. DebuggerStepperBoundary
DebuggerStepperBoundary is the least useful of all of the Debugger attributes, because it only comes into effect under specific conditions. It was added to avoid a misleading debugging experience that can occur when a context switch is made on a thread within the boundaries of the DebuggerNonUserCode attribute. It is entirely possible in this scenario that the next user-supplied code module stepped into may not actually relate to the code that was in the process of being debugged. To avoid this undesirable situation, the DebuggerStepperBoundary, when encountered under this scenario, will escape from stepping through code to running code.