
44.1. Debugging Server-Side ASP.NET Code
Before you can perform any level of debugging in a web application, you first need to ensure that ASP.NET debugging is enabled in your Web Application or Web Site Project. For Web Application Projects, enable debugging options by right-clicking the project entry in the Solution Explorer and selecting Properties. Select the Web tab option page and ensure that the ASP.NET debugger option is checked, as illustrated in Figure 44-1.
Figure 44.1. Figure 44-1

If you want to be able to include unmanaged code, stored procedures, or Silverlight in your debugging of the web applications, you can activate the Native Code, SQL Server, and Silverlight debuggers here. Native code and SQL Server debugging are explained in the next chapter and Silverlight debugging is discussed later in this chapter.
Enabling debugging in other Web Application Projects, such as ASP.NET Web Service or ASP.NET MVC applications, is exactly the same as for standard ASP.NET web applications. In fact, from a debugging perspective, there are really no differences between any of these project types.
Because Web Site Projects do not have a project file, you must use a slightly different procedure to enable debugging. Enable debugging in Web Site Projects by right-clicking the project entry in the Solution Explorer and selecting Property Pages from the context menu. When the Property Pages dialog is displayed, navigate to the Start Options page, and ensure that the ASP.NET debugger option is checked, as shown in Figure 44-2.
Figure 44.2. Figure 44-2
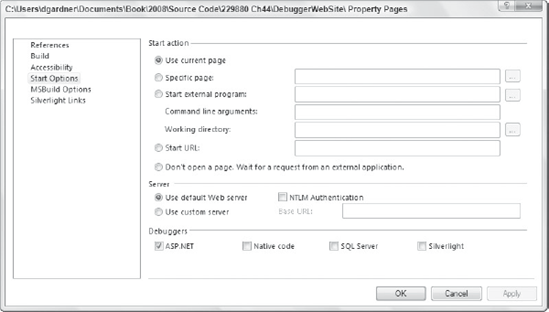
As with Web Application Projects, you can also customize how a Web Site Project is to be started, including not opening any specific page, but running the server so it listens for a request from another application.
An alternative method of implementing web debugging for any Web Site or Web Application Project is to use the web.config file. Locate the compilation node within system.web and set the debug attribute to true. The following listing shows a minimal web.config file with the debug option enabled, ready for hooking the debugger to the application:
<configuration>
    <appSettings/>
    <connectionStrings/>
    <system.web>
        <compilation debug="true" strict="false" explicit="true" />
    </system.web>
</configuration>
Note that even when you activate the ASP.NET debugger in the Start Options, without setting the debug attribute to true you will be unable to debug the application. However, Visual Studio will detect this discrepancy and present you with a dialog informing you that in order to debug you will need to change web.config. It also provides an option for Visual Studio to automatically change this attribute for you.
You should never deploy an ASP.NET application into production with the debug="true" option set within the web.config file. Doing so will cause your application to run slower, use more memory, and prevent some things from being cached.
44.1.1. Web Application Exceptions
By default, when your web application encounters an exception, the web application will display the ASP.NET server error page, as shown in Figure 44-3. Colloquially called the Yellow Screen of Death, this page displays the exception details including the stack trace.
Figure 44.3. Figure 44-3
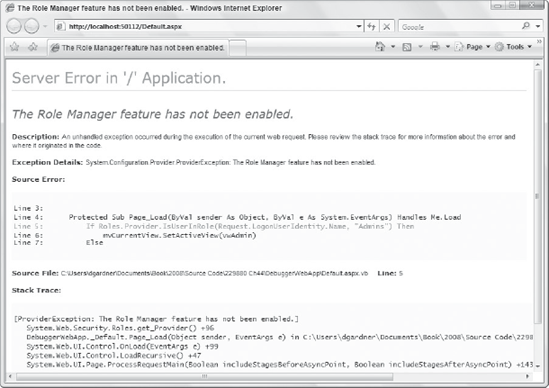
The server error page is generated under both debug and normal execution. Whereas it is useful to have this information during development, it is not something that you should be displaying to your end users. Fortunately, there is an easy way to configure redirections for exceptions, including standard HTTP errors, by editing the customErrors section in the web.config file.
Modifying the previous web.config file to include these redirection options for 403 (access denied) and 404 (page not found) can result in a configuration similar to the following:
<configuration>
    <appSettings/>
    <connectionStrings/>
    <system.web>
        <compilation debug="true" strict="false" explicit="true" />
        <customErrors mode="RemoteOnly" defaultRedirect="GenericErrorPage.htm">
            <error statusCode="403" redirect="AccessDenied.html" />
            <error statusCode="404" redirect="PageNotFound.html" />
        </customErrors>
    </system.web>
</configuration>
The mode attribute of the customErrors section defines three options for displaying a custom error page instead of the default server error page. These are:
On: The custom error page will always be displayed.
Off: The server error page will always be displayed.
RemoteOnly: The server error page will be displayed if the browser request is coming from the local computer; otherwise the custom error page will be displayed.
The server error page is useful in production scenarios where you cannot run the application in debug mode. However, when debugging, it is much more useful to break execution as soon as an exception occurs. This can be done by enabling the "Break when an exception is" thrown option for the Common Language Runtime. Figure 44-4 shows how this option is set in the Exceptions dialog under the Debug ![]() Exceptions menu item.
Exceptions menu item.
Figure 44.4. Figure 44-4

Once you have enabled this option, when an exception occurs, Visual Studio will drop back into the IDE and position the workspace so the statement at issue is visible. Just like Windows-based applications, Visual Studio can aid you when errors occur by displaying the Exception Assistant. As shown in Figure 44-5, web errors are fully detailed and include information about which part of the statement is in error.
Figure 44.5. Figure 44-5

You can gather additional information on the error by clicking the View Detail link, which provides you with a comprehensive exception object visualizer that you can navigate to determine the content of the error at hand.
44.1.2. Edit and Continue
Edit and Continue, which enables you to modify code when the application is paused in a debug session, is disabled by default in ASP.NET web applications. This useful feature can be enabled by right-clicking the project entry in the Solution Explorer and selecting Properties. Under the Web tab option page check the Enable Edit and Continue option. This is only supported for the built-in Visual Studio development web server.
Web Site Projects do not support Edit and Continue, however; because they naturally support a very iterative style of development, it is not such a useful feature for those projects. Edit and Continue is explained in more detail in Chapter 42.
44.1.3. Error Handling
Though debugging your applications is indeed easy with the tools Visual Studio 2008 provides, it is always best to try to avoid error situations proactively. You can do this in web applications with structured Try-Catch exception handling, but you will also want to make your solutions more solid by including code to handle any errors that fall outside any Catch conditions.
Notice we are using the term error handling and not exception handling here. This is because it is broader than trapping program exceptions and also covers HTML errors, such as Page Not Found and Authentication Required.
You can catch errors on two levels: On an individual page you can intercept unexpected errors and produce a custom-built error, or you can catch errors on an application-wide level through the implementation of a routine to handle errors in the global.asax file.
44.1.3.1. Page-Level Errors
To handle an error on an individual page, you need to implement an event-handler routine that intercepts the MyBase.Error event. When this event is raised, you can then perform whatever actions you need to take place when unexpected errors occur. A typical routine might look like this:
Private Sub Page_Error(ByVal sender As Object, ByVal e As System.EventArgs) _
    Handles MyBase.Error
    Response.Write("An unexpected error has occurred.")
    Server.ClearError()
End Sub
As discussed previously, you can also set custom redirections for standard HTTP error codes in the web.config file, so you should use this method only for errors that are not already handled and are specific to the individual page.
44.1.3.2. Application-Level Errors
At the web-application level, you can also trap a series of errors through the global.asax file. By default, Visual Studio 2008 web projects do not include this file, so you'll first need to add it to the project through the Add New Item dialog. Select the Global Application Class item, leave the name as global.asax, and click Add to add the file to your project.
When this class is added to the project, the template includes stubs for the commonly encountered application events, including the error event. To handle any errors that are not catered to elsewhere in the project, add your processing code to this Application_Error routine, like so:
Sub Application_Error(ByVal sender As Object, ByVal e As EventArgs)
    Server.Transfer("UnexpectedError.aspx")
End Sub
This sample routine simply transfers the user to an errors page that determines what to do by interrogating the Server.GetLastError property.