
44.2. Debugging Client-Side JavaScript
One of the most anticipated new features of Visual Studio 2008 is the improved support for debugging client-side JavaScript code. Combined with the new IntelliSense support, this will significantly ease the difficulty of developing JavaScript code.
JavaScript debugging works only if you are using Internet Explorer as your web browser during the debug session.
44.2.1. Setting Breakpoints in JavaScript Code
Setting breakpoints for JavaScript code is no different from setting any other breakpoint. Within the editor window any breakpoints in JavaScript code are displayed with a diamond in the center, as shown in Figure 44-6.
Figure 44.6. Figure 44-6

JavaScript breakpoints have the same functionality as standard breakpoints. This includes setting conditions, hit counts, or even running a macro as part of a tracepoint.
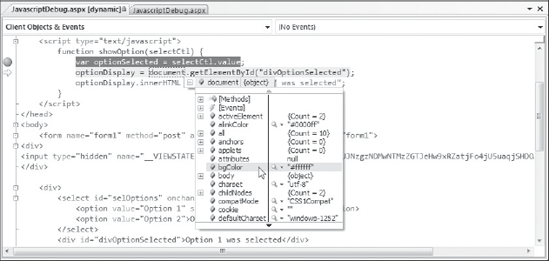
When the debugger hits a breakpoint it will pause execution and display the HTML code that has been rendered on the client, as shown in Figure 44-7. This provides a true debugging experience because it includes all client-side elements such as the ViewState and server controls rendered in HTML.
Visual Studio 2008 has also improved the watch visualizers for client-side elements. Figure 44-7 demonstrates this with a tooltip that shows the properties and methods of the document object.
Figure 44.7. Figure 44-7
It is also possible to set both client-side JavaScript breakpoints and Visual Basic or C# server-side breakpoints at the same time on the same page. This will allow you to step through both the client-side and the server-side code in a single debug session.
44.2.2. Debugging Dynamically Generated JavaScript
There are several scenarios where ASP.NET sends down to the client JavaScript that has been dynamically generated on the server. For example, ASP.NET AJAX controls such as the Update Panel will send down to the client references to JavaScript files that are actually stored as resources in the ScriptManager control.
When you are running a web application in debug mode, the Visual Studio Solution Explorer will show a list of all the script references that the page you are debugging has loaded, as shown in Figure 44-8. Double-clicking any of the links under the Script Documents node will display the JavaScript code and allow you to set breakpoints within those scripts.
Figure 44.8. Figure 44-8

44.2.3. Debugging ASP.NET AJAX JavaScript
ASP.NET AJAX provides both Debug and Release versions of its client JavaScript libraries. The release version is optimized for performance and minimizes the size of the JavaScript that must be downloaded to the client. The Debug version is more verbose and provides additional debugging features at runtime, such as type and argument checking.
If debugging is enabled in the web.config file, ASP.NET AJAX will use a debug version of the client libraries. You can also enable the debug version on a per-page basis by setting ScriptMode="Debug" on the ScriptManager control.
ASP.NET AJAX also includes the Sys.Debug class, which can be used to add debug statements to your client JavaScript. This class can be used to display the properties of objects at runtime, generate trace messages, or use assertions.