
56.2. Load Tests
While web and load testing are meant to test functional requirements, Load Tests will run a set of tests repeatedly so you can see how your application will perform. To create a Load Test, right-click your test project and select Load Test from the Add sub-menu. This will present you with a wizard that will guide you through the necessary steps. First, you'll need to create a scenario; here you will define if you want to use think times. When you recorded the Web Tests, the time you took between each request was also recorded and can be used as the think time. It can be edited for each Web Test request in the properties window.
As part of the scenario you will define the load pattern; for example, a constant load of 100 users or a load incrementing by 10 every 10 seconds until you get to 200 users. The next steps, Test, Browser, and Network Mix, define how tests will be run by virtual users according to Test Mix, specifying which browsers are used and simulating which kind of networks. In the Test Mix step you can add Generic, Ordered, and Web Tests.
Finally, in the Counter Sets step, you add the computers that you want to monitor and the performance counters you are interested in. For example, you can monitor your Database Server and IIS. In the last step, Run Settings, you can specify the test duration or test iterations, how often samples will be taken for performance counters, a test description, how many identical errors will be recorded, and the validation level. We defined a validation level for each Validation Rule in our Web Tests. Since evaluation of these rules can be expensive, in Load Tests only rules with a level equal to or below the specified validation level will be evaluated.
When you hit Finish you will be presented with the Load Test Designer as shown in Figure 56-4. There you can add additional scenarios, counter sets, or new run settings.
When you run the tests you will see the Load Test Monitor; by default it will show the Graphs view. In the left-side pane you have a treeview of the Counter. You can select items there to add them to the graphics. From the toolbar you can change to Summary or Tables view, export to Excel or CSV, and add analysis notes. In the Graphs view at the bottom you will have a legends pane as shown in Figure 56-5. There you can select/deselect the counters that you want to include in the graphs. While the test is running, the monitor will be updated on each sample interval. In the Tables view you can see the Requests, Errors, Pages, SQL Trace, Tests, Thresholds, and Transactions.
Figure 56.4. Figure 56-4

Figure 56.5. Figure 56-5
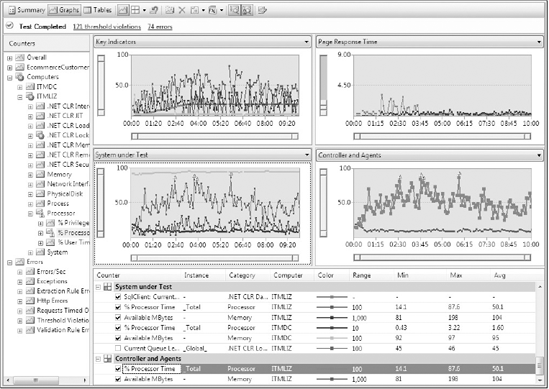
Thresholds are particularly important. These are values for each performance counter that will allow you to spot problems. In the graphs you can see points where violations occurred marked with a warning or error icon.
56.2.1. Test Load Agent
For large-scale applications, one computer might not be enough to simulate the desired load. Visual Studio Team System 2008 Test Load Agent can distribute the work across different machines. It can simulate approximately 1,000 users per processor. This product requires a separate installation and requires one controller and at least one agent. To configure the environment select Administer Test Controller from the Test menu. There you can select a Controller and add Agents. Then from the Test Run Configuration window in the Controller and Agent node you can select to run the tests remotely and select the configured controller.