
To assist in debugging, Visual Studio offers a variety of debug windows, described in the following sections.
Manage breakpoints in the Breakpoints window. In this window, you can insert, delete, and disable breakpoints. (The Breakpoints window was shown and discussed in detail earlier in this chapter.)
The Output window (shown in Figure 15-29) contains messages from various sources from Visual Studio. The Output window is available on the View menu.
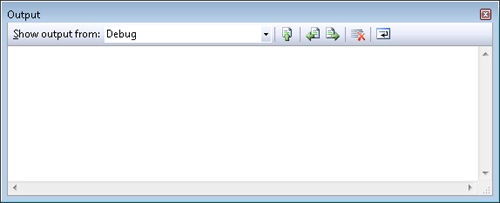
The Output window has a toolbar with a drop-down list and several buttons. The Show Output From drop-down list filters the sources of messages such as Build and Debug messages. The first three buttons locate build errors in the code editor: Find Message In Code, Go To Previous Message, and Go To Next Message. The next button, Clear All, erases the content of the Output window. The Toggle Word Wrap button toggles word wrap in the Output window.
You can watch variables and expressions in a variables window. The Watch, Locals, Auto, and QuickWatch windows are considered variables windows—they have the same general user interface and functionality. The variables windows are disabled in running mode; you must be in break mode to use them. A Watch window, like other variables windows, has three columns. The Name column displays the variable name or expression to evaluate. The Value column displays the variable value or result of the expression. The Type column is the data type of the variable or expression. There are four Watch windows for grouping related values.
Variable values can be modified directly in a variables window. Changed values are highlighted in red. This is an excellent way to test applications with values that stress the program. You also can use this technique to test how the application handles error conditions.
You can add variables and expressions in a variables window directly. The QuickWatch dialog box is a convenient means of inspecting a variable or expression and optionally adding that item to a permanent variables window. The QuickWatch dialog box has an Add Watch button. If desired, you can enter new expressions in the Expression text box. The QuickWatch window is available on the Debug menu. Shortcuts for QuickWatch are either pressing Shift+F9 or Ctrl+D followed by Ctrl+Q . Before opening the QuickWatch window, select the target variable or expression in the source editor. For convenience, you also can select a variable or expression in the source editor and drag it into an open Watch window.
Debugger expressions are expressions entered in the Watch, QuickWatch, Breakpoints, or Immediate window. These expressions are evaluated by the Managed Expression Evaluator of the Visual Studio debugger. Use debugger expressions to calculate values or to call methods. IntelliSense is available when entering debugger expressions in a debug window or visualizer.
Debugger expressions are evaluated similarly to regular expressions. However, there are some unique idiosyncrasies of the Managed Expression Evaluator:
It ignores access modifiers.
All members of the current object, regardless of accessibility, are available.
Checked blocks are ignored and evaluated as unchecked.
Anonymous methods are not supported in debugger expressions.
Expressions can contain constants, function calls, and identifiers within scope, such as locals, parameters, and fields. Most operators, such as +, -, ==, !=, ++, --, and /, are available. You can even use the typeof and sizeof operators. The this reference is supported. In addition, simple casts are allowed.
Expressions are evaluated between every step command. Beware of side effects, which can alter the state or execution of the program unexpectedly. For example, calling in a Watch expression a function that changes the state of the current object might change the outcome of the application and cause adverse side effects.
The following procedure demonstrates using variables windows. Set a breakpoint in the Form_Load function in the Expressions application. Run the application until the breakpoint is hit.
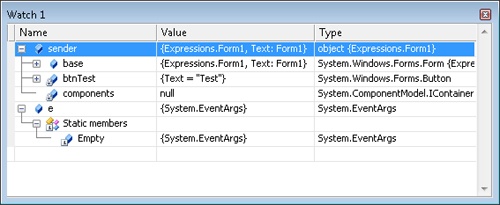
Open a Watch window from the Debug menu. The Form_Load method has a sender parameter and an e parameter. Drag the sender and the e parameter to the Watch window. Now you can view their values in the Watch window. The Watch window, containing the two parameters, is shown in Figure 15-30. Continue the application and click the Test button on the form that appears.
The Expressions sample application has a ZClass type, which is relatively simple. Open the related source file:
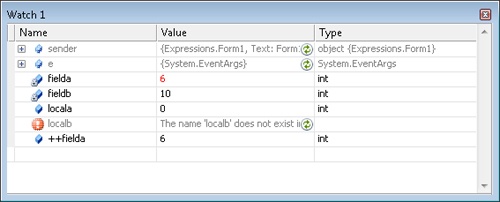
class ZClass
{
    private int fielda = 5;
    private int fieldb = 10;

    public int MethodA()
    {
        int locala = 5;
        locala = 12;
        return fielda + fieldb;
    }
}
You should set a breakpoint on the declaration of locala in MethodA. When the breakpoint is hit, add fielda, fieldb, locala, and localb to the Watch window manually by typing the variables names into the Watch window. The localb variable is not declared in the function. For that reason, it is displayed with an exclamation symbol. In the Watch window, add the ++fielda expression, which has the side effect of changing the value of fielda. Because the fielda watch expression references the same value, the value displayed for that expression also changes. Figure 15-31 shows the new Watch window.
Step through two individual statements by pressing F10 twice. Click the Refresh button (the green swirling button to the right of the field) to update the value controlled by the ++fielda expression.
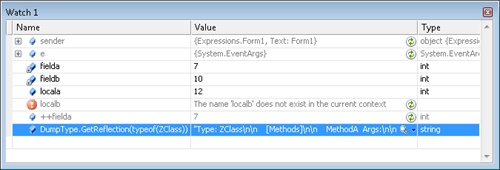
The application also has a DumpType class. It has a static method, which dumps the methods and parameters of a type. The DumpType.GetReflection method returns a string that lists the methods of a type. This function is not called explicitly in the program. It exists purely for debugging purposes. Call the DumpType.GetReflection function from the Watch window as an expression, as shown in Figure 15-32. Pass the type of the current object (typeof(ZClass)) as the sole parameter.
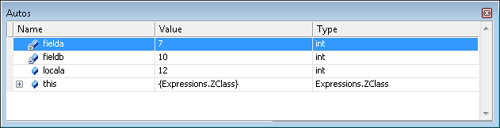
The Autos window lists variables and data members used in the current and preceding lines of code. The items of the Autos window are displayed automatically by the Visual Studio debugger, not the developer. You can change the values in the window, which are then highlighted in red. Figure 15-33 shows the Autos window.
The Locals window lists the local variables that are currently in scope. Otherwise, the window is similar to the Autos window.
The Immediate window is the command-line version of the Visual Studio debugger. You can display values in the Immediate window, evaluate expressions, perform menu commands, execute statements, and perform other actions. Command and Immediate windows are in either Command or Immediate mode. The Command window is in Command mode, while the Immediate window is in Immediate mode. Command mode is preferred for executing one or more Visual Studio commands. These are menu commands and other kinds of commands. For evaluating expressions, inspecting values, and otherwise debugging an application, Immediate mode is preferred. The default is Command mode. When in Immediate mode, switch to Command mode temporarily by prefixing commands with a greater than (>) symbol.
From the Immediate window, entering the >cmd command switches to Command mode and the Command window. Switch back to Immediate mode and the Immediate window with the immed command.
You can navigate through commands already entered in the Immediate window with the arrow keys. Table 15-7 shows the various ways to navigate the window.
Table 15-7. Navigating in the Immediate or Command window
Keystroke | Description |
|---|---|
Up arrow on the command line | Previous command |
Down arrow on the command line | Next command |
Ctrl+Up arrow or Up arrow in the Command window | Move up in the window |
Ctrl+Down arrow or Down arrow in the Command window | Move down in the window |
Esc | Transfer focus to a blank line if not on a blank line, or to the code editor if already on a blank line |
There are limitations to the tasks that can be performed in the Immediate window. For example, you cannot declare new variables, define a label, or create an instance of an object. Special commands such as the k command (see Table 15-8) are not available in managed-only code. In addition, the Immediate window does not allow goto, return, and loop statements, or any statement requiring transfer of control.
Table 15-8. Command aliases
Alias | Command |
|---|---|
? | Debug.Print |
bl | Debug.Breakpoints |
callstack | Debug.CallStack |
cls | Debug.ClearAll |
cmd | View.CommandWindow |
du | Dump Unicode |
g | Debug.Start |
immed | Tools.ImmediateMode |
k | Debug.ListCallStack |
locals | Debug.Locals |
memory1 | Debug.Memory1 |
memory2 | Debug.Memory2 |
p | Debug.StepOver |
pr | Debug.StepOut |
File.Print | |
q | Debug.StopDebugging |
rtc | Debug.RunToCursor |
saveall | File.SaveAll |
t | Step.Into |
threads | Debug.Threads |
~ | Debug.ListThreads |
~*k | Debug.ListCallStack /AllThreads |
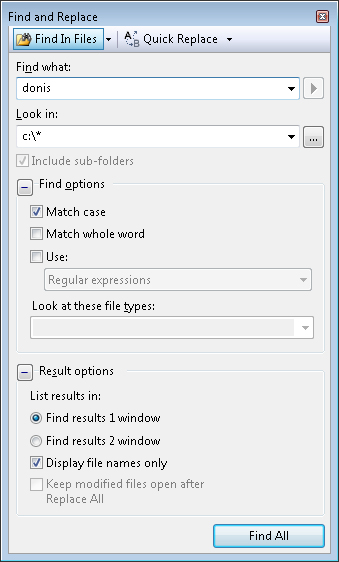
Some commands can have arguments or options. For example, the Edit.FindinFiles command has both. IntelliSense will present the options, which are preceded with a forward slash (/). You must type the forward slash to prompt IntelliSense to display the available options. The following statement is an example of the Edit.FindinFiles command:
>Edit.FindinFiles /case /lookin:"c:*" donis
If a command displays a window, consult that window to understand the options and arguments. (Of course, you also could check the documentation.) Edit text boxes in the window become arguments for the command, and everything else is represented by an option in the command. Figure 15-34 shows the Find In Files dialog box, which has one text box and several options. The settings shown in the figure correspond to the arguments and options in the preceding example. The text box is the single argument of the Edit.FindinFiles command. Several options are available. Arguments are required, while options (not surprisingly) are optional. In the preceding example, the Edit.FindinFiles command is used with two options: The first option requests a case-sensitive search, and the second option directs the command to search all files in the root directory. The command has a single argument, which is the search text.
Aliases are short forms of debugging commands. They are convenient, but they are never required. Table 15-8 lists some useful aliases.
You might want to create user-defined aliases for frequently performed tasks. The Alias command defines a new alias. The following command defines two new aliases. The pripro alias replaces all instances of the private keyword with the protected keyword in the current source file. The propri alias performs the reverse operation. These aliases then can be used in the command window.
>alias pripro edit.replace /all private protected
>alias propri edit.replace /all protected private
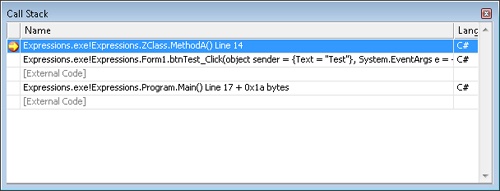
The Call Stack window shows functions that are presently on the stack. The current function is highlighted with a yellow arrow. By default, the window has two columns: the name of the function and the source language. The Name column combines several items: module name, function name, parameter information, line number, and byte offset. Parameter information includes parameter type, parameter name, and parameter value. Right-click to customize the display. Except for the function name, every column is optional. Figure 15-35 shows the Call Stack window, which is available only in break mode.
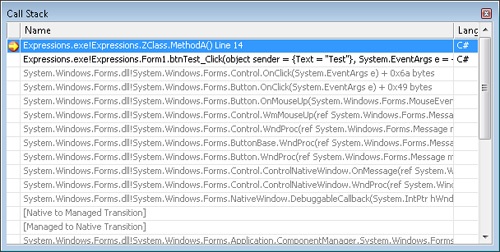
The call stack does not include external code. In some circumstances, information from external functions can be helpful. To view external code, disable the Enable Just My Code (Managed Only) option in the General settings in the Debugging category of the Options window (which you access by choosing Options from the Tools menu). Figure 15-36 shows the Call Stack window with this option disabled. The call stack now includes System functions, which can be helpful.
Each row of the call stack represents the stack frame of a function. A stack frame has information related to the function, such as local variables and parameters. The current function is highlighted with a yellow arrow. By default, this also marks the current stack frame. You can switch stack frames. Right-click a row and choose the Switch To Frame menu command from the Context menu. A curved green arrow will appear and mark the current stack frame, which may be different from the current function. Some variables windows are based on the current stack frame. For example, the Autos and Locals windows present information based on the current stack frame. If you change the current stack frame, the content in these windows also changes.
Another option from the Call Stack context menu is the Include Calls To/From Other Threads command. This command shows calls from other threads in the Call Stack. For example, this is helpful when tracing the call stack from an XML Web Service into an ASP.NET application.
Function breakpoints and trace points can be set in the Call Stack window. You can use shortcut keys, such as F9, to do this, or you can right-click a row and use the Context menu.
The Threads window lists the active threads of the current process. This window is available only in break mode. A thread is a single path of execution in a process. Threads also own assets, such as local variables, thread context, and thread local storage. Threads can be assigned a priority. Naming threads is particularly useful when debugging an application that is experiencing synchronization problems.
The Thread application creates threads. In the sample application, each new thread executes the MethodA function. Run the Thread application, select the BreakAll command from the Debug menu, and then open the Threads window, which is shown in Figure 15-37, by choosing Threads from the Windows submenu of the Debug menu.
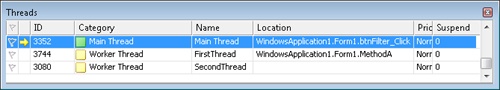
The columns of the Threads window are thread identifier, category, thread name, method location, thread priority, and suspend count. Right-click a thread and choose Freeze from the context menu to suspend the thread. Suspended threads are shown with a pause (double-bar) icon. Right-click the thread and choose Thaw to resume a suspended thread. Forcibly suspending a thread can affect the normal operation of an application.
The Switch To Thread command of the context menu changes the current thread. The new thread will immediately receive CPU time. You also can double-click the target thread to switch the current thread. The content presented in some windows, such as the Call Stack window, is based on the current thread. The information in these windows will update as the current thread is changed.
The Modules window lists the modules, executables, and DLLs that are loaded into the application. There is considerable information presented on each module, as described in Table 15-9.
Table 15-9. Modules window columns
Column | Description |
|---|---|
Name | Gives the name of the module. |
Path | Presents the fully qualified path to the module. |
Optimized | Indicates whether the module is optimized during JIT compilation. Debug versions of modules usually are not optimized. |
User Code | Indicates whether user code is available for the module. |
Symbol Status | Indicates whether symbols are loaded for the module. |
Symbol File | When loaded, displays the fully qualified path and name of the symbol file. |
Order | Lists the load order of modules. |
Version | Provides the version number of the module. |
Timestamp | Displays the timestamp of when the module was created. |
Address | Displays the start and end load address of the module. |
Process | Displays the process identifier of the application that hosts the module. |
The Processes window enumerates processes being debugged in the current debugging session. Table 15-10 describes each column of the window.
Table 15-10. Processes window columns
Column | Description |
|---|---|
Name | The name of the process. |
ID | The process identifier of the process. |
Path | The path to the executable. |
Title | The title of the application. For a Windows Forms application, this is the content of the title bar. |
State | The state of the application, such as the break or running state. |
Debugging | The type of debugging, such as managed or native debugging. |
Transport | The transport to the application. An entry of Default indicates the Native With No Authentication transport. |
Transport Qualifier | The machine name where the application resides. |
The Memory window (shown in Figure 15-38) displays the memory of the current process. Unlike other windows, the Memory window provides an unfiltered and raw presentation of process memory. The different Memory windows provide four distinct views into the memory of the application. Memory windows are available in break mode and only if the Enable Address-Level Debugging Option is enabled. Find this option in the General settings in the Debugging category of the Options window (which you access by choosing Options from the Tools menu).
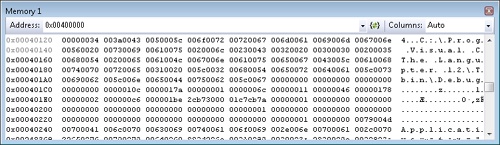
To view specific memory, enter a memory address in the Address edit box. You can enter a memory address directly or you can drag symbols, such as local variables, into the Address edit box. The Memory window will display rows of data beginning at the specified memory address. Multiple columns of data are shown. The first column shows the memory address. The final column is the text translation. The memory dump is in the intervening columns.
The Memory window can be formatted by right-clicking it. You can change the size of the data columns to 1-, 2-, 4-, or 8-byte columns. The display can also be changed to 32- or 64-bit data presentation. The text translation in the final column can be formatted as ANSI or Unicode, or it can be hidden.
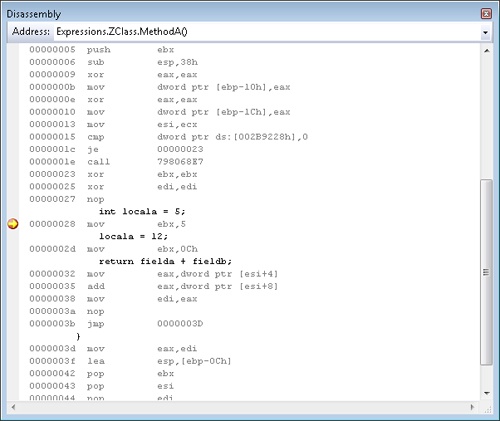
The Disassembly window (shown in Figure 15-39) shows the native assembly of the application as generated by the JIT compiler. By default, if available, the source code also is displayed. Each assembly instruction is displayed with several columns: the instruction address, mnemonic, and parameters. Right-click the Disassembly window to change its format.
The Registers window (shown in Figure 15-40) displays the state of the registers. Assembly-level programming typically relies heavily on registers. For this reason, the Disassembly and Registers windows often are used together. Right-click the window to change the format of the display. The Registers window displays the contents of registers in the context of the current thread.
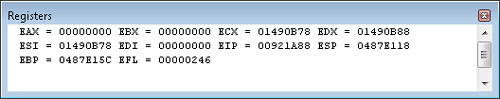
Table 15-11 describes the common registers.
Table 15-11. Registers
Register | Description |
|---|---|
EAX | This register is general-purpose. It is used commonly as the destination of a math operation. |
EBX | This register is general-purpose. |
ECX | This register is general-purpose and is used commonly for counting. |
EDX | This register is general-purpose. |
EIP | This register contains the address of the next instruction. |
ESP | This register contains the pointer to the top of the stack. |
ESI | This register is the source index. The ESI and EDI registers are used frequently in string operations. |
EDI | This register is the destination index. The ESI and EDI registers are used frequently in string operations. |
EBP | This register contains the base pointer to the current stack frame. |