
- Programming Microsoft Visual C# 2008: The Language
- SPECIAL OFFER: Upgrade this ebook with O’Reilly
- Praise for Programming Microsoft Visual C# 2005: The Language (Microsoft Press)
- Acknowledgments
- 1. Introduction
- I. Core Language
- 1. Introduction to Microsoft Visual C# Programming
- A Demonstration of Visual C# 2008
- Common Elements in Visual C# 2008
- C# Core Language Features
- Types
- 2. Types
- 3. Inheritance
- 1. Introduction to Microsoft Visual C# Programming
- II. Core Skills
- 4. Introduction to Visual Studio 2008
- 5. Arrays and Collections
- 6. Introduction to LINQ
- 7. Generics
- 8. Enumerators
- III. More C# Language
- 9. Operator Overloading
- 10. Delegates and Events
- 11. LINQ Programming
- 12. Exception Handling
- IV. Debugging
- 13. Metadata and Reflection
- 14. MSIL Programming
- "Hello World" Application
- Evaluation Stack
- MSIL in Depth
- Complex Tasks
- Branching
- Arrays
- Arithmetic Instructions
- Conversion Operations
- Exception Handling
- Miscellaneous Operations
- Process Execution
- Debugging with Visual Studio 2008
- 15. Debugging with Visual Studio 2008
- 16. Advanced Debugging
- V. Advanced Features
- A. About the Author
- B. Additional Resources for Developers from Microsoft Press
- C. More Great Developer Resources
- Index
- SPECIAL OFFER: Upgrade this ebook with O’Reilly
Visual Studio can open dump files created from managed, native, or mixed-mode applications. A dump is a snapshot of an application’s memory that lets a developer debug an application postmortem. Dumps are particularly beneficial for debugging production applications. You can create a dump on a production machine and debug elsewhere without interfering with the production application. Several tools are available for creating a dump, including Windbg, Dr. Watson, Autodump+ (ADPlus), and Visual Studio. Visual Studio creates dumps for native applications, such as Microsoft Visual C++ applications, but not for managed applications. Dump files and other advanced debugging topics are discussed in Chapter 16.
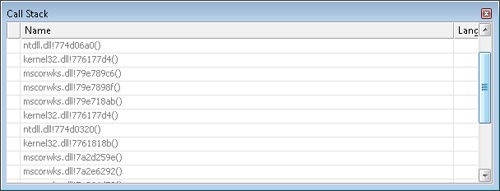
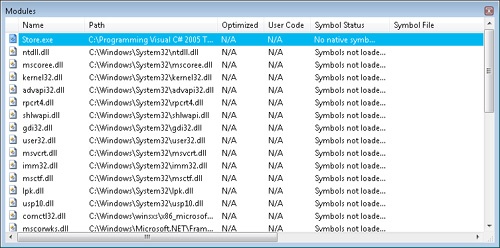
In Visual Studio, dump files are opened as projects. Choose Solution/Project from the Open submenu of the File menu. Dump files usually have the .dmp extension. After opening the file, start a debugging session to examine the dump file. Remember that the Debug Start command on the Debug menu (which also can be invoked by pressing the F5 key) starts a debug session. You then can debug and diagnose the dump using the various debug windows. Figure 15-45 and Figure 15-46 show the Call Stack and Modules debug windows, which provide different views of the dump.
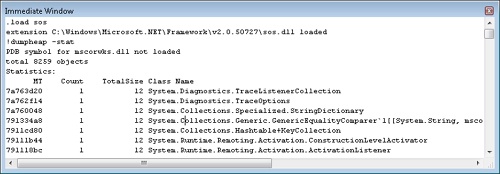
Load the Son of Strike debugger extension (SOS.DLL) for a managed perspective of a dump. Load Son of Strike with the .load sos command in the Immediate window. You can then issue various Son of Strike commands, which are prefixed with an exclamation point (!). In Figure 15-47, Son of Strike is loaded. The DumpHeap command is invoked and the output is shown in the Immediate window.
-
No Comment