
The Microsoft Visual Studio 2008 Integrated Development Environment (IDE) includes a full-feature debugger that provides an assortment of windows, tools, and behavior to help you identify and resolve bugs quickly. Use the Visual Studio debugger to inspect the values of variables, view the call stack, monitor threads, examine memory, set breakpoints, and much more. One of the primary benefits of the Visual Studio debugger is the familiar user interface. Professionals who are experienced with the Visual Studio environment will be comfortable with the look and feel of the debugger’s user interface and windows.
Visual Studio debugging is extensible. Developers can customize many aspects of the debugger, including extending many of the types related to debugging. For example, developers can create user-defined visualizers and trace listeners. Therefore, Visual Studio debugging is adaptable to specific problems, objectives, and goals.
In a debugging session, you control how an application executes. You can start, interrupt, or stop a debugging session. Table 15-1 details debugging session control
Table 15-1. Control of a debugging session
Control | Description |
|---|---|
Start Execution | From the Debug menu, there are various commands to start a debugging session. If you choose the Start Debugging, Step Into, or Step Over menu command, the application starts within a debugging session. Alternatively, the Start Without Debugging menu command starts an application outside a debugging session—the Visual Studio debugger is not attached. You also can start a debugging session with the Run To Cursor command. In the source editor, right-click the target line of source code or disassembly and select the Run To Cursor command. The application will start in a debugging session and stop at the next breakpoint or at the cursor location, whichever is encountered first. If neither is encountered, the application runs without interruption. |
Break Execution | You can break a debugging session of an application, which is most commonly accomplished by setting breakpoints. Forcibly break into an application using the Break All command from the Debug menu. This command interrupts all applications being debugged in the current Visual Studio debugging session. After breaking into the application, the source code or instruction is highlighted. When no source code is available, you are always transferred to disassembly. When execution is interrupted, the application is in break mode. A debugging session can be interrupted and restarted again. On the Debug menu, the Restart command restarts a debugging session. |
Stop Execution | Select Stop Debugging from the Debug menu to end a debugging session. You also can stop debugging from the Processes window. In that window, right-click the executing process and select the Detach Process command or the Terminate Process command. |
Applications in a debugging session are in either running mode or break mode. In running mode, an application is executing. In break mode, an application is interrupted. Many features, especially debug windows and the Thread and Call Stack windows, are available only in break mode. For this reason, break mode is where most of the work is done to debug an application. While debugging, an application can transition from running to break mode. The following actions can transfer an application from running to break mode:
A breakpoint is hit.
A trace point is hit.
The cursor is hit after starting a debugging session with the Run To Cursor command.
The Break All command is selected.
An unhandled exception is raised.
Stepping through an application.
You can transition from break mode to running mode by starting execution again. The procedures for resuming or starting an application are detailed in Table 15-1.
Debugging techniques vary between project types. For example, the strategy for debugging a Windows Forms application is different from the strategy for debugging a Dynamic Link Library (DLL). This section provides an overview of debugging strategies for basic project types.
Of the various project types, managing a debugging session for a Windows Forms project is probably the easiest. Begin debugging a Windows Forms project by starting a debugging session with a start execution action, such as the Start Debugging menu command. When the execution starts, the Visual Studio debugger will attach to the Windows Forms application.
Set breakpoints before or during the debugging session. When the breakpoint is hit, the debugging session switches to break mode. At that time, use the debug windows and other debugging tools to debug the application. To step between breakpoints, use the Start Debugging menu command.
You can attach the debugger to processes running outside Visual Studio. At that time, the target process is inserted into a debugging session. There are several reasons to attach to a process:
The application you want to debug is already running.
When a problem occurs in an application, you can attach and debug it immediately.
You can debug a production application. If you attach to an application that is not a debug build, a warning is displayed. You then can proceed into a debugging session. However, source code, symbols, and other instruments helpful when debugging might not be available. Care must be taken when debugging a production application. Debugging activities can interfere with the normal execution of a program. For example, breakpoints can interrupt execution of the application and potentially strand users.
Open the Attach To Process window to attach to a process. (From the Debug menu, choose the Attach To Process command.) Figure 15-1 shows the Attach To Process window. The Debug menu is not available when no solution is open in Visual Studio. In that circumstance, choose the Attach To Process command from the Tools menu.
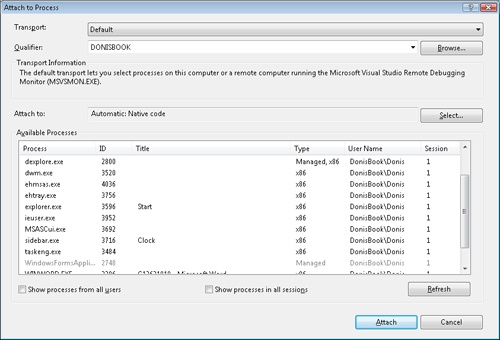
A list of processes is presented in the Attach To Process window. To attach to a specific process, select a process from the Available Processes list and then click Attach. As mentioned, a warning is displayed if the process is not a debug version. You can select and then debug multiple processes by clicking the mouse button while holding down the Ctrl key. All processes currently being debugged by Visual Studio or another debugger are unavailable in the process list. Even if attached to multiple processes, you can actively debug only a single process, which defaults to the last process attached. Open the Debug Location toolbar for the list of processes being debugged in the debugging session. You then can change the current process from the Process drop-down list, which is shown in Figure 15-2. You can select the Debug Location toolbar from the Toolbars submenu on the View menu or by right-clicking any visible toolbar.
The Attach To Process window has several options. The Transport drop-down list specifies the transport used to connect to a target device or remote machine. The Default entry connects to a local or remote machine using the Microsoft Visual Studio Remote Debugging Monitor (msvsmon.exe). The Qualifier drop-down list is the name of the target machine. Click Select to select the target type as managed, native, script, or T-SQL. The default is based on the type of application. Normally, Visual Studio selects the appropriate type by default. The Show Processes For All Users option lists processes from all users of the current logon session. For example, with this option selected, the process list would include system processes not otherwise shown. For Terminal Service clients remotely connected to a machine, Show Processes In All Sessions displays the processes of the remote machine session. The process list is not static. As new processes start up and existing processes finish, the list of running processes changes. Click Refresh to update the list box on demand.
After attaching to an application, you can begin debugging it using various debugging windows and techniques. To set a breakpoint, open the source code of the application and insert a breakpoint. Alternatively, use the Break All command from the Debug menu to interrupt the application where it is executing.
Terminate the debugging session to detach the debugger from the running process. For example, the Stop Debugging command on the Debug menu terminates a debugging session and detaches from a running process. The running process will continue to execute.
Debugging a Console project is similar to debugging a Windows Forms project, with some notable differences:
Console applications typically output to the console, while debug messages are displayed in the Output window. Displaying messages in separate windows has both advantages and disadvantages. The separation of debug messages is the primary advantage and can provide clarity. Conversely, the advantage of a single window for all output is convenience. You need not switch between the Console and Output windows. With the TraceSource class, you have the option of displaying trace (debug) messages in several locations, including the console, the Output window, or both places simultaneously.
Console applications sometimes use command-line arguments. To start debugging a console application with command-line arguments, select the <project> Properties command from the Project menu. Select the Debug tab in the <project> Properties window and enter the command-line arguments in the Start Options frame. Be sure to update the command-line arguments as needed.
In a debugging session, the results of a console application are removed when the application finishes. This can make the results difficult to view. Freeze the window by inserting a Console.ReadLine statement before program exit. Alternatively, after debugging the application, execute in release mode to persist the text shown in the console.
A class library project creates a DLL, which does not execute directly. This makes debugging the DLL more challenging. The DLL must run within the context of another application, which loads the DLL as needed.
You can specify the host application in the debug settings for the project. On the Debug tab of the <project> Properties window, select the Start External Program option within the Start Action frame and enter the name of the hosting application. When a debugging session is started, the specified application allows debugging into the DLL. You can then set breakpoints or otherwise debug the library.
If the host application and class library projects are in the same solution, setting the external program is not necessary. Simply set the host application as the startup project. You then can start a debugging session and debug both the host application and the library.
When the host application is already running, open the project for the library and then attach to the host process in the Attach To Process window. A debug session will start through which the DLL can then be debugged.