Chapter 2. Building Two Simple IoT Monitoring Applications
I must have data!
How much memory remains?
I dare not look. Sigh.
This chapter focuses on the initial steps to getting your IoT solution up and running. You’ll build upon these in the upcoming chapters, so setting the basic design in place now is very important. The overall architecture presented in Chapter 1 provides the initial guidance you’ll need to start coding your IoT solution, and we’ll keep building upon it as we blaze ahead in this chapter and beyond. I’m sure you’re anxious to start building out your own solution based on what you’ll learn, but it’s important to take things one step at a time.
We’ll start with two simple applications that collect some simple telemetry about the devices (real or virtual): a Gateway Device App (GDA) that will run on your “gateway device”, and a Constrained Device App (CDA) that will run on your “constrained device”. The design of each application provides the foundation for all of the code you’ll develop for the edge tier, so you may want to keep the design from Chapter 1 handy for reference.
What you’ll learn in this chapter
This is the beginning of your coding journey with the IoT. You’ll learn how to define a detailed design for both your GDA and CDA, separate the logical components of your design, and implement the framework for these two applications in Java (GDA) and Python (CDA).
These will be very simple applications, but they’ll serve as important foundation layers for your overall solution. Each will implement an application framework and exercise that framework by incorporating external libraries used to track the performance of a computing system. You’ll use the data they generate for your initial foray into creating telemetry using your CDA and GDA.
Designing Your IoT Applications
Remember the problem statement from Chapter 1? Let’s briefly review it now:
I want to understand the environment in my home and how it changes over time, and make adjustments to enhance comfort while saving money.
If you think about all of the things your applications will need to do to address this problem, and also consider the importance of testing system behavior and performance, there are some important capabilities you’ll want to ‘bake in’ from the start. One is the ability to easily add new features as we go, and the other is to track each application’s performance so we know if it’s working adequately.
The first step in designing both the GDA and CDA is to create an application wrapper that can determine what features need to be loaded and then launch those features consistently. I’ll introduce application configuration using a configuration file in Chapter 3, so no need to worry about that right now.
Your initial GDA and CDA designs will look very similar to one another. They’ll collect some basic telemetry, which for now will include just CPU utilization and memory utilization, and simply log the data to the console. It won’t be long before you’ll have both applications talking to one another.
Let’s get started, shall we?
Note
Most of the design diagrams throughout the book will follow Unified Modeling Language (UML) notation. I’ll explain them as we go, but you’ll want to become familiar with the UML’s class diagram and relationship constructs. Check out the links at https://www.uml.org/resource-hub.htm for tutorials and other helpful UML resources.
The CDA
Your CDA needs four components: an application wrapper, a manager to run the show, and two components to read the basic system performance data we want to collect as part of our telemetry: CPU utilization and memory utilization.
Let’s use Figure 2-1 to represent this design:

Figure 2-1. - CDA system performance design diagram
The class diagram in Figure 2-1 shows the four primary components and their relationship to one another: ConstrainedDeviceApp, which you’ll recall from Chapter 1 as being part of the code base you’ve already downloaded, is the application wrapper.
ConstrainedDeviceApp is the entry point for the application and creates the instance of, and manages, SystemPerformanceManager. There are also two other components - SystemCpuUtilTask and SystemMemUtilTask. As their names imply, these are components that will collect - you guessed it - system CPU utilization and system memory utilization. These components will be managed by SystemPerformanceManager and run as asynchronous threads that update a method you’ll define within SystemPerformanceManager.
Note
If you’re already familiar with Python development and comfortable implementing your solution from the UML design above, feel free to skim the next section as a reference and write your code. I’d recommend you do walk through CDA Testing Details, however, as it will provide some insights into the unit test framework that’s part of your codebase.
CDA Implementation Details
Before you start writing code, there’s some administrative steps you’ll need to take to get your CDA code repository and Issues tracker setup. This will let you easily track your work within your project’s Kanban board. Let’s do this administrative work now.
Note
You may find this section to be a bit pedantic. Don’t worry! Once you get through some of the drudgery that comes next, the following code examples will be easier to digest and move more quickly. There are two reasons for this:
-
The setup work will be done after this section; you’ll know how to add tasks, write meaningful descriptions, and map them to your Kanban board.
-
I’ll move along a bit faster and only explain the code that’s somewhat specialized or unique to IoT environments. My expectation is that you’ll ramp up quickly and won’t need a line-by-line description of everything you need to write.
As I mentioned in Chapter 1, the tasks you write are called ‘Issues’. Figure 2-2 is a screenshot from my GitHub page displaying all the CDA tasks that need to be implemented for this chapter.

Figure 2-2. - CDA system performance design tasks
If you’re using GitHub, use your web browser to navigate to your CDA’s Git repository page now. You’ll see there’s an ‘Issues’ tab - click that, which will take you to a page similar to Figure 2-2, but without any Issues.
Let’s change one of the labels first. Click ‘Labels’, and look for ‘Enhancements’. You can leave it as is or rename it to ‘Feature’, which I recommend.
Go back to the Issues page, and now click ‘Milestones’. Let’s add in one milestone for each chapter, as shown in Figure 2-3.
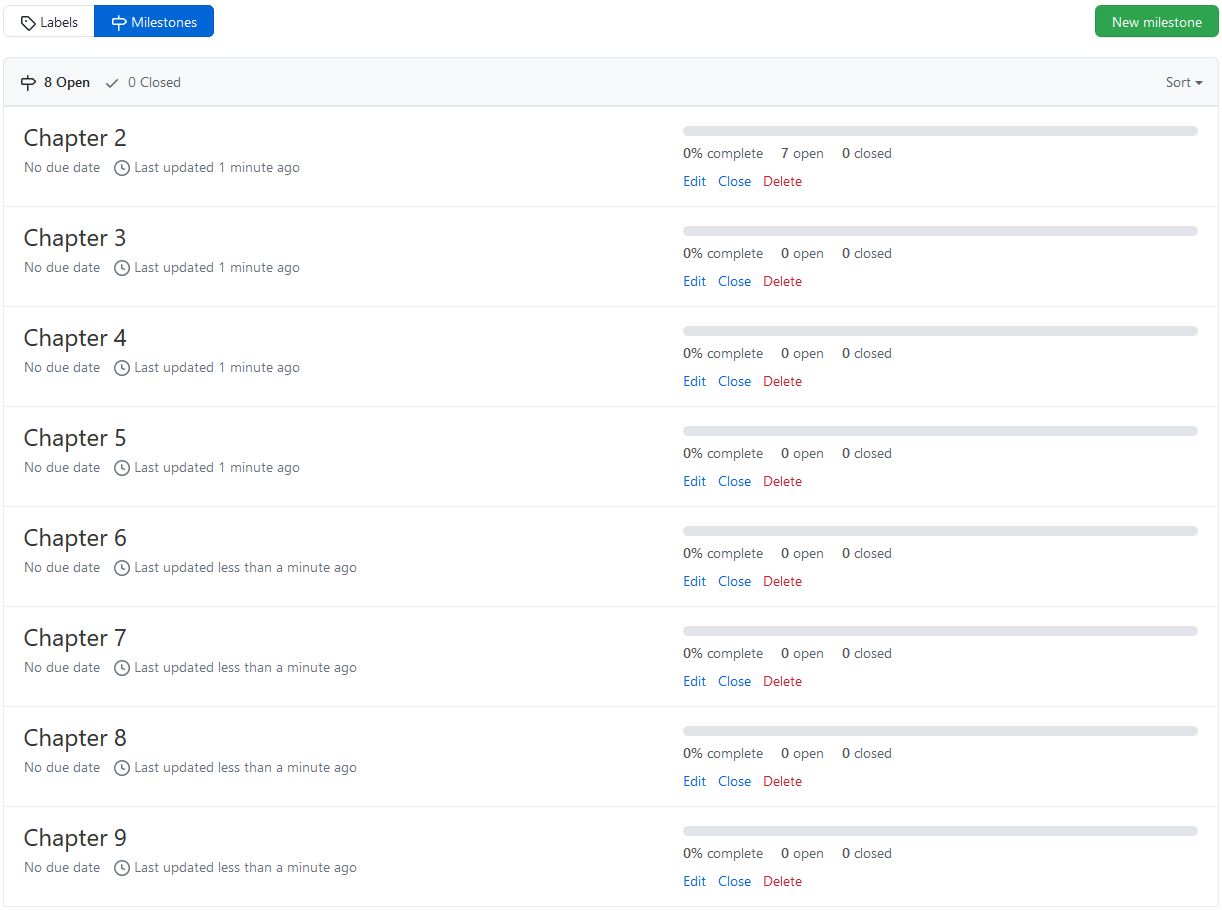
Figure 2-3. - Milestone listing for all CDA activities
See the green button? Simply click on that to add your milestone. I’d recommend using the names provided in Figure 2-3, as it will help to track all your work on a chapter-by-chapter basis in your project’s Kanban board. You’ll see how as we add each task next.
Create the CDA application module
Let’s create an Issue with the requirements for ConstrainedDeviceApp. Navigate back to your main CDA repository page and click ‘Issues’. There’s still a green button in the upper right corner, but it’s called ‘New issue’. Click that now.
Note
Issue tracking tools typically number your issues for you, often in the order created. To make searching and sorting easier, however, it helps to have your own naming convention embedded within the issue title. Here’s what I recommend and am using myself: PIOT-{app}-{chapter}-{order}, for example, PIOT-CDA-02-001. A quick look at the name tells me this issue is part of Programming the Internet of Things (PIOT), the CDA, Chapter 02, and task #001.
Name the issue PIOT-CDA-02-001: Create the CDA application wrapper module, and add the following contents to the description (feel free to customize if you’d like, but keep the template the same):
Description
-
Create the ConstrainedDeviceApp application in Python.
Actions
-
Create a new Python package in the programmingtheiotcda source folder named app and navigate to that folder.
-
Import the Python logging module: import logging
-
Create a new Python module named ConstrainedDeviceApp. Define a class within the module by the same name of ConstrainedDeviceApp.
-
Add the startApp() method, log info message indicating app was started.
-
Add the stopApp() method, log info message indicating app was stopped.
-
Add the main entry function to enable running as an application. It will create an instance of ConstrainedDeviceApp, call startApp(), wait 60 seconds, then call stopApp(), as follows:
def main():
    cda = ConstrainedDeviceApp()
    cda.startApp()

    while True:
        sleep(60)
    cda.stopApp()
if __name__ == '__main__':
    main()
Estimate (Small = < 2 hrs ; Medium = 4 hrs ; Large = 8 hrs )
-
Small
Tests
-
Run the ConstrainedDeviceAppTest unit tests. The log output should look similar to the following (you can ignore the non-INFO messages - these are generated by the PyUnit framework within Eclipse):
Finding files... done.
Importing test modules ... done.
2020-07-20 10:08:20,169:INFO:Initializing CDA...
2020-07-20 10:08:20,169:INFO:Loading configuration...
2020-07-20 10:08:20,169:INFO:Starting CDA...
2020-07-20 10:08:20,169:INFO:CDA started.
2020-07-20 10:08:20,169:INFO:CDA stopping...
2020-07-20 10:08:20,170:INFO:CDA stopped with exit code 0.
----------------------------------------------------------------------
Ran 1 test in 0.001s
OK
Notice the template includes sections for Description, Actions, Estimate, and Tests. This should be consistently applied to all your tasks - this way, when you’re reviewing what needs to be done, and what’s been accomplished, you have a consistent set of requirements and testing criteria for each one.
Note
As you begin implementation, you can add separate notes to chronicle your work. It’s often useful to add specifics such as algorithm idiosyncrasies, testing setup requirements, static design images, etc.
Save the issue, then navigate to the far right column. It will look similar to Figure 2-4. This is where you can assign the issue (to yourself), set the label to ‘Feature’, add a milestone, and align the issue to a project (the one you created in the previous chapter - this will ensure it shows up in your Kanban project board.
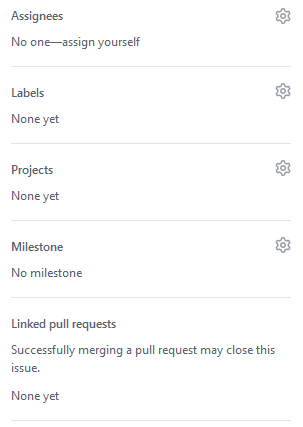
Figure 2-4. - You can set properties for each issue using the selections shown
OK - all the current requirements for the CDA application wrapper are known, so it’s time to start writing code!
-
Open your IDE and navigate to piot-python-components.
-
Navigate to ‘src -> main -> python -> programmingtheiot -> cda’ and create a new folder named ‘app’.
-
Add the remaining code as indicated in the task, including the logging.
Note
Since there’s a sleep call in the main function, you’ll need to import the time module using the following code:
from time import sleep
Follow the Test instructions to execute the ConstrainedDeviceAppTest unit test (there’s only one). Check the output in your IDE console - it will look similar to what I’ve included above.
Your ConstrainedDeviceApp is beginning to come together, but you still need a way to collect data and generate your first telemetry data. We’ll work on that next.
Create the SystemPerformanceManager module
The next issue to create is for the SystemPerformanceManager. Let’s name it PIOT-CDA-02-002 - Create module SystemPerformanceManager. Here’s the description content:
Description
-
Create a new Python module named SystemPerformanceManager with class name SystemPerformanceManager.
Actions
-
Create a class within the module named SystemPerformanceManager.
-
Add the startManager() method, log an info message indicating manager was started.
-
Add the stopManager() method, log an info message indicating manager was stopped.
Estimate (Small = < 2 hrs ; Medium = 4 hrs ; Large = 8 hrs )
-
Small
Tests
-
Run the SystemPerformanceManagerTest unit test. The log output should look similar to the following:
2020-07-06 21:03:03,654:INFO:Initializing SystemPerformanceManager...
2020-07-06 21:03:03,655:INFO:Started SystemPerformanceManager.
2020-07-06 21:03:03,656:INFO:Stopped SystemPerformanceManager.
This component will actually live in a different folder than the application, so let’s create that now. In your IDE, navigate to ‘src -> main -> python -> programmingtheiot -> cda’, and create a new folder named ‘system’.
The requirements for SystemPerformanceManager are pretty straight forward, so see if you can implement these on your own. You can always review the solutions located in my python-solutions GitHub page if you need a hint (https://github.com/programmingtheiot/python-solutions)!
Connect SystemPerformanceManager to ConstrainedDeviceApp
This task is really straight forward and should only take a few minutes. You’ll simply connect the SystemPerformanceManager start and stop methods into the ConstrainedDeviceApp start and stop methods, then run a quick test to ensure everything is working correctly.
You can name this task PIOT-CDA-02-003 - Connect SystemPerformanceManager to ConstrainedDeviceApp. Here’s the task description:
Description
-
Create an instance of SystemPerformanceManager within ConstrainedDeviceApp and invoke the manager’s start / stop methods within the app’s start / stop methods.
Actions
-
Create a class-scoped instance of SystemPerformanceManager within the ConstrainedDeviceApp constructor called sysPerfManager using the following:
self.sysPerfManager = SystemPerformanceManager() -
Edit the startApp() method to include a call to self.sysPerfManager.startManager().
-
Edit the stopApp() method to include a call to self.sysPerfManager.stopManager().
Estimate (Small = < 2 hrs ; Medium = 4 hrs ; Large = 8 hrs )
-
Small
Tests
-
Run the ConstrainedDeviceAppTest again. It will still call the startApp() and stopApp() methods on ConstrainedDeviceApp, but this time generate output that will look similar to the following:
Finding files... done.
Importing test modules ... done.
2020-07-20 10:23:00,146:INFO:Initializing CDA...
2020-07-20 10:23:00,147:INFO:Loading configuration...
2020-07-20 10:23:00,260:INFO:Starting CDA...
2020-07-20 10:23:00,260:INFO:Started SystemPerformanceManager.
2020-07-20 10:23:00,260:INFO:CDA started.
2020-07-20 10:23:00,260:INFO:CDA stopping...
2020-07-20 10:23:00,260:INFO:Stopped SystemPerformanceManager.
2020-07-20 10:23:00,260:INFO:CDA stopped with exit code 0.
----------------------------------------------------------------------
Ran 1 test in 0.115s
OK
Pretty simple, right? OK - almost there. Let’s create the different modules that will actually do the system monitoring next, and get them connected to the SystemPerformanceManager. You can see where I’m going with this, right?
Create the SystemCpuUtilTask module
This is where the rubber starts to hit the road for our system performance application. The SystemCpuUtilTask will retrieve the current CPU utilization across all cores, average them together, and return the result as a float.
Let’s name it PIOT-CDA-02-003 - Create module SystemCpuUtilTask. Here’s the description content:
Description
-
Create a new Python module named SystemCpuUtilTask with class name SystemCpuUtilTask.
Actions
-
Import the psutil library.
-
Create a class within the module named SystemCpuUtilTask.
-
In the constructor, add the following:
self.perfMgr = psutil() -
Add the getTelemetry() method, and add the following:
cpuUtilPct = self.perfMgr.cpu_percent() -
Within getTelemetry(), log an info message indicating data was collected along with the value of cpuUtilPct.
Estimate (Small = < 2 hrs ; Medium = 4 hrs ; Large = 8 hrs )
-
Small
Tests
-
Run SystemCpuUtilTaskTest as a PyUnit test. All tests should pass.
Note
You may recall psutil was one of the libraries you imported when setting up your virtualenv environment and used pip to install basic_imports.txt. This library gives you the ability to monitor system metrics, such as CPU utilization and memory utilization. You can read all about its features online (https://psutil.readthedocs.io/en/latest/#).
Look carefully at the action specifying the following line of code:
puUtilPct = self.perfMgr.cpu_percent()
The library will aggregate all cores into a single CPU percentage, which makes life rather easy for you as a developer. This class essentially boils down to returning the value of this single line of code.
OK, so before we go any further, why the fancy wrapper around the code? Isn’t this overkill? Simply put, yes it is. But you’ll see a pattern emerge in how you’ll write similar code to represent other, more complicated sensors. The point of this particular exercise is certainly to obtain the CPU utilization, but also to establish a pattern of separation of control, or separation of key functions so they can be managed and updated separately from the rest of the application’s logic.
Note
As with any software design, there’s a balance between complexity, clever coding, and just getting it done. I’ll attempt to strike that balance throughout the book. You may have different ideas - that’s great! I encourage you to consider how else you might implement each exercise to meet your specific needs. This is part of what makes programming creative and fun.
Create the SystemMemUtilTask module
Assuming your tests for SystemCpuUtilTask run and all pass, you can move onto the next module, which will be the creation of SystemMemUtilTask. This will retrieve the current virtual memory utilization and return the result as a float.
Let’s name it PIOT-CDA-02-004 - Create module SystemMemUtilTask. Here’s the description content:
Description
-
Create a new Python module named SystemMemUtilTask with class name SystemMemUtilTask.
Actions
-
Import the psutil library.
-
Create a class within the module named SystemMemUtilTask.
-
In the constructor, add the following:
self.perfMgr = psutil() -
Add the getTelemetry() method, and add the following:
memUtilPct = self.perfMgr.virtual_memory().percent -
Within getTelemetry(), log an info message indicating data was collected along with the value of memUtilPct.
Estimate (Small = < 2 hrs ; Medium = 4 hrs ; Large = 8 hrs )
-
Small
Tests
-
Run SystemMemUtilTask as a PyUnit test. All tests should pass.
The key functionality is encapsulated in the following line of code:
memUtilPct = self.perfMgr.virtual_memory().percent
There are other properties you can extract from the call to virtual_memory(), and you’re welcome to experiment. For now, just return the percent utilization.
Make sure your SystemMemUtilTaskTest PyUnit tests all pass before moving on. Now, let’s connect both SystemCpuUtilTask and SystemMemUtilTask to SystemPerformanceManager.
You can repeat these same steps for SystemMemUtilTask, but use the correct name of course! I’d suggest doing that now, and then run the SystemMemUtilTaskTest unit test to ensure it’s returning valid data.
How to Poll for Sensor Updates
Reading a single value from a sensor (emulated or real) is good, but not very useful for our purposes, since we’ll want to monitor these values over time to see if they change. Even after connecting SystemCpuUtilTask and SystemMemUtilTask into SystemPerformanceManager, you’ll want to process their data on a recurring basis.
There are many ways to do this in Python: You can build your own scheduling mechanism using Python’s concurrency library, or leverage one of many open source libraries to do this for you. I’ve included apscheduler1 in basic_imports.txt, which provides a scheduling mechanism that will suit our purposes rather well.
Note
Python provides two mechanisms for running code in a way that appears to execute simultaneously with other code. One is using concurrency, and the other is using multiprocessing. The former is handled using threads, whereas the latter is handled using separate child processes. One key difference is that Python threads actually get run in sequence using the same processor core as the main application, but they happen in such a way as to appear to be running simultaneously. Multiprocessing allows for true parallelism, where the code written using the multiprocessor library can be distributed to run on a separate processor core, which can execute in parallel to other code in a different processor core. The CDA-specific exercises and samples within this book will assume that threaded concurrency in Python is sufficient for our needs, and so I won’t discuss multiprocessing for any CDA development.
Integrating SystemCpuUtilTask and SystemMemUtilTask with SystemPerformanceManager
In this section, you’ll create two very similar tasks: PIOT-CDA-02-006 - Connect SystemCpuUtilTask to SystemPerformanceManager, and PIOT-CDA-02-007 - Connect SystemMemUtilTask to SystemPerformanceManager.
Here’s the description content for PIOT-CDA-02-006 - Connect SystemCpuUtilTask and SystemMemUtilTask to SystemPerformanceManager:
Description
-
Create an instance of SystemCpuUtilTask and SystemMemUtilTask within SystemPerformanceManager and use the apscheduler library to run each task at a regular interval.
Actions
-
Add the following import statement:
from apscheduler.schedulers.background import BackgroundScheduler -
Update the SystemPerformanceManager constructor to accept a parameter named pollRate and set the default to 30:
def __init__(self, pollRate = 30): -
Create a class-scoped instance of SystemCpuUtilTask within the SystemPerformanceManager constructor named cpuUtilTask
-
Create a class-scoped instance of SystemMemUtilTask within the SystemPerformanceManager constructor named memUtilTask
-
Create a public method named handleTelemetry() and add the following lines of code:
cpuUtilPct = self.cpuUtilTask.getTelemetry()
memUtilPct = self.memUtilTask.getTelemetry()
-
Within handleTelemetry() add an informational log message that logs the values of cpuUtilPct and memUtilPct
-
Create a class-scoped instance of BackgroundScheduler within the SystemPerformanceManager constructor named scheduler
-
Add a job to the scheduler within the SystemPerformanceManager using the following line of code:
self.scheduler.add_job(’self.handleTelemetry', ‘interval', seconds = pollRate)
Estimate (Small = < 2 hrs ; Medium = 4 hrs ; Large = 8 hrs )
-
Small
Tests
-
Add a unit test to SystemPerformanceManagerTest that will create the SystemPerformanceManager instance with pollRate = 10, call the startManager() method, wait for 65 seconds, and then call stopManager().
-
The test should display the application and SystemPerformanceManager start log messages, followed by a number of interspersed CPU utilization and memory utilization messages representing six (mostly) different values each, and then finally the SystemPerformanceManager and application stop log messages.
Note
Notice the use of apscheduler - it’s relatively straight-forward. This is partly because, in Python, you’re able to pass function pointers (yes, we’re calling them methods). This allows the callback you’ve already created in SystemPerformanceManager called handleTelemetry() to be easily invoked by apscheduler using concurrency.
You’re now ready to execute the full functional unit tests test of ConstrainedDeviceApp. Run it now, and examine the log output. It should look similar to the following (again, your log messages may be different than mine):
2020-07-06 21:03:03,654:INFO:Attempting to load configuration...
2020-07-06 21:03:03,655:INFO:Starting CDA...
2020-07-06 21:03:03,655:INFO:Initialized SystemPerformanceManager.
2020-07-06 21:03:03,656:INFO:Starting SystemPerformanceManager...
2020-07-06 21:03:03,656:INFO:CDA ran successfully.
Congratulations! You’ve just completed the first iteration of the CDA. It’s a fully standalone Python app, with a full suite of unit tests for you to build upon over the next chapters. Now let’s move onto the GDA and start writing some Java code.
The GDA
Your GDA will need the same three components as your CDA: an application wrapper, a system performance manager, and components to read the system performance data that will comprise your GDA’s telemetry.
Note
In IoT systems, the gateway device may or may not generate its own telemetry. The example you’ll build within this book only generates its own system performance telemetry. The constrained device, implemented as the CDA, will be responsible for not only generating its specific system performance telemetry, but any sensor-specific telemetry as well.
Let’s use the class diagram in Figure 2-5 to represent the GDA’s design. You’ll notice it looks surprisingly similar to our CDA Design (Figure 2-1), with the main differences being the implementation language, the application wrapper name, and - of course - the number of tasks!
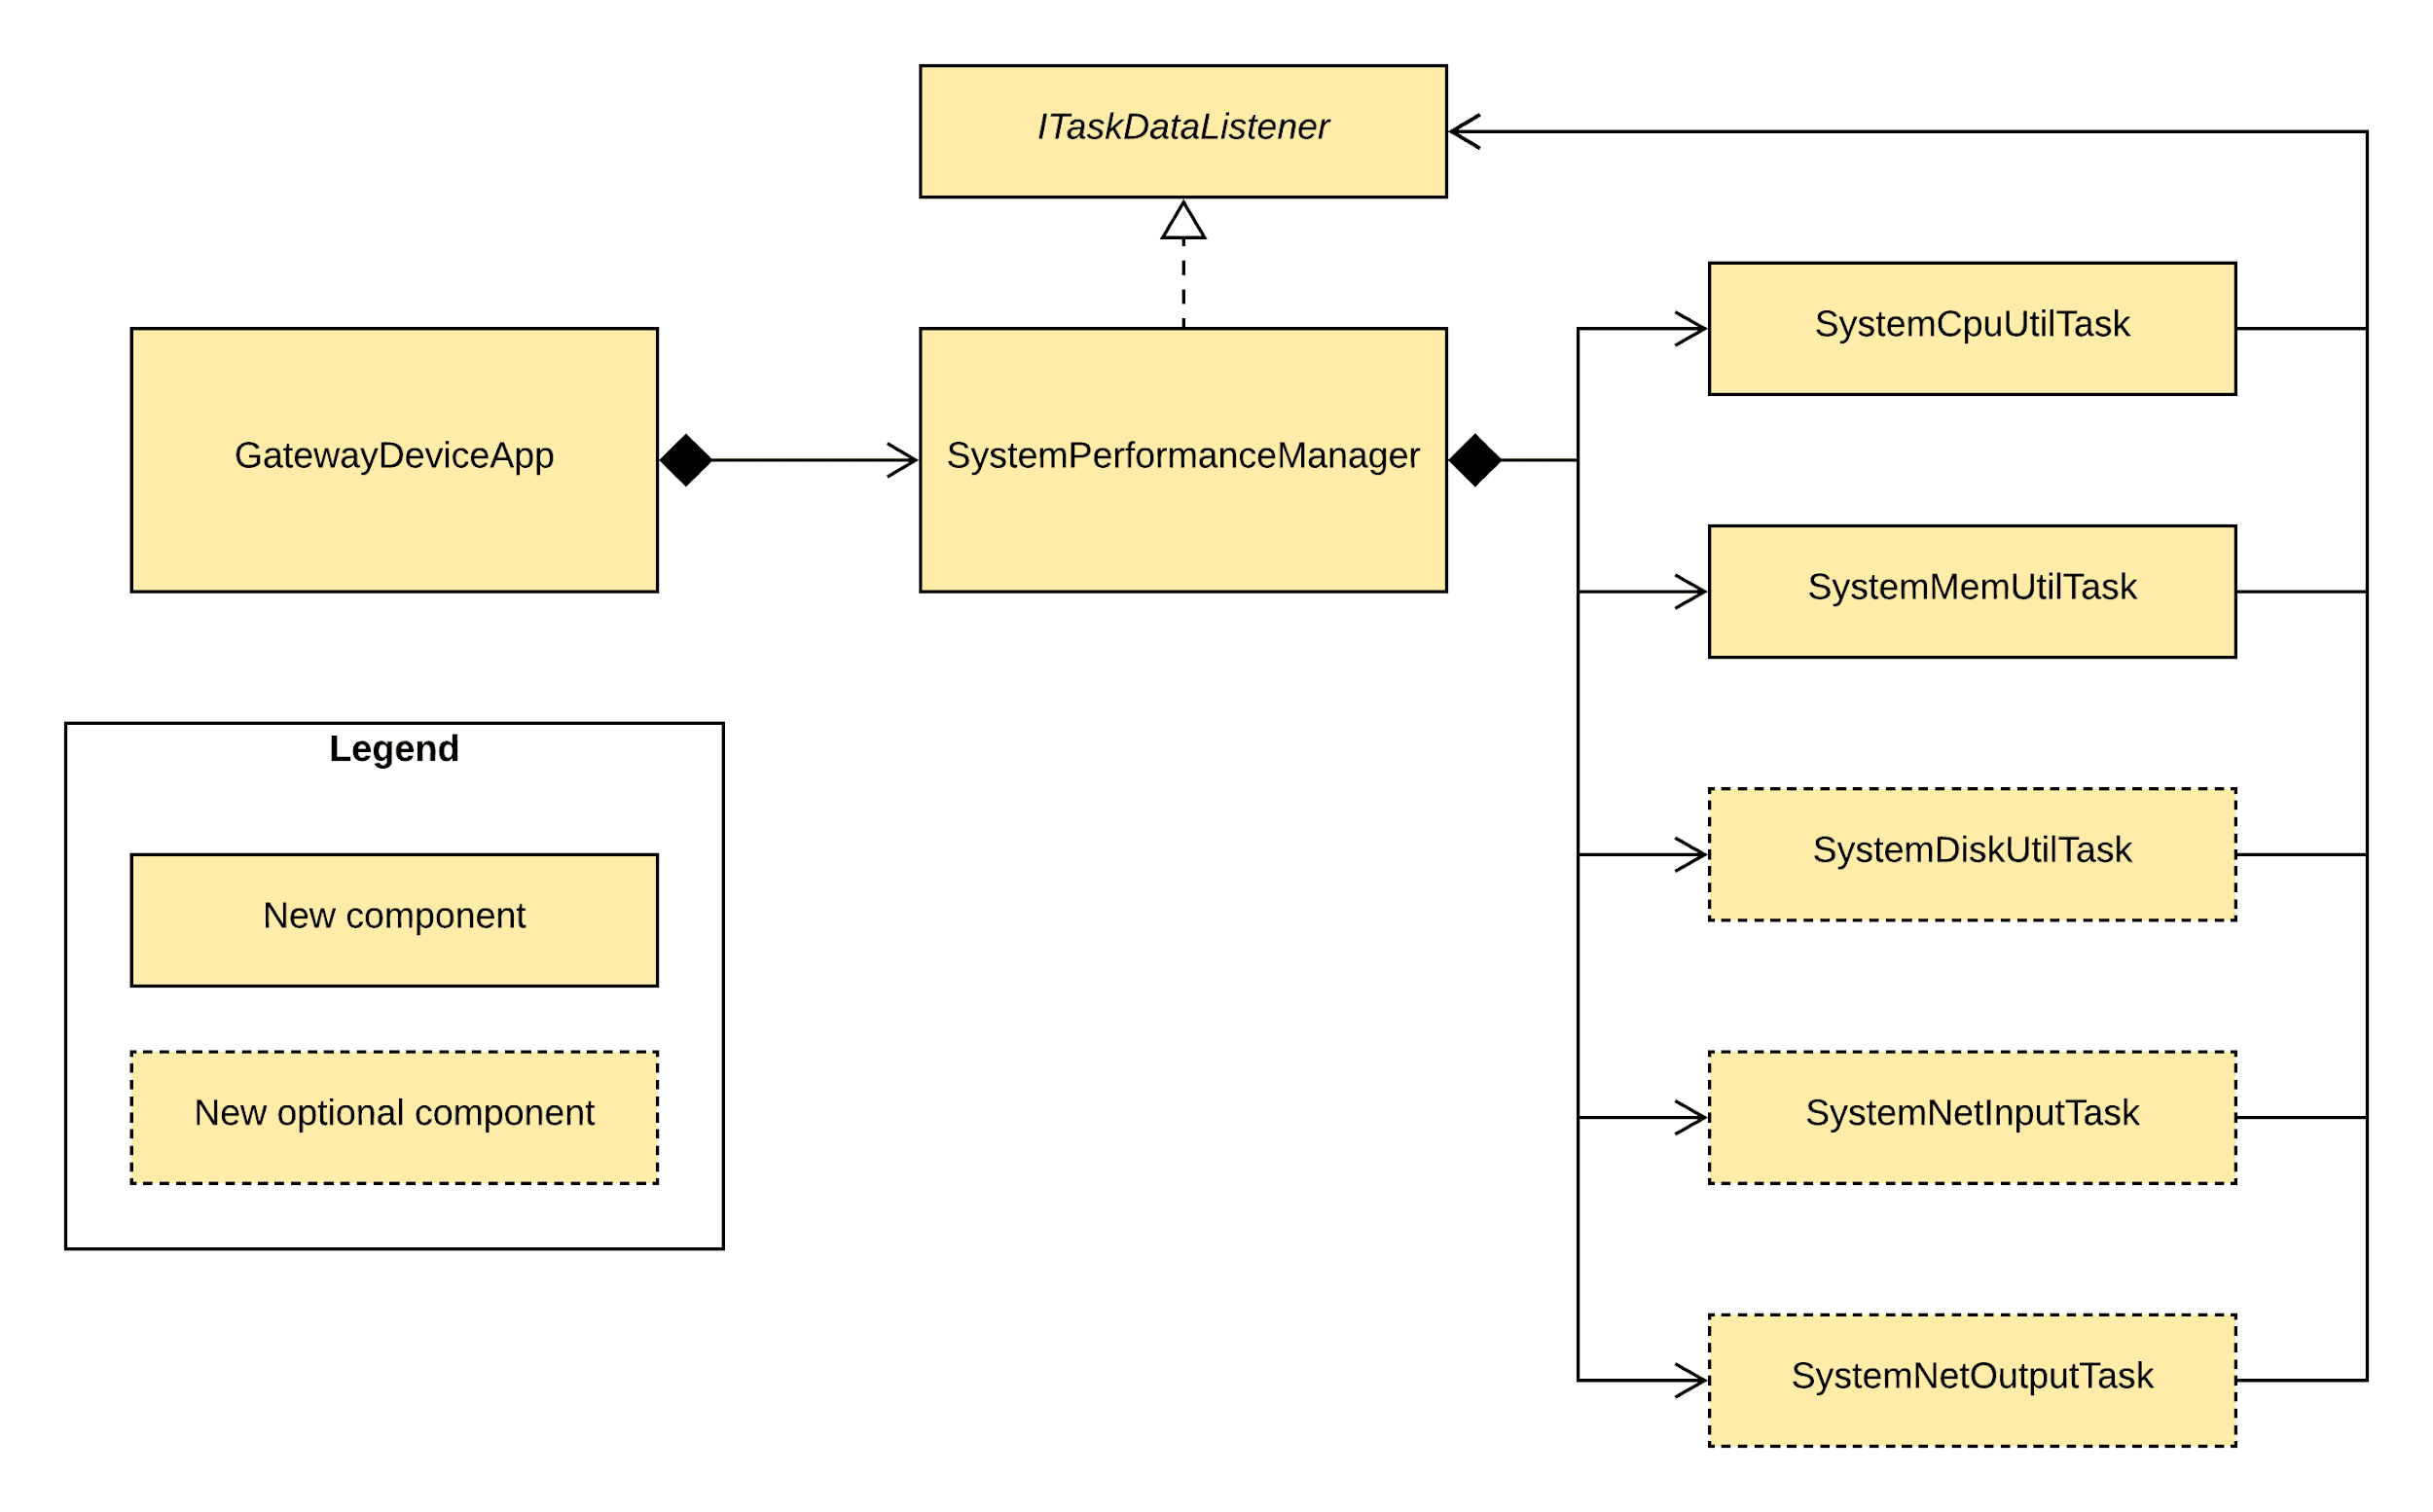
Figure 2-5. - GDA system performance design diagram
Why is the gateway device doing all of this work? Tracking CPU and memory utilization makes sense, since you’ll want to track the device’s overall load and memory consumption.
But disk and network utilization? In Chapter 5, I’ll discuss local caching of messages, so this will be an important metric to track. In Chapter 6 and beyond, I’ll dig into passing messages between devices (and eventually the cloud in Chapter 10), so tracking network utilization will be pretty useful as well.
Aren’t there tools for this? Sure, and you should use them when they make sense. Devices that are part of the IoT Edge Tier aren’t always easy to manage, nor are they always able to participate in network monitoring environments. This doesn’t mean we need to build everything from scratch! But, we will anyway. Because we can. And it’s fun :).
Back to the diagram. Notice that GatewayDeviceApp is the entry point for the application and creates the instance of, and manages, SystemPerformanceManager, which is rather similar to the CDA design. We also have a SystemCpuUtilTask and SystemMemUtilTask, along with the other tasks (SystemDiskUtilTask, SystemNetInputTask, and SystemNetOutputTask) that will help us later.
Note
It goes without saying, but if you’re already familiar with Java development and comfortable implementing your solution from the UML design in Figure 2-5, feel free to do so. But be sure to look carefully at the requirements in the next section first.
GDA Implementation Details
You’ll recognize these next steps, of course, because you already did something similar for the CDA. Since the GDA repository is different from the CDA repository, you’ll need to set up your issue tracker separately.
Figure 2-6 gives you the lay of the land regarding the requirements you need to implement for the GDA in this chapter, and I’ll walk through each in turn.
Figure 2-7 lists the milestones you should create, but take note that they’re a bit different from the CDA milestones. The names are the same (by design), but there are no milestones for Chapter 3 and Chapter 4, and yet there is a milestone for Chapter 10 (the CDA milestones end at Chapter 9).
Now would be a good time to create those milestones, and while you’re at it, edit the ‘Enhancement’ label and rename it to ‘Feature’.
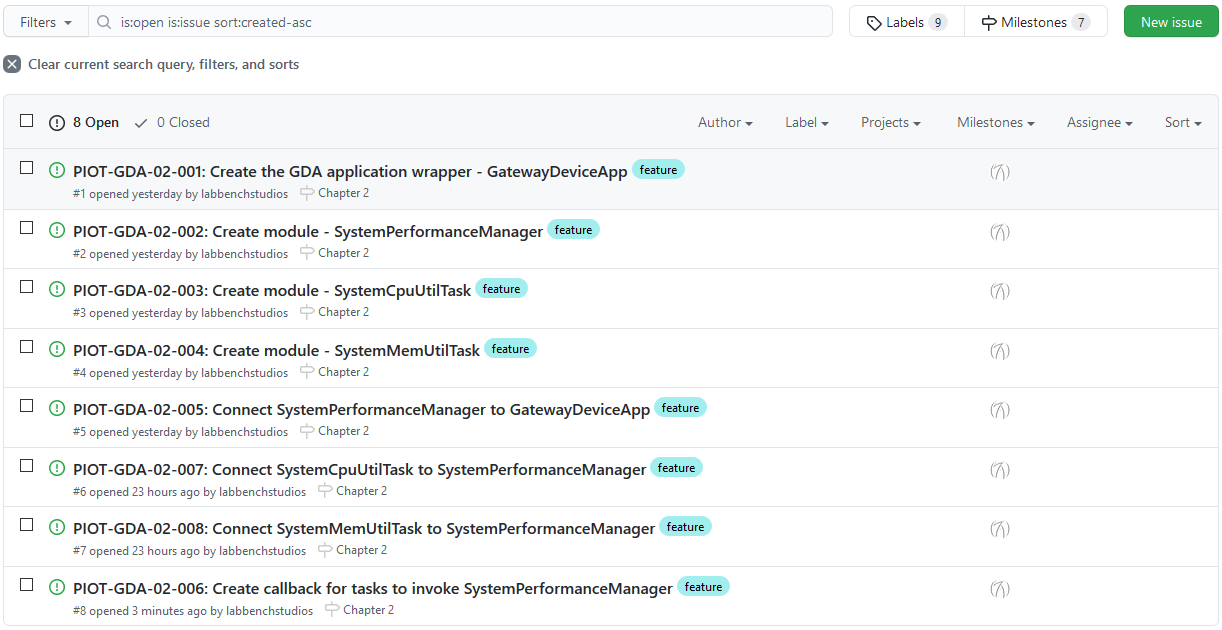
Figure 2-6. - GDA system performance design tasks
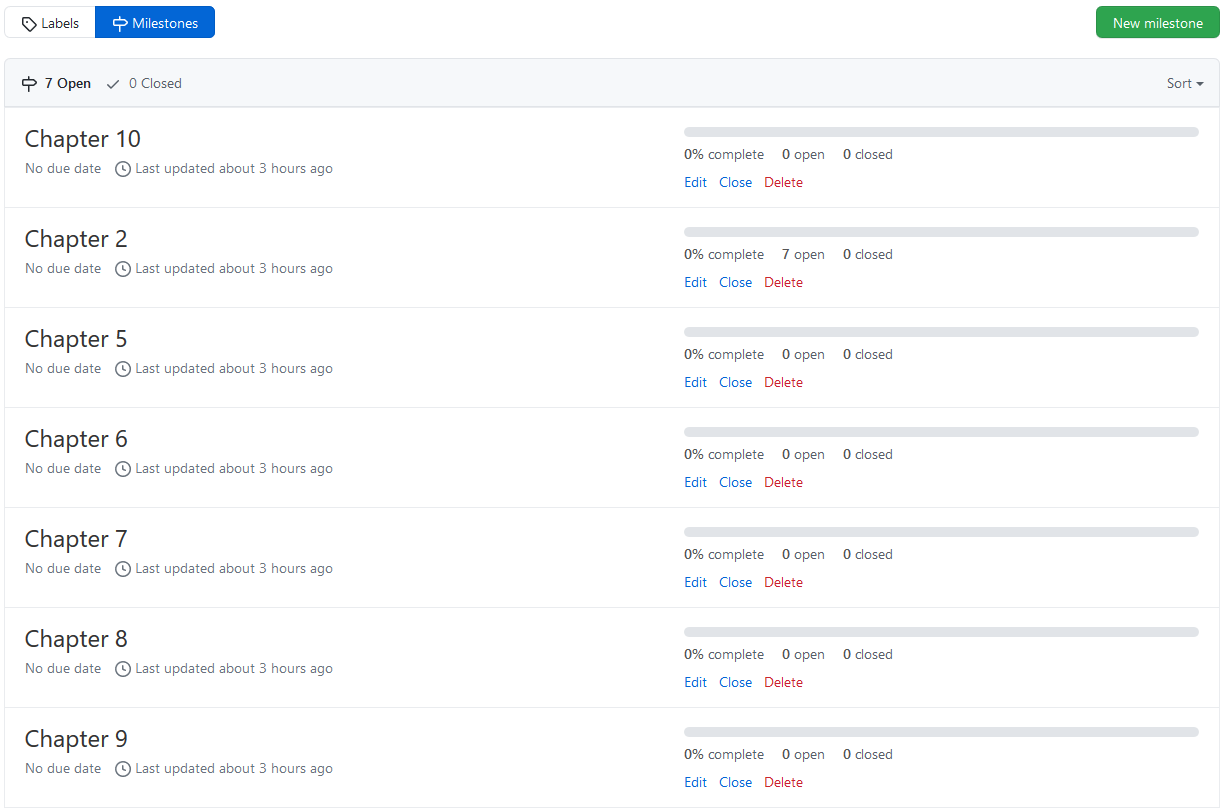
Figure 2-7. - Milestone listing for all GDA activities
Ready to create your first GDA issue? The process is the same one you followed for your first CDA issue. Navigate back to your main GDA repository page, click ‘Issues’, and then the green ‘New issue’ button. This is the process you’ll follow for each new issue within either repository.
Let’s start with the application wrapper for the GDA.
Create the GDA application module
Much like with the CDA, the GDA application module issue will be named PIOT-GDA-02-001: Create the GDA application wrapper module. Here are the details:
Description
-
Create a new Java class named GatewayDeviceApp.
Actions
-
Create a new Java package in the programmingtheiotgda source folder named app and navigate to that folder.
-
Import the java.util.logging logging framework. You can import all, or just Level and Logger.
-
Create a package-scoped constructor that accepts a single parameter as follows: private GatewayDeviceApp(String[] args)
-
Add the public stopApp(int code) method, and log an info message indicating the app was stopped. Include a try / catch block to handle the stop code. On exception, log an error message along with the stack trace. Outside of the try / catch block, and as the last line of code, log an informational message with the code included.
-
Add the public startApp() method, and log an info message indicating the app was started. Include a try / catch block to handle the start code. On exception, log an error message along with the stack trace, then call stopApp(-1).
-
Add the private initConfig(String fileName) method, and log an info message indicating the method was called. It will mostly remain empty for now.
-
Add the private parseArgs(String[] args) method, and log an info message indicating the method was called. For now, the args can be ignored. Before the method exits, call initConfig(null).
-
Update the constructor to include a call to parseArgs(args).
-
Add the public static void main(String[] args) method to enable running as an application. It will create an instance of GatewayDeviceApp, call startApp(), wait 60 seconds, then call stopApp(0), as follows:
public static void main(String[] args)
{
	GatewayDeviceApp gwApp = new GatewayDeviceApp(args);

	gwApp.startApp();

	try {
		Thread.sleep(60000L);
	} catch (InterruptedException e) {
		// ignore
	}

	gwApp.stopApp(0);
}
Estimate (Small = < 2 hrs ; Medium = 4 hrs ; Large = 8 hrs )
-
Small
Tests
-
Run the GatewayDeviceAppTest unit test named testRunGatewayApp(). The log output should look similar to the following:
Jul 19, 2020 12:53:45 PM programmingtheiot.gda.app.GatewayDeviceApp <init>
INFO: Initializing GDA...
Jul 19, 2020 12:53:45 PM programmingtheiot.gda.app.GatewayDeviceApp parseArgs
INFO: No command line args to parse.
Jul 19, 2020 12:53:45 PM programmingtheiot.gda.app.GatewayDeviceApp initConfig
INFO: Attempting to load configuration: Default.
Jul 19, 2020 12:53:45 PM programmingtheiot.gda.app.GatewayDeviceApp startApp
INFO: Starting GDA...
Jul 19, 2020 12:53:45 PM programmingtheiot.gda.app.GatewayDeviceApp startApp
INFO: GDA started successfully.
Jul 19, 2020 12:53:45 PM programmingtheiot.gda.app.GatewayDeviceApp stopApp
INFO: Stopping GDA...
Jul 19, 2020 12:53:45 PM programmingtheiot.gda.app.GatewayDeviceApp stopApp
INFO: GDA stopped successfully with exit code 0.
If you’ve downloaded the sample code, you’ll notice that this module is already created for you. Embedded within the module are a few commented ‘TODO’ lines of code as placeholders for you to eventually add more functionality.
If you’re starting from scratch, however, just follow the instructions above to implement your own version of the application wrapper.
Either way, run the unit test as specified - testRunGatewayApp() - by using the JUnit 4 Runner. If you’re using Eclipse as your IDE, simply right click on GatewayDeviceAppTest, and select “Run As -> JUnit Test”. You should get a green bar along with sample output as indicated under the “Tests” section above.
Your GatewayDeviceApp has some neat stuff in it, but it’s not very useful as an IoT gateway application. Let’s start working on the other components to bring this app to life.
Create the SystemPerformanceManager module
The next issue to create is for the SystemPerformanceManager. Let’s name it PIOT-GDA-02-002 - Create module SystemPerformanceManager. Here’s the description content:
Description
-
Create the SystemPerformanceManager module.
Actions
-
Create a new Java package in the programmingtheiotgda source folder named system and navigate to that folder.
-
Import the java.util.logging logging framework. You can import all, or just Level and Logger.
-
Create a private variable as follows: private int pollSecs = 60;
-
Create a public constructor that accepts a single parameter as follows: public SystemPerformanceManager(int pollSecs)
-
Set this.pollSecs to pollSecs only after validating that pollSecs is more than 1 and less than Integer.MAX. You may choose other constraints if you wish.
-
Add the startManager() method, and log an info message indicating manager was started.
-
Add the stopManager() method, and log an info message indicating the manager was stopped.
Estimate (Small = < 2 hrs ; Medium = 4 hrs ; Large = 8 hrs )
-
Small
Tests
-
Run the SystemPerformanceManagerTest unit test named testRunManager(). The log output should look similar to the following:
Jul 19, 2020 1:01:38 PM programmingtheiot.gda.system.SystemPerformanceManager startManager
INFO: SystemPerformanceManager is starting...
Jul 19, 2020 1:01:38 PM programmingtheiot.gda.system.SystemPerformanceManager stopManager
INFO: SystemPerformanceManager is stopped.
The one currently active unit test for SystemPerformanceManager is rather simple and not really automated, in that the only validation is via a log file review. As you hook all the pieces together, you’ll see how your unit tests for other classes can be automatically validated, and then used to automate the entire test flow of your system.
Connect SystemPerformanceManager to GatewayDeviceApp
This is a simple task designed to hook the SystemPerformanceManager to GatewayDeviceApp, and the only objective with this is to ensure the app can properly delegate work to the SystemPerformanceManager component.
You can name this task PIOT-GDA-02-003: Connect SystemPerformanceManager to GatewayDeviceApp. Here are the task details:
Description
-
Connect SystemPerformanceManager to GatewayDeviceApp so it can be started and stopped with the application. This work should be implemented within the GatewayDeviceApp class.
Actions
-
Create a class-scoped variable named sysPerfManager.
-
Create an instance of SystemPerformanceManager within the GatewayDeviceApp constructor called this.sysPerfManager. Use ’10’ as the parameter to the constructor.
-
Edit the startApp() method: Add a call to sysPerfManager.startManager().
-
Edit the stopApp() method: Add a call to sysPerfManager.stopManager().
Estimate (Small = < 2 hrs ; Medium = 4 hrs ; Large = 8 hrs )
-
Small
Tests
-
Run the GatewayDeviceAppTest unit test named testRunGatewayApp(). The log output should look similar to the following:
Jul 19, 2020 1:01:38 PM programmingtheiot.gda.app.GatewayDeviceApp <init>
INFO: Initializing GDA...
Jul 19, 2020 1:01:38 PM programmingtheiot.gda.app.GatewayDeviceApp parseArgs
INFO: No command line args to parse.
Jul 19, 2020 1:01:38 PM programmingtheiot.gda.app.GatewayDeviceApp initConfig
INFO: Attempting to load configuration: Default.
Jul 19, 2020 1:01:38 PM programmingtheiot.gda.app.GatewayDeviceApp startApp
INFO: Starting GDA...
Jul 19, 2020 1:01:38 PM programmingtheiot.gda.system.SystemPerformanceManager startManager
INFO: SystemPerformanceManager is starting...
Jul 19, 2020 1:01:38 PM programmingtheiot.gda.app.GatewayDeviceApp startApp
INFO: GDA started successfully.
Jul 19, 2020 1:01:38 PM programmingtheiot.gda.app.GatewayDeviceApp stopApp
INFO: Stopping GDA...
Jul 19, 2020 1:01:38 PM programmingtheiot.gda.system.SystemPerformanceManager stopManager
INFO: SystemPerformanceManager is stopped.
Jul 19, 2020 1:01:38 PM programmingtheiot.gda.app.GatewayDeviceApp stopApp
INFO: GDA stopped successfully with exit code 0.
Simple, right? Notice the testing requirement - it’s not on the SystemPerformanceManager; you’re simply rerunning the GatewayDeviceAppTest unit test called testRunGatewayApp(). Neither this test nor the SystemPerformanceManager test has changed - the connection between the two is now enabled, so the output is a bit different.
With both components integrated, let’s build out the actual system performance telemetry collection logic.
Create the SystemCpuUtilTask module
This is where the rubber starts to hit the road for our system performance application. The SystemCpuUtilTask will retrieve the current CPU utilization across all cores, average them together, and return the result as a float.
Let’s name it PIOT-CDA-02-004 - Create module SystemCpuUtilTask. Here’s the description content:
Description
-
Create the SystemCpuUtilTask module and implement the functionality to retrieve CPU utilization.
Actions
-
Within the programmingtheiot.gda.system package, create a new Java class named SystemCpuUtilTask.
-
Add the following import statements:
-
import java.lang.management.ManagementFactory;
-
Add the public getTelemetry() method. It will retrieve CPU utilization (averaged across any / all cores) and return the value as a float. Use the following code for the value: ManagementFactory.getOperatingSystemMXBean().getSystemLoadAverage()
Estimate (Small = < 2 hrs ; Medium = 4 hrs ; Large = 8 hrs )
-
Small
Tests
-
Run the SystemCpuUtilTaskTest unit test (there’s only one). If your Operating System supports retrieval of CPU load, each test should pass while displaying values greater than 0.0% and (likely) less than 100.0%. If your Operating System doesn’t support this, each test will result in negative value, as follows:
Test 1: CPU Util not supported on this OS: -1.0
Test 2: CPU Util not supported on this OS: -1.0
Test 3: CPU Util not supported on this OS: -1.0
Test 4: CPU Util not supported on this OS: -1.0
Test 5: CPU Util not supported on this OS: -1.0
Note
You may recall psutil was one of the libraries you imported when setting up your virtualenv environment and used pip to install basic_imports.txt. This library gives you the ability to monitor system metrics, such as CPU utilization and memory utilization. You can read all about its features online (https://psutil.readthedocs.io/en/latest/#).
Look carefully at the action specifying the following line of code:
puUtilPct = self.perfMgr.cpu_percent()
The library will aggregate all cores into a single CPU percentage, which makes life rather easy for you as a developer. This class essentially boils down to returning the value of this single line of code.
OK, so before we go any further, why the fancy wrapper around the code? Isn’t this overkill? Simply put, yes it is. But you’ll see a pattern emerge in how you’ll write similar code to represent other, more complicated sensors.
One object with each exercise is to establish a pattern of separation of control, or the separation of key functions so they can be managed and updated separately from the rest of the application’s logic.
Note
As with any software design, there’s a balance between complexity, clever coding, and just getting it done. I’ll attempt to strike that balance throughout the book. You may have different ideas - that’s great! I encourage you to consider how else you might implement each exercise to meet your specific needs. This is part of what makes programming creative and fun.
Create the SystemMemUtilTask module
I’m sure you’ve noticed a pattern here. We’re replicating some of the functionality within the CDA here within the GDA. This is due to the nature of distributed IoT devices and various operating or runtime environments, as I’ve mentioned previously in the Preface.
This next task is to create the memory utilization collection logic. Let’s name it PIOT-GDA-02-005 - Create module SystemMemUtilTask, and use the following as the description content:
Description
-
Create the SystemMemUtilTask module and implement the functionality to retrieve JVM memory utilization.
Actions
-
Within the programmingtheiot.gda.system package, create a new Java class named SystemMemUtilTask.
-
Add the following import statements:
-
import java.lang.management.MemoryUsage;
-
Add the getTelemetry() method. It will retrieve JVM memory utilization and return the value as a float. Use the following code for the value: ManagementFactory.getMemoryMXBean().getHeapMemoryUsage().getUsed()
Estimate (Small = < 2 hrs ; Medium = 4 hrs ; Large = 8 hrs )
-
Small
Tests
-
Run the SystemMemUtilTaskTest unit test. It should pass while logging values between 0.0% and 100.0%.
The key functionality is encapsulated in the following line of code:
memUtilPct = self.perfMgr.virtual_memory().percent
There are other properties you can extract from the call to virtual_memory(), and you’re welcome to experiment. For now, just return the percent utilization.
Make sure your SystemMemUtilTaskTest JUnit tests all pass before moving on. Now, let’s connect both SystemCpuUtilTask and SystemMemUtilTask to SystemPerformanceManager.
Running repeatable tasks in Java
Although your GDA isn’t collecting sensor data, it clearly needs to gather and assess its own system performance (such as CPU and memory utilization, of course). This type of functionality is typically collected in the background at regular intervals, and as with Python, Java provides options for creating polling systems.
Fortunately, there’s no need to import any separate libraries, however, because this is built-in to the core Java SDK.
Note
Java’s concurrency library is quite powerful, and allows you to use a basic Timer functionality as well as a ScheduledExecutorService (you can also create your own threaded polling system if you really want to, of course). We’ll use ScheduledExecutorService, as it provides a semi-guaranteed way to poll at regular intervals, handling most of the complexity for us. Modern Java virtual machines will handle the load distribution across the CPU architecture, meaning it will utilize multiple cores if at all possible.
Integrating SystemCpuUtilTask and SystemMemUtilTask with SystemPerformanceManager
In this section, you’ll create two very similar tasks: PIOT-GDA-02-006 - Connect SystemCpuUtilTask and SystemMemUtilTask to SystemPerformanceManager.
This particular exercise is a bit more involved, even though it doesn’t take many lines of code to complete. This is because you’ll be using both concurrency and a Runnable implementation, the latter of which is just an interface definition for a method that can be invoked one or more times by a Java thread.
Let’s document this work using the following description:
Description
-
Connect SystemCpuUtilTask and SystemMemUtilTask into SystemPerformanceManager, and call each instance’s handleTelemetry() method from within a thread that starts when the manager is started, and stops when the manager is stopped. This work should be implemented within the SystemPerformanceManager class.
Actions
-
Add the following import statements:
import java.util.concurrent.Executors;
import java.util.concurrent.ScheduledExecutorService;
import java.util.concurrent.ScheduledFuture;
import java.util.concurrent.TimeUnit;
-
Add the following members to the class:
private ScheduledExecutorService schedExecSvc = null;
private SystemCpuUtilTask sysCpuUtilTask = null;
private SystemMemUtilTask sysMemUtilTask = null;
private Runnable taskRunner = null;
private boolean isStarted = false;
-
Create a public method named handleTelemetry() that includes the following:
-
cpuUtilPct = this.cpuUtilTask.getTelemetry()
-
memUtilPct = this.memUtilTask.getTelemetry()
-
Log an info message that includes the values of cpuUtilPct and memUtilPct
-
-
Within the constructor, add the following:
this.schedExecSvc = Executors.newScheduledThreadPool(1);
this.sysCpuUtilTask = new SystemCpuUtilTask();
this.sysMemUtilTask = new SystemMemUtilTask();
this.taskRunner = () -> {
    this.handleTelemetry();
};
-
Within the startManager() method, add the following:
if (! this.isStarted) {
    ScheduledFuture<?> futureTask = this.schedExecSvc.scheduleAtFixedRate(this.taskRunner, 0L, this.pollSecs, TimeUnit.SECONDS);
    this.isStarted = true;
}
-
Within the stopManager() method, add the following: this.schedExecSvc.shutdown();
Estimate (Small = < 2 hrs ; Medium = 4 hrs ; Large = 8 hrs )
-
Medium
Tests
-
In the GatewayDeviceAppTest test case, comment out the @Test annotation before the testRunGatewayApp() unit test, and uncomment the @Test annotation before the testRunTimedGatewayApp unit test. Run the latter test - it should yield output similar to the following:
Jul 19, 2020 1:53:19 PM programmingtheiot.gda.app.GatewayDeviceApp <init>
INFO: Initializing GDA...
Jul 19, 2020 1:53:19 PM programmingtheiot.gda.app.GatewayDeviceApp parseArgs
INFO: No command line args to parse.
Jul 19, 2020 1:53:19 PM programmingtheiot.gda.app.GatewayDeviceApp initConfig
INFO: Attempting to load configuration: Default.
Jul 19, 2020 1:53:19 PM programmingtheiot.gda.app.GatewayDeviceApp startApp
INFO: Starting GDA...
Jul 19, 2020 1:53:19 PM programmingtheiot.gda.system.SystemPerformanceManager startManager
INFO: SystemPerformanceManager is starting...
Jul 19, 2020 1:53:19 PM programmingtheiot.gda.app.GatewayDeviceApp startApp
INFO: GDA started successfully.
Jul 19, 2020 1:53:20 PM programmingtheiot.gda.system.SystemPerformanceManager handleTelemetry
INFO: Handle telemetry results: cpuUtil=-1.0, memUtil=6291456.0
Jul 19, 2020 1:53:50 PM programmingtheiot.gda.system.SystemPerformanceManager handleTelemetry
INFO: Handle telemetry results: cpuUtil=-1.0, memUtil=6291456.0
Jul 19, 2020 1:54:20 PM programmingtheiot.gda.system.SystemPerformanceManager handleTelemetry
INFO: Handle telemetry results: cpuUtil=-1.0, memUtil=6291456.0
Jul 19, 2020 1:54:24 PM programmingtheiot.gda.app.GatewayDeviceApp stopApp
INFO: Stopping GDA...
Jul 19, 2020 1:54:24 PM programmingtheiot.gda.system.SystemPerformanceManager stopManager
INFO: SystemPerformanceManager is stopped.
Jul 19, 2020 1:54:24 PM programmingtheiot.gda.app.GatewayDeviceApp stopApp
INFO: GDA stopped successfully with exit code 0.
To test all of this new goodness, you only need to run the GatewayDeviceAppTest unit test named testRunTimedGatewayApp(). Follow the instructions listed above under the Test section.
Note
JUnit unit tests can be included or excluded in a test run by using the @Test annotation before the unit test method. You can simply comment it out / uncomment it as desired. Note also that unit tests are not designed to run in any particular order - you should expect any random order and write your tests as standalone.
The sample output is provided above - notice that it’s quite extensive! This is because you’re not only doing a bunch of cool stuff, you’re also running the app for over a minute.
If your test run yields similar output, fantastic! Now you can really celebrate. You’ve just completed the first iteration of both IoT Edge Tier applications - the GDA and the CDA. The rest of this book is about adding functionality to these applications, connecting them together, and eventually hooking everything up to a cloud service. Buckle up!
Additional Exercises
Figure 2-5 indicates the GDA actually has more than two telemetry collection tasks. These are optional, but still important. See if you can add the SystemDiskUtilTask, SystemNetInTask and SystemNetOutTask components using the patterns for SystemCpuUtilTask and SystemMemUtilTask.
In fact, it’s not a bad idea to implement these for the CDA as well, although it’s less relevant as your CDA won’t be collecting and storing much data.
Don’t forget to add your unit test cases for each!
1 You can read more about apscheduler on its website (https://apscheduler.readthedocs.io/en/latest/userguide.html).