C H A P T E R
5
Step 3: Generate a Good Risk-Adjusted Return on Investments
How to Successfully Manage Your Own Investment Accounts
This chapter is all about effectively managing your investment accounts. If you're like most people I talk to, you have at least one brokerage account, possibly a 401(k) with your current (or a previous) employer, and maybe even an Individual Retirement Account (IRA) as well.
In the 401(k), you will probably be contributing a fixed percentage of your salary each month, your employer will be doing matching contributions, and then the whole lot will be fully invested using the “percentage allocation” model you set when you joined the company and then forgot about.
In your IRA, you're probably buying and holding (aka buying and hoping), dollar cost averaging, or putting it all into a fund that automatically adjusts your equity/bond/cash balance over time. If you're a sophisticated investor, you might even be choosing a diversified portfolio of investments yourself and doing some sort of periodic rebalancing.
In your brokerage account you're probably doing some combination of the above, along with a little bit of whatever you just heard on CNBC, whatever you just read in the Wall Street Journal, whatever your brother-in-law just invested in, and any other random investment methods and ideas that you made up as you went along or were recommended to you by someone in the financial industry.
Before we even get to thinking about how to effectively manage any investment account (retirement or otherwise), it's important that you grasp three major concepts. You need to:
- Know exactly how to determine your current risk-adjusted return for each account and understand whether this is acceptable or not
- Understand what a complete investment method looks like
- Know how to construct a complete investment method that can be operated in your account, and also have the dedication, skill, and knowledge required to accurately implement it
This may sound scary, but it's relatively straightforward. And you don't need to quit your day job to find the time you need to accomplish your goals. Far from it. But you do need to be committed to taking control of your finances.
Let's cover how to measure and interpret your risk-adjusted return first, since this will tell you whether you're an investment genius or whether you're taking way to much risk for far too little return in your investment accounts. My money is on the latter, by the way.
How to Measure Risk-Adjusted Return Effectively
Measuring the performance of your investment account is not a complicated affair, but it is essential that you understand how to do it in a representative way. Just because your account balance is going up (especially if you're making contributions to it along the way) doesn't mean you're generating good results. Remember Figure 2-8 in Chapter 2 that showed what dollar cost averaging in SPY (the S&P 500 ETF) looked like over the last ten years? The chart was sloping in the right direction (upward), but the return being achieved in the context of the risk being taken was just terrible.
So, how do we measure risk and return effectively?
Let's Look at Return
Most people can easily grasp the concept of return. Do I have more or less than I started off with? If the answer is, “Yes, I have more,” then it's a pretty simple calculation to turn this into a percentage. For example, if you start with $100,000 and your account now has a value of $120,000, then you have a 20% return:
($120,000 – $100,000) / $100,000 = 20%
Is that a good result? That depends on two things; one is simple to determine, and one is a little harder and is nearly always ignored by most people. The first is how long it took to generate the return. If you made 20% in one year, then that's pretty good. If you made 20% in ten years, then that's not so great. In order to take time into account, it's essential to calculate the compound annual growth rate (CAGR), rather than simply the total percentage return.
The CAGR is the annual rate of return that gives you the total return achieved (20% in our example) over the time period being measured. In our example, if it took one year, then the calculation is simple—you made 20% in one year. Therefore, the CAGR is equal to 20%.
In the example where it took ten years, we need to determine how much per year (as a percentage) you would have to make for the total return to equal 20% after ten years. This is easy to do in a spreadsheet by using the POWER function. If you know the total return percentage as a decimal (Total Return in the following equation), and the number of years, then you can use the following formula to determine the CAGR percentage:
CAGR = POWER (1 + Total Return, 1 / Number of Years) – 1
In this example, where Total Return is 0.20 and the number of years is 10, we have the following:
CAGR = POWER (1.2, 1 / 10) – 1
This gives an answer of 1.84% (rounded), meaning that the CAGR is 1.84% if you made 20% in total over ten years. You can check this answer by reversing the formula. If you know the CAGR as a decimal CAGR, and the number of years, then you can work out the total return by using the following formula:
Total Return = POWER (1 + CAGR, Number of Years) – 1
which in this case is:
Total Return = POWER (1.0184, 10) – 1
This gives the answer 20%, meaning that 1.84% compounded for ten years turns into 20%. Note that in our example we started off with a fixed amount of $100,000, which grew to $120,000 over the period. If you had made additional contributions during that time, then it's important to deduct them from the return made before attempting to calculate the CAGR.
But if you really want to include all your contributions, it can be done. There are lots of complicated ways of determining actual return when there have been contributions and withdrawals from an account, but for our purposes we can use the following simple formula:
(Ending Value – Total Investment) / Total Investment
So, in our example, if you had started with $100,000 and added $5000 in total over ten years, and the ending value was still $120,000, then the total return was
($120,000 – $100,000 – $5,000) / ($100,000 + $5,000)
This gives us 14.29% for our total return, and using the POWER function formula from before, a CAGR of 1.4%.
Let's Look at Risk
So now that we've taken care of the return side of the problem by determining the CAGR, we need to look at the second thing I mentioned: the risk side of the problem.
If I told you I knew of a method that would provide a CAGR of 50%, you would probably think that sounded great. If you had $100,000 to invest, in ten years time that would be worth $5,766,504 if you just left it alone to compound! You may be thinking, “Where do I send the check?”
Naturally, there's a catch. During that time period, you would have had to suffer over a 90% loss. At some point your account could have been worth only $10,000. Does it sound like a good idea now? Could your nerves handle it? This is the key point—CAGR is only meaningful if you know the risk (as represented by the maximum loss that was incurred during the period) that was taken to achieve it. This is where maximum drawdown (DD) comes in.
Calculating a percentage DD is a little trickier than calculating the CAGR. What you need to do is establish the periodic value of your account and then plug these numbers into a spreadsheet. If this is an account where you have simply invested an initial amount of cash and then bought and sold securities in it, then a simple monthly total value will suffice for the life of the account.
If you have made repeating or periodic contributions to (or withdrawals from) the account, then the calculation is a little more complex. Each monthly total value must be modified to deduct each previous additional contribution (or add back each previous withdrawal) so you can calculate the CAGR on your investments not including withdrawals and contributions.
Then you can calculate the highest highs and the subsequent lowest lows, and work out the maximum percentage decline from a high (peak) to a low (trough). Once you have done this, then you have the two components of the MAR ratio:
MAR Ratio = CAGR %/ Maximum Drawdown %
Using the MAR ratio, we can directly compare any investment techniques to see if they are providing a reasonable risk-adjusted return. Note that a MAR ratio of 1.0 is impossible to maintain over long periods of time. The CAGR is being earned every year, but the DD is tolerated only once and recovered from. A MAR ratio of 0.5 is a more achievable target, and this is still vastly superior to “traditional” investment account methods that provide little (or negative) return coupled with large, uncontrolled drawdowns.
A good homework exercise right now would be to do some number crunching to calculate the MAR ratio of all your investment accounts over the last ten years. This should be done on a “total account” basis, rather than on individual positions. It would be even better if you could aggregate all your accounts together into one master account that represents all your investing activity.
I'm sure the numbers will be both interesting and eye-opening, especially if you have never done any kind of risk-adjusted-return analysis before. Your last financial advisor told you to just invest and then forget about it, right? After all, nobody can “time the market,” and you're not going to get out of your investments whatever happens, so why worry yourself with short-term results when you don't need the cash in the account for years and years in the future?
I'll assume you went off and did your homework and came back with terrible MAR ratios that were much less than 0.5, or even much less than zero. And your CAGRs are probably nowhere near the “standard” 10% everybody talks about, and you most likely have drawdowns that are at least 50%, if not closer to 60%. If this is not the case, then you're already an investment guru (or you did your number crunching wrong), and you don't need to read the rest of this chapter.
If the only result of reading this chapter is that you finally understand whether you're getting paid for the risk you are taking in your investments accounts, then all your hard work understanding this information so far will have paid off big time. You may not be inclined to actively manage your investments yourself, but if you stop doing what doesn't work and put that cash into your emergency fund or savings as described in the previous two chapters, you'll be much better off than if you do nothing.
Let's assume you now realize that you're getting a terrible result from your current investment management methods (if you can call what you've been doing before “a method”). Before we get into the details about managing your investments, I need to make a couple of things very clear:
- For most people, it is not appropriate or rational to take uncontrolled risk in an investment account, with little chance of a decent return—especially with your retirement savings.
- There is no way that I (or anyone) can show you how to achieve the same performance that a full-time professional money manager can achieve in your investment accounts, even if you do put in the hour per week or so of effort into a spreadsheet, as this chapter will show you how to do.
For these reasons it's important that I talk about not actively managing your investment accounts before I talk about how to manage them effectively.
Don't Even Think About Trying to Manage Your Retirement Account
I've shown earlier in this book that FARCE1 doesn't work, and if that's what you're doing in your retirement or investment accounts, then you're likely going to be disappointed when you retire. If your employer is making matching contributions, then you should treat these as your “return on investment.” This “free money,” along with the deferral of income taxes until you retire, should mean that your account grows faster than inflation.
If you think about this for a minute, you should reach a conclusion: you should put your entire retirement account into a money market fund to minimize risk. Yes, you'll get a tiny return, but you'll pay the lowest fees and have the lowest chance of losing money. Note that your plan sponsor, your employer, your friends and family, or anyone else you mention this to will think you are crazy to give up the long-term “10%-a-year return” that so many investment advisors point to as a bedrock financial fact. Don't even attempt to explain your rationale—just tell them to read this book.
As for your other investment accounts, where nobody is doing any matching contributions on your behalf, then you should seriously consider whether there is a better place for you to apply that cash than the shark-infested waters of the financial industry. If you are still going to risk it, then make sure you have a sound investment method that has a reasonable chance of success. This is what the rest of this chapter is about.
Mr. and Mrs. Fit Visit a Casino
Mr. and Mrs. Fit decide to take a vacation to Las Vegas and go see some shows. While they are there, they decide to visit a casino on the main strip. The casino happens to be hosting a huge poker event, and the Fits decide to participate. Mr. Fit read a book about Texas hold 'em a while ago, and Mrs. Fit has a natural talent with probabilities and numbers.
To enter the tournament, all they have to do is “buy in” for an initial $10,000. If they lose that, then they can buy more chips any time they like—they just have to pony up more cash. The casino takes a small fee (called a rake) from the pot for every hand played. They can also cash out their chips any time they like and get their remaining cash back.
__________
1 For those of you who don't remember, it stands for Faithful Annual Rebalancing of Common ETFs.
This is a huge tournament, and there are about 1,000 players at any one time. The average buy-in is about $10,000. Mr. and Mrs. Fit are just like 95% of the players—amateurs playing for fun, people on vacation looking for a thrill, people who have read some books on poker and think they can employ simple strategies to make some consistent, easy money. There are even some people who have taken their retirement savings and think they can consistently increase their chip stack by “playing the odds” and only betting when they have a “good” hand.
The other 5% of the players in the tournament are full-time professional poker players. They play day-in, day-out and are experts at reading the other players, managing their chip stack, and knowing when to bluff and when to fold. They can easily calculate probabilities in their heads. They can also do some pretty neat tricks with poker chips since they are so used to handling them, and they always know exactly how many chips they have in play and how many are in the pot.
Mr. and Mrs. Fit start playing conservatively and make only small bets. The casino gets paid because it takes its fee for each hand played. So the number of chips in play is slowly decreasing, but not really fast enough for anyone to notice. Mr. Fit notices that there is one player at his table that seems to be doing well, and a significant amount of chips seem to be accumulating in front of him. Other people at Mr. Fit's table are either quitting because they are out of chips, or buying in again if they have some cash remaining.
No matter what Mr. Fit does, it seems that the “good” player always folds when Mr. Fit has a good hand and makes a large bet, calls or raises when Mr. Fit bluffs, and makes a bet when he has poor cards. It's almost like the other player knows what Mr. Fit's cards are, even though he is very careful to keep them concealed when he looks at them.
Mrs. Fit is doing a little better because of her superior probability, statistics, and number skills. She is managing to bet only when the odds are in her favor and not risk a lot of money, even when she thinks her opponents have inferior hands. However, effective chip-stack management and playing the odds well can only slow down the gradual flow of Mrs. Fit's chips to the casino and the superior players in the tournament.
The Fits play for a few hours, lose 20% of their chips, and decide to cash out. Mr. Fit decides he needs to read some more books on good poker strategy before coming back and trying again next year—if only he had the right betting technique and playing strategy, he could clean up. What Mr. Fit doesn't realize is that it's impossible to make money in this environment unless you're either the casino taking the rake, or one of the small number of full-time professional players who consistently end up with the amateurs' chips before the casino takes them, again via its rake.
If this sounds familiar, it's because it is a great analogy for the way the financial industry works.
If You Do Want to Manage Your Own Investment Accounts, Don't Use FARCE
If you've read this far and you have followed all the rest of the advice in this book, then you're probably pretty financially savvy and also pretty adept at making a spreadsheet program work for you. You have an emergency fund in precious metals, you've put your savings into currencies or ETFs depending on the prevailing interest rate environment, and you have your retirement account funds “safe” in a money market account.
However, because your finances are now fit and you're making more cash every month than you spend, you have more savings than you're comfortable with simply rebalancing on a quarterly basis. Because upon scrutiny, if you did the homework I mention in the previous section, it probably hasn't worked out that well. You want a chance of a better return by taking more risk in a controlled manner. The rest of this chapter is the best way to go about doing this if you don't know any good money managers who will take your cash and manage it full-time for a reasonable fee. The good money managers are few and far between, and even if you can find one, they probably don't want the hassle of managing a load of relatively small accounts (small to them anyway). As a result, they often have high minimum-investment requirements or only take institutional funds from other financial firms.
If you have $100,000 but don't have the passion, inclination, time, or technical skills to manage it yourself, then drop me a line and I can refer you to someone who implements the techniques I describe in the rest of this chapter for a small annual asset management fee.
Whatever you do, though, please take heed of these warnings:
- Don't use FARCE to manage your investment accounts.
- Don't use dollar cost averaging to manage your investment accounts.
If you don't understand why, just take a closer look at Chapter 2 and Figure 5-1 later in this chapter.
“Trading” vs. “Investing”
If you buy mutual funds in your retirement account or other brokerage account and intend to hold on to them for the long term, you're investing, not trading, right? Wrong! You're just trading without any predefined exit strategy. There is only one reason to buy any financial instrument—because you want to sell it again later when the price has gone up. You can't buy groceries with Microsoft stock, so you must sell it first and turn it back into currency before you can spend the proceeds.
In my opinion, this means that everyone is a trader, not an investor. You're an investor if you lend a startup company money in exchange for a share of the company or a slice of future revenues. Then you don't technically need an exit strategy—in this case, meaning a method to limit risk rather than a way to cash out. Either the company will succeed and you'll get paid, or it will fail and you'll lose your initial investment.
Why am I making this seemingly irrelevant distinction? It's because there are six major components to a sound and complete trading strategy. So, for example, if you're a buy-and-hold investor, what you're really doing is trading with a system that only has one defined component: the entry signal. This would be like playing in a poker tournament and only using one rule: “I'll bet half of my chips if I have a pair of aces in the hole.” In other words, you bet only in one instance, letting the chips fall where they may. And you can bet the chips will fall into the hands of the house and other players. How long do you think you would last if that was the only rule you had?
Here are the six components of a complete trading approach:
- Market selection
- Instrument filter
- Setup conditions
- Entry signal
- Position sizing
- Exit strategy
You may be looking at this list and thinking, “Wow, that looks like a lot of work; I don't want to be a full-time investment manager.” Yes, it's true, good trading is not as simple as doing a quarterly rebalancing of your portfolio. But you have to ask yourself one question: “Am I happy with the performance of my investment account with the methods I've been using and the time and effort I've put in?” If the answer is a big, fat no, then ask yourself one more question: “Am I prepared to put in a bit of effort up front in order to understand and implement a much better method for managing my investment accounts? A method that will take a maximum of an hour per week to manage once it's completed, and will give me a better chance of a good risk-adjusted return for the rest of my investing life?”If the answers is no, then you don't need to read the rest of this chapter, and you should close your investment accounts and either put the cash into your emergency fund or take an emergency vacation to somewhere hot and sunny.
So, if you're still with me, I'll now deal briefly with each component of a complete trading method. Note that this is not a complete guide to building trading programs—it's meant to show you how little of a complete approach a buy-and-hold investor really has, and why the results most people achieve are so predictably terrible (or should that be terribly predictable?). Occasionally, I'll relate the component to your retirement account, since in most cases the major decisions about how you manage this type of investment account have already been made for you, or your choices are severely restricted.
Market Selection
Market selection determines what markets you will trade, and in turn defines the complete universe of instruments that you will consider as potentially tradable. For example, you could decide that your chosen market will be all equities listed on the New York Stock Exchange (NYSE), National Association of Securities Dealers Automated Quotation System (NASDAQ), and American Stock Exchange (AMEX). In your retirement account, market selection has probably been decided for you—it's simply the list of mutual funds your plan sponsor chose as investment options. By the way, this choice is normally limited to less than ten, simply so that you're more likely to make a choice—any choice. Studies have shown that if more options are provided, there is an increased probability that the participant (i.e., you) will choose the money market fund because the participant can't make a decision. This is the last place the company running your retirement plan wants you to put your cash, simply because their fees are the lowest in this fund. They want you to allocate to the other funds that have higher fees.
If you are going to trade your own capital, make sure it's in an environment that offers the biggest choice of markets and does not artificially constrain your tradable universe. Interactive Brokers is a good choice since they offer access to virtually all global electronic markets and their fees are very low.2
Instrument Filter
The instrument filter determines which instruments in the chosen markets are suitable for trading right now. Again, this decision has already been made for you in your retirement account. When choosing instruments to trade, there are four main factors to consider:
- Liquidity: How much volume is there in this instrument?
- Spread: What is the difference between the current buying (bid) and selling (offer) price?
- Fees: How much will you have to pay to enter and exit positions?
- Slippage: How different will your actual fulfillment price be from the price quoted when you enter your order?
Not all instruments are liquid enough to trade without large spread and slippage, and the fees may be high, which could all lead to significant implementation costs. These eat into your potential profit and amplify any losses. All an instrument filter does is take the complete universe of all instruments in a particular market and tells you exactly which ones should be considered for trading right now. This means that your liquid universe can change on a daily basis. You must have a method of reevaluating it periodically. It's not a “pick once and forget about it” type of thing, like the approach you used in your retirement account.
For example, if your chosen market is US ETFs listed on the NYSE, then you could have an instrument filter that says you will only include ETFs that are in the top tenth percentile measured by average daily volume (ADV) over the last 30 days. Most financial sites have a method of listing ETFs by various criteria, including volume, so it should not be a problem to find a ranked list that makes it simple to only choose instruments that are in the top 100, or top 10%.3
__________
2 I am not affiliated with Interactive Brokers, and am simply mentioning them as the most suitable choice I have currently found for the implementation of the methods contained in this book.
3 The ETF center on Yahoo Finance has a suitable ranking tool. Go to Investing, and then ETFs, choose View ETFs by Volume, and then rank by “Volume (3 mo Avg).”
Setup Conditions
Setup conditions are conditions that must be true for a trade to be considered. An example would be whether the volume today is sufficient for you to enter a position. Even though the chosen instruments in your market may have been liquid (had high volume) when you selected them, they may not have sufficient volume right now to consider a trade.
Again, if you're talking about your retirement account, then setup conditions have already been decided for you—any time is a good time to invest, and typically your plan will be set up with monthly contributions and an automatic allocation to your chosen funds. In a sound trading system, not all instruments in your liquid universe are good candidates for trading all the time—setup conditions tell you when you should be considering a trade in a particular instrument, and importantly, when you should not.
Entry Signal
Entry signal determines the specific conditions under which a buy order (or a sell order if you're shorting something) is generated. In your retirement account, the entry signal is, “Buy $X per month based on your predetermined allocation to the funds in your plan.” A valid entry signal should take into account the prevailing trend of the instrument being considered, and not just default to “buy every month”—as is done in your retirement account. If something has been dropping like a stone for the last six months, what makes you think it's a good idea to go ahead and buy it right now? Oh, that dollar cost averaging thing I covered in Chapter 2, right? Again, it's probably not a good idea to ignore the prevailing trend and go ahead and buy anyway?
Of all the concepts about the way markets work that are endlessly argued over by all the participants in the market, there are only two that you really need to understand:
- Momentum
- Inertia
In physics, momentum is defined as the tendency for a body that is in motion to stay in motion unless acted upon by an external force. Inertia is the tendency for a body that is at rest to stay at rest unless acted upon by an external force. In trading, momentum means that if the price of an instrument is moving in a particular direction, then it will often continue to move in that direction unless something changes. Inertia means that if the price of an instrument is going nowhere, then it will often continue to go nowhere unless something changes.
The practical implications of these concepts are pretty simple to understand:
- Buy things that are going up.
- Sell things that are going down.
- Don't buy or sell things that are going sideways.
Position Sizing
Position sizing is how much to buy or sell at any point in time, and depends on several factors that I will describe in detail later in this chapter. For most people in a retirement account, once again, this is predetermined—you will buy as much as possible based on your contribution and your employer's matching contribution. If you were playing in a poker tournament, then this position-sizing algorithm is basically “go all-in every time,” which means bet all your chips every time you play a hand. As the saying goes in poker, “Going all-in works every time … except once.”
Taking 100% risk by “investing” 100% of your cash is insane, especially when your exit strategy amounts to “Hold on for dear life, whatever happens.” A sound position-sizing algorithm limits the risk you will take on each position so that your maximum risk is kept within your tolerances. Did anyone ever talk to you about maximum expected drawdown when you chose your allocation percentages in your retirement account? No, I didn't think so.
Position sizing is the part of your trading system that determines two things:
- Your likely CAGR
- Your likely maximum drawdown
If either of these is important to you, then you better make sure you have a good understanding of the implications of any particular position-sizing method, rather than just buying as much as you can.
Exit Strategy
The exit strategy is the set of rules that determine when you will get out of a position. After position sizing, this component of a trading system is the most important and basically determines your expectation.
- If I said you could toss a fair coin and I would pay you $1 for heads and you would pay me $2 for tails, then the expectations would be:
- 50% chance of a $1 loss for me
- 50% chance of a $2 loss for you
My expectations would be:
(Probability of a Win * Win Amount) – (Probability of a Loss * Loss Amount)
Which works out to the following:
(0.5 * $2) – (0.5 * $1) = 1.0 – 0.5 = 0.5
This means that if I played the game with you, I would win 50 cents per turn on average—a positive expectation for me, and an equal and opposite negative expectation for you. Whether you're playing a positive or negative expectation game with your investment accounts depends primarily on your exit strategy. What's your exit strategy in your retirement account? Don't have one? You probably do, but it may be along the lines of “Cash out when I'm 60 years old.” Do such exit rules help you manage risk, keep losing positions small, let winners grow big, or create a positive expectation? Nope.
And if you're using periodic portfolio rebalancing, your exit strategy basically says: “Sell things that have gone up and buy things that have gone down with the proceeds.”
This is the opposite of what “good” trading looks like: “Let winners run, and cut losers short.”
Putting It All Together
I'm not going to pretend I can give you a complete trading method for all major instrument types that you can implement in a few hours a month using a spreadsheet and some delayed market data. What I can do is show you a much, much better way of managing your investment accounts than the typical “buy and hold with periodic rebalancing” that you're probably currently using.
I can also show you what your results would have looked like over the last, say, eight years using this method so you can compare them to the actual results you have achieved using traditional methods.
Let me make it clear again that it's risk-adjusted return depicted by the MAR ratio that's important—not simply CAGR. Figure 5-1 shows the baseline we're trying to improve upon. You may recognize this chart from Chapter 2. If your plan sponsor actually provided you with a chart that showed actual returns and drawdowns, rather than simply the total value of your account including your contributions, it would probably look a lot like the following chart over the last few years. The chart is of a simple annual rebalancing model of a diversified portfolio consisting of equities, bonds, and emerging markets. The ETFs in the portfolio are:
- SPY: SPDR S&P 500 ETF
- TLT: iShares Barclays 20+ Year Treasury Bond
- EFA: iShares Trust MSCI EAFE Index (Europe, Australasia, and Far East equities)
The account starts with $100,000 and has a 2% annual fee applied to it.
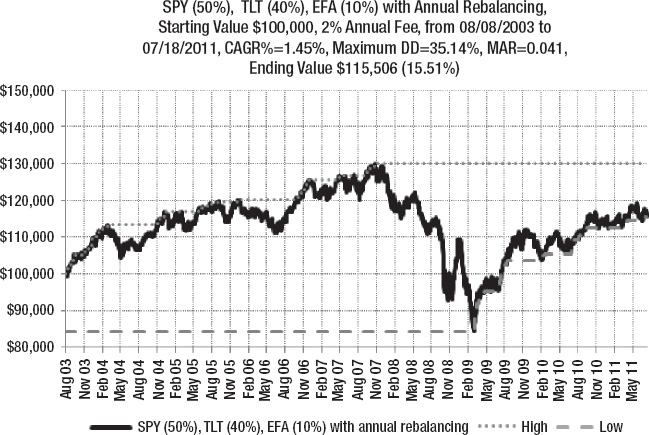
Figure 5-1. Annual rebalancing of a diversified portfolio, August 2003 to July 2011
Not very impressive, is it? I don't need to go into how pathetic these results are, because I covered that in Chapter 2. How about Figure 5-2—does this look a little more like it?
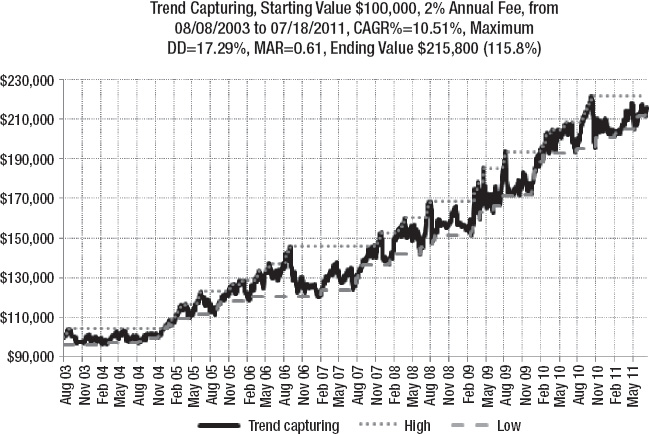
Figure 5-2. Trend capturing applied to a diversified portfolio, August 2003 to July 2011, with 2% annual fee
I've included the same 2% annual fee so you can directly compare it to the previous chart. I would call these results acceptable for an approach that could be managed on your own using a diversified portfolio of ETFs (including some inverse ETFs) and a spreadsheet with delayed market data. The approach attempts to capture trends in price as, and when, they occur, and does not use any kind of periodic rebalancing.
Figure 5-3 shows the same method with no annual fee, which would represent the kind of results that could be achieved if you do it yourself. If the results with the 2% annual fee look good to you, and you just can't be bothered to do the hard work to manage an account yourself for the kind of improvement that's possible, then just get in touch with me and I will refer you to a financial advisor I know. This financial advisor is implementing a version of the method I describe in detail later in this chapter, and currently takes accounts of at least $100,000 but only charges a small annual fee based on total assets.4
________
4 I currently receive no compensation for such referrals.
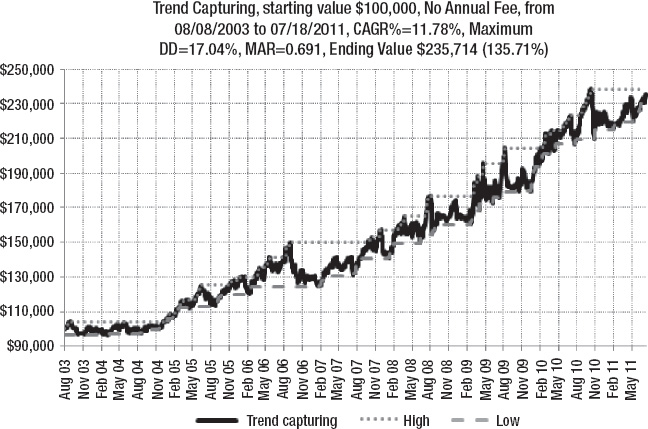
Figure 5-3. Trend capturing applied to a diversified portfolio, August 2003 to July 2011, with no annual fee
As you can see from the last chart, doing it yourself (assuming you don't mess up, of course), your account balance would be just about $20,000 bigger at the end of the period.
A Simplified Trend-Capturing Method
Now that I've gotten your interest with what I consider to be good results, it's time to give you a few warnings:
- Achieving these results requires accurate and consistent implementation of the trading method. No skipping a trade you don't like, no sizing a trade twice as big because it's going to be a huge winner, and no taking a six-month vacation and forgetting to look at your account. If you can't accurately and consistently implement the method, then don't bother—you'll end up worse off than using FARCE.
- The methods presented here require more time and effort than most normal people are willing to spend managing their investment accounts.
- There is no guarantee that future results will look exactly like the past results. However, there is a much better chance of future results being acceptable compared to FARCE in my opinion, so it's worth the risk.
The method I describe next is a simplified version of what I and other professional traders use that is easier to manage while still providing good results. The results for this version are shown in Figure 5-4.
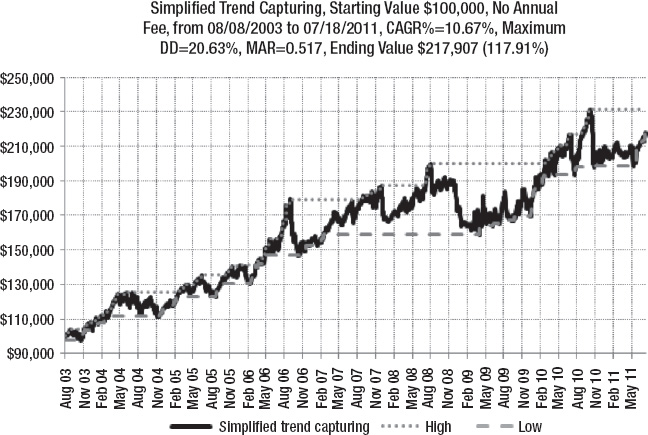
Figure 5-4. Simplified trend capturing applied to a diversified portfolio, August 2003 to July 2011, with no annual fee
As you can see, the CAGR is lower and the max DD is higher, but that is the price one pays for using a method that is simple to implement and doesn't require full-time babysitting.
So, with that out of the way, let me tell you the exact rules you can use to implement the simplified trend-capturing method yourself.
Market Selection
Plan to buy US ETFs listed on the NYSE and AMEX.
Most people are familiar with equities (stocks), but investing in individual companies has some drawbacks—the price can be very volatile, and if the company gets into trouble, the shareholders are the last in line to get any cash back. Anyone remember Enron or Worldcom? In fact, of the 12 companies on the original Dow Jones Industrial Average, only 1 still exists today (General Electric).
For this reason, it's better to invest in ETFs that represent ownership of a collection of underlying instruments rather than a single company, so you get “built-in” diversification. Another advantage is that ETFs trade just like equities (they are priced in real time and trade on regular exchanges), so they are easy to buy or sell in any regular brokerage account.
Instrument Filter
Rank the top 50 ETFs by dollar volume traded and choose a noncorrelated list from this set that includes some inverse funds. Noncorrelated in this case means that the holdings of each ETF should not have much overlap and should not be based on a similar index, industry, or sector.
Inverse funds are ETFs that are designed to move in the opposite direction to some other fund or index so they can be used to simulate going short in an account where selling short is not allowed.5 This means that you can benefit from uptrends as well as downtrends, rather than only being able to make money when things are going up in price.
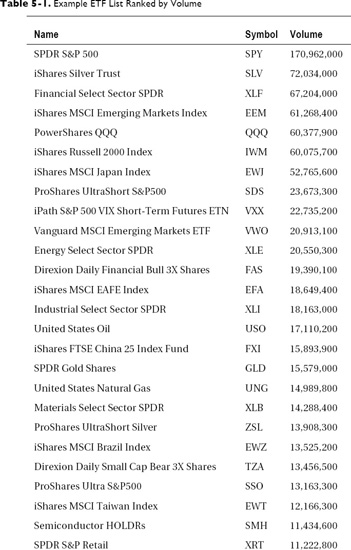
There are many web sites that can list and rank ETFs quickly and easily. I like to use the ETF Center in Yahoo! Finance, but any source that can be easily loaded into your spreadsheet program so you can sort it will work. Table 5.1 shows a list of ETFs ranked by descending average daily volume. In the table, the ETFs have been ranked in descending order by three-month ADV.
________
5 Going short, or “shorting,” is a trading technique in which you borrow securities from your broker, sell them, and receive the proceeds. Then you have to buy back the securities at some point in the future in order to return them to your broker. In this way, you can benefit from a drop in price if you are able to buy the securities back for less than you received when you sold them. Shorting of securities is not allowed in US retirement accounts.
The next step is to go through the list and decide exactly which ETFs will be included in your “tradable universe.” Go down the list and put a check mark by any noncorrelated ETFs—ETFs that do not represent the same main category as any already on your list. Once you have at least 20 ETFs on your list, it is fine to stop. This process should be repeated at least yearly in order to make sure you are always trading the most liquid ETFs that currently exist.
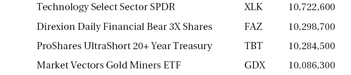
After looking at about the top 60 ETFs, I came up with a list of the 20 I'd invest in (Table 5-2).
All I did was start at the top and skip any ETFs where there was considerable overlap with one already on the list. For example, USO, United States Oil, was eliminated since XLE, Energy Select Sector SPDR, was already on the list. And GDX, Market Vectors Gold Miners ETF, was not included because GLD, SPDR Gold Trust, was. Don't fret too much about whether something overlaps or not—look at the fund category and use common sense. It's better to skip something that isn't correlated than accidentally include something that is. There are hundreds of liquid ETFs to choose from, and you only need a selection of 20. Include some inverse funds, too, so you can take advantage of drops in the market. It's ideal if all of the funds you choose have inverse funds to pair with; however, everything will still be fine if approximately half of the funds you choose have an inverse.
This means that if you end up with 20 main funds, 10 of which have an inverse, then your complete portfolio list will be 30 funds in total. Also, it's important to point out that you will never have a position in a fund and its inverse at the same time, so the maximum number of simultaneous positions you can ever have is the total number of main funds. The only real criteria are that the fund be liquid (so you can buy and sell easily without affecting the price) and have little overlap with what's already on your list.
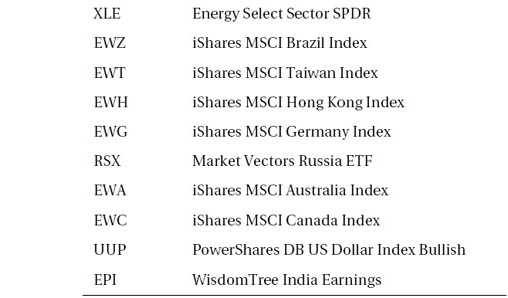
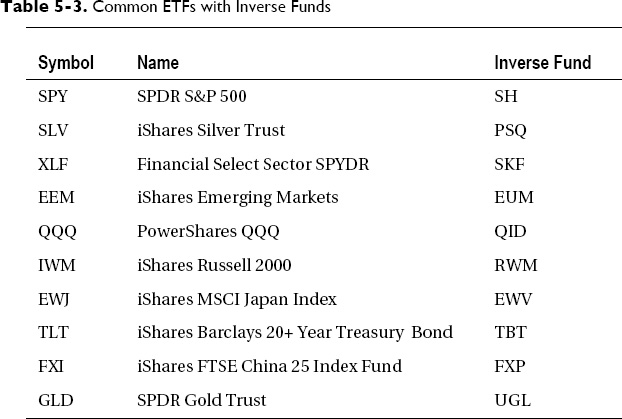
The next step is to identify whether there is an inverse fund for each of the ETFs so you can potentially have a position in a particular category depending on whether it's currently going up or down. For the 20 ETFs on the list, Table 5-3 shows those that have inverse funds.
I quickly found the inverse ETFs by doing a web search for “Inverse ETFs.” If you are really serious about investing, then you could also do a correlation study on the historical data to make sure that the inverse ETFs really do what they are supposed to—that is, move in the opposite direction to their specified “twin.” Since we are only concerned about trend-capturing moves in these ETFs, it doesn't really matter if a particular fund is an exact inverse correlation, as long as it has the potential to go up when the twin fund is going down.
Note that some inverse funds are designed to have more than a 100% negative correlation—they are designed to move two (or more times) in the opposite direction of their twin fund. For example, in a 3-times fund, a 1% down move in the noninverse fund should result in a 3% up move in the inverse fund.
These are typically called ultra-short funds to indicate that they don't have just a one-to-one negative correlation. As you will see when we get to the position-sizing section, investing in ultra-short ETFs is not a problem as long as you decrease your position size to take account of the increased volatility of these funds. In fact, if you can take the desired amount of risk but have a smaller position (based on the actual value of the shares), then an ultra-short fund is more capital efficient than a regular ETF. It takes up less cash to implement the same amount of risk.
Again, a check should be done on at least an annual basis to see if any new inverse funds have been created that match the other funds on the list so they can be included in your portfolio.
Setup Conditions
Once you have selected the ETFs you want to buy and sell, there are a couple of conditions that must be met before you actually buy. These are:
- You have some cash left.
- You do not already have 20 open positions.
The first criterion is pretty obvious: if you have already used up all available cash in your investment account, then you can't put any more positions on until something is sold to free up new investment capital.
The second criterion is there to limit the total amount of risk you are willing to take, and depends on two things that will be covered in the “Position Sizing” section, which follows:
- How much of your account are you prepared to lose in total?
- How much are you prepared to lose on each individual position?
Remember that return and risk go hand in hand, so the more you are prepared to lose, the better chance of a bigger return you will have. Obviously the opposite is also true—if you aim for higher returns, then you will experience bigger drawdowns in your account. You should always concentrate on managing the risk and controlling losses first—the return will take care of itself if you accurately implement your trading method.
Entry Signal
Based on the concept of momentum mentioned earlier in the chapter, what you want to do is buy things that are going up and attempt to capture part of a trend when one develops. Therefore, our entry signal is simply a specific definition of what “going up” means. Here is that definition:
An increase in price over the last ten days is greater than three times the ATR(10)
As you can see from the definition, the entry signal has two components:
- How volatile the recent price range has been (represented by the ATR)
- How much the price has changed from close to close over the same period
ATR is the average true range, which will be explained in the next few paragraphs, and the number in parentheses is the number of days. If the price move is greater than three times the ATR(10), then the move is “significant.” The price move over the same period is simply the difference between the closing price yesterday and ten days ago.
Whether a price move can be considered a significant up move or not depends on how volatile the price of the ETF really is. For example, let's assume we have an ETF that moves up (or down) by $1 per day on average, over the last ten days. A price move of $2.50 over the last ten days could not be considered significant; it only represents a total move of 50% of the daily range (50 cents) per day. Conversely, if price has moved up by $3 or more over the same period, then it could be considered significant, since this represents a move that is 60% of the total daily range in one direction.
It's important to think only in ratios of some measure of volatility, rather than absolute price moves. This means that any definition of significant price move must include an estimation of how volatile the daily price has been recently. This is when the ATR, developed by J. Welles Wilder, is useful.
With stocks, the range is simply the high price minus the low price for the day. But this calculation does not take into account the difference between the previous day's closing price and today's opening price. The true range for the day takes this into account by using the following formula:
True Range = The Maximum of (Daily Range, High Distance, Low Distance)
This means that you will use the highest value out of the three choices (daily range, high distance, and low distance). Here's what those terms mean:
- Daily range: Today's high minus today's low
- High distance: Absolute value of today's high minus the previous day's close
- Low distance: Absolute value of today's low minus the previous day's close
The ATR is a simple arithmetic average (mean) of the true range over some defined number of days. In our case, we will use ten days. Table 5-4 shows the ATR calculations for the ETF SPY over the last ten days. In this case, the ATR(10) is 1.52, which means that on average, the price of SPY went up (or down) by $1.52 per day over the last ten days.
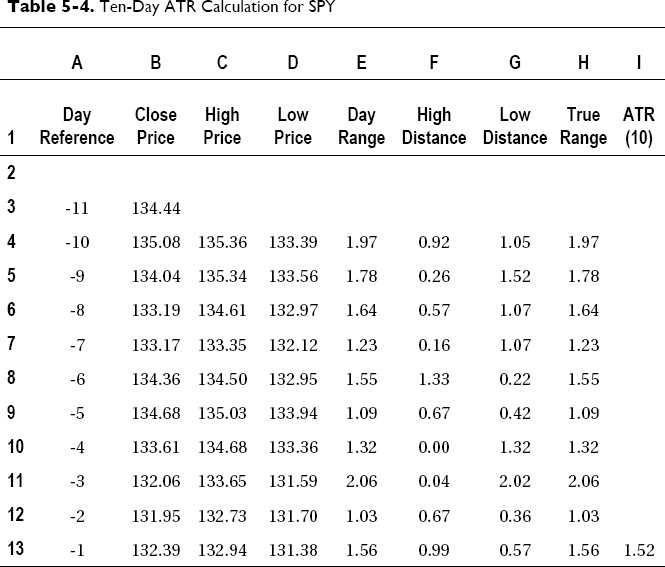
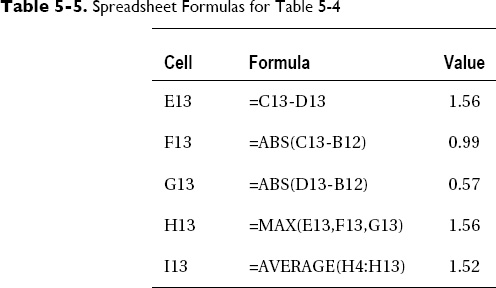
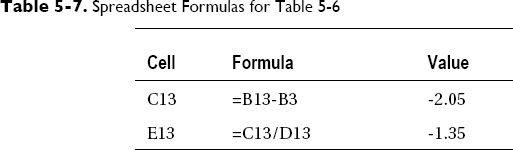
The spreadsheet formulas for the calculations in Table 5-4 are shown in Table 5-5.
Therefore, based on our rule that three times the ten-day ATR is a significant price move, you would enter a position in SPY if it moved up by 3 * $1.52, which is $4.56 over ten days.
Adding an additional column to the spreadsheet, you can easily calculate the price move (close to close) over the last ten days and see if it is more than three times the ATR(10) for the same period, as shown in Table 5-6.
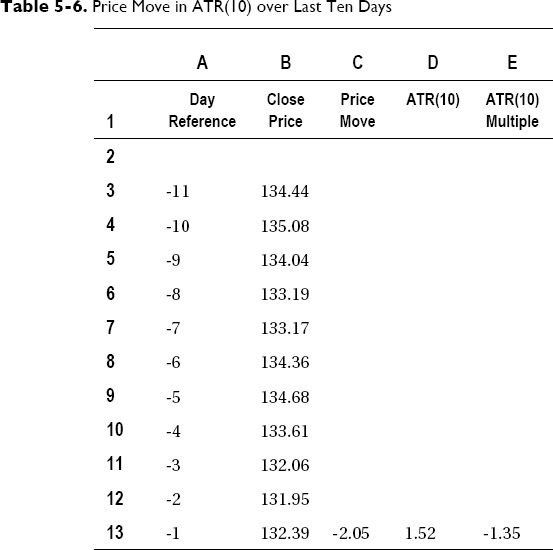
Again, the spreadsheet formulas for Table 5-6 are shown in Table 5-7.
As you can see from the ATR(10) Multiple column in Table 5-6, the price has actually gone down by 1.35 times the ATR(10) over the ten-day period. If the price had gone up by a multiple of 3 or more of the ATR(10), then that would be a signal to enter a position in this ETF as long as you didn't already have a position in it or in the inverse fund. Remember, never take a position in an ETF if you already have a position in its mate.
In order to check for entry signals in all the ETFs on your list, it's a good idea to build a spreadsheet that automatically grabs the historical price data, calculates the ATR(10), and works out whether you have any entry signals to take.
The product I use to get the historical data into Excel is called XLQ, from a company called QMatix.6 This means that your spreadsheet will automatically update each time it is run, and you won't have to manually type in all the historical prices. Manual typing is obviously impractical when you have a list of 20 ETFs plus the inverse ETFs to update—unless you're a data entry addict.
Position Sizing
Once your setup conditions are fulfilled and you have a valid entry signal on one (or more) of the ETFs on your list, it's time to actually buy some shares. The question is, “How many shares do you buy?” Here is the formula to use:
2% of account net liquidation value (NLV) based on a 10 times ATR(50) risk per share.
The risk per share in the formula means the difference between the current price and the price at which you would exit if this were not a winning trade. How to determine this exit price is covered in the “Exit Strategy” section.
The purpose of your position-sizing calculation is to tell you exactly how many shares to buy based on the following pieces of information:
- The current NLV of your account
- The current ATR(50) of the ETF
- The percentage of your account you are prepared to risk on each position
__________
6 The QMatix web site is http://qmatix.com. There is a fully functional free trial of XLQ that can be downloaded from the web site.
The NLV of your account is a simple calculation that all brokerage statements include. You can either use the value from your last statement, or you can use the online access to your account to get an up-to-date value. The NLV is simply the current value of all the positions in your account, including any cash positions, accrued interest, dividends, and so on. It represents what your account would be worth (in base currency) if everything were liquidated at current prices.
In the same way that you calculated the 10-day ATR for the entry signal, you want to use a slightly longer timeframe calculation (50 days in this case) as a proxy for what volatility may be when you are in the position. Volatility may go up or down after you've put a position on, and our exit strategy will react to those changes, but for right now, the most recent volatility is the best estimate you have for what the price range will be like for this particular ETF.
The risk per trade in this case is going to be 2% of your account. Note that this does not mean you will enter a position that costs 2% of your NLV. It means that if this position is exited at your stop-loss point (which is covered in the “Exit Strategy” section), then you will suffer a 2% loss of your current account NLV.
The sizing calculation is in two steps. First we determine how much the risk per share will be
Risk Per Share = 10 * the 50-Day ATR
Let's say that in this case the 50-day ATR is the same as the 10-day ATR in the entry signal example (that's 1.52). This means the risk per share calculation would be as follows:
Risk Per Share = 10 * $1.52 = $15.20
Using the SPY example, this means we would be risking $15.20 per share for this position. Note that if 10 times the ATR(50) is bigger than the current price of the ETF, then you cannot take a position in this ETF. The stop price (based on the risk per share) would be negative. This particular trade should be skipped under these circumstances, and you should just wait for the next entry signal.
Next, you need to work out how much you are going to risk on this trade using our risk per trade of 2%. Let's say your current NLV is $100,000.
Risk on This Trade = Risk-per-Trade Percentage * NLV
Risk on This Trade = 2% * $100,000 = $2,000
We know how much we will be risking per share ($15.20) and we know what the total risk for this trade will be ($2,000), so the number of shares to buy is simply the following:
Shares to Buy = Total Risk / Risk per Share
Shares to Buy = $2000 / $15.20 = 131 (rounded down)
Note that you can't buy fractional shares in ETFs as you can with a mutual fund, so you need to round the number of shares down to an integer value (131 in this case). If you're the kind of investor that likes round numbers, then you can round down to the nearest 10 or 100 shares, but since ETFs are very liquid, it should not be a problem buying and selling odd lots.
That's it—the calculation is identical in all cases and is designed to risk a fixed percentage of your current NLV on each trade. In this particular example, if the current price of SPY were $132.39, then buying 131 shares would represent a position with a total value of $17,343 (131 shares at $132.39 per share). Note that this has two implications:
- You would only be able to have a maximum of five positions in your $100,000 account if each position “cost” over $17,000.
- The amount of risk you are taking on each position ($2,000 in this example) is not the same as the value or cost of the position since you will exit before the price goes to zero (see the “Exit Strategy” section).
Since the cost of each position is determined by how volatile an ETF is compared to its current price, ETFs that are more volatile (relative to their price) actually require a smaller position to take the same amount of risk. This means that “ultra,” or leveraged, ETFs are actually more capital efficient than nonleveraged ones, and should be preferred if you have entry signals in more than one ETF but don't have enough capital to put all the positions on.
Capital efficiency in this case is determined by the following formula:
10-Day ATR / Closing Price As a Percentage
So, for SPY in our example, this would be:
1.52 / 132.39 * 100 = 1.15% (rounded to two decimal places)
Typically, capital efficiency is between 1% and 3%, with higher capital efficiency being better since you will be able to put on more positions with the same amount of capital and get better diversification in your portfolio. It's a good idea to do this calculation in your spreadsheet program and then rank the ETFs by descending capital efficiency percent so you can see which ones are better.
Why Only 2% Risk per Trade?
You may be thinking that risking only 2% of your account on any single position doesn't sound like much, especially when you're only going to have a maximum of 20 positions (assuming you don't run out of cash to implement them). But let me show you a simple chart (Figure 5-5) that I show to all my trading clients at some point during trading system development.
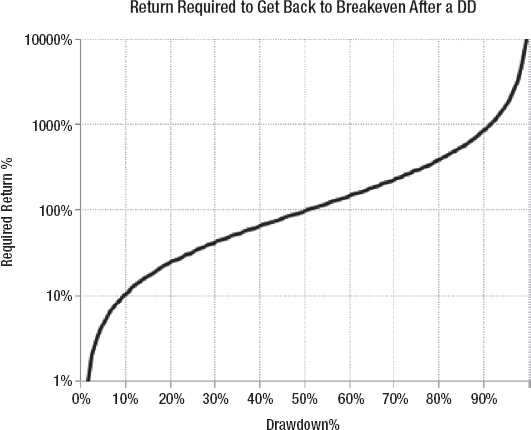
Figure 5-5. Return required to get back to breakeven after a drawdown
As you can see from the figure, the graph is approximately linear up to about 11%. This means that if you lose 11% of your account, you need to make approximately 11% return on what you have left to get back to where you started. The real action is further to the right of the chart. If you lose 50% of your account, then you have to make a 100% return (i.e., double) the cash you have left just to get back to where you started. The ratio of return to drawdown has gone from 1:1 to 2:1.
Go beyond that and you're basically doomed—if you lose, say, 75% of your account then you need to quadruple your remaining cash just to get back to break-even. This can take years even with a sound trading method that makes a good risk-adjusted return, so it's essential that you do the following:
Stay as close to the left side of this chart as possible.
If you're going to put on 20 positions maximum, and risk 2% per position, then it means you are capping your maximum theoretical loss at about 40% of your account. For this to happen, all 20 of your positions would have to be exited as losers simultaneously. If you have included some inverse funds in your portfolio, then the chances of every single position being a loser simultaneously are very small. You are “hedged” against suffering your maximum loss.
Note that even this worse-case scenario of a 40% loss is still better than the maximum drawdown you would have encountered over the last ten years if you have been using a “buy and hold with no risk management” strategy.
In my experience with this kind of trading method, risking 2% per trade with a maximum of 20 positions is enough risk to have a chance of a reasonable return (say 15%), but also keeps drawdowns to a level that most people can tolerate and trade through (say 25%).
If you can tolerate bigger drawdowns and want a chance at bigger returns, then you can increase the risk per trade to 3%. If a 25% drawdown sounds like too much to you, then you should reduce the risk per trade to 1%, but understand that you are reducing your chances of making a 15% CAGR.
Exit Strategy
Once you are in a position, the only thing you have to worry about is when to get out. For buy-and-hold, the answer is never. For those who do the annual rebalancing ritual, the answer is “a bit every year, but only if it's gone up.”
With a trend-capturing method, the time to get out is when it's likely that the trend you were trying to capture has ended, and has possibly reversed. The simplest way to determine this is with a trailing stop. Here's the rule:
10 * ATR(50) Trailing Stop Hit
The initial stop on your position was calculated in the “Position Sizing” section as a ten times the ATR(50) stop. This is the maximum risk you will ever take on the position, and if price ever goes down to this point, you will exit. But what about a position that moves in your favor? How do you ensure you capture some of that profit before the market tumbles?
The answer is with a trailing stop. Rather than the exit price staying the same, as the price of the ETF goes up, so does the stop price—but it “trails” behind it. In the example SPY position earlier we calculated that we were taking $15.20 risk per share. This means that our initial stop would be our entry price minus $15.20. Therefore, if the entry price were $132.39, then the formula for the initial stop (exit price) would be
Initial Stop Price = Entry Price – Initial Risk per Share
Initial Stop Price = $132.39 – $15.20 = $117.19
If the price of SPY closed below $117.19, you would exit the position the next day and take the loss. If the SPY closing price is higher than your entry price, then you would recalculate the stop as follows:
Trailing Stop Price = Closing Price – Current Risk per Share
Current Risk per Share = 10 * Current ATR(50)
Therefore, if the closing price were, say, $140, and the current ATR(50) were now 1.60, then the stop price would be calculated as follows:
Trailing Stop Price = $140 – (10 * $1.60) = $124
This would mean you would move up your stop (exit) price to $124 and exit if SPY closed below this value. Whether you actually enter the stop prices into your brokerage account and allow them to be triggered intraday by your broker's trading platform is up to you. If you think you will forget to check your stops on all your positions periodically, then it's a good idea to put stops in with your broker. If you put all this into a spreadsheet and simply run it once a week to check your stops, then you can probably implement your exits manually without any issues.
A good compromise would be to put your initial stop into your brokerage account (as a good-until-cancelled [GTC] stop), but then manage your trailing stops on a spreadsheet and exit if any of them are hit. In this way you are making sure it is unlikely that you will suffer more than your maximum loss on any trade, but you don't have to keep adjusting lots of stops in your brokerage account.
Note that in all cases getting out close to your stop price is not guaranteed, but on average, your losing trades should be less than your maximum loss, because if they move in your favor at all after you get into the position, your stop will have trailed up from where it started. If you're concerned about not being able to get out close to your stop price, just think back to the situation you were in when you had no stops at all, were taking 100% risk on each position, and probably had your account fully invested all the time!
The occasional exit-beyond-your-stop price is insignificant compared to the way you were investing before.
That's it! The only exit strategy you really need. An ATR-based trailing stop will adapt to changes in volatility, move up to protect profits and reduce risk, and should never widen to go beyond your initial risk.
If you use XLQ and Excel to get historical price information for each of the ETFs in your portfolio, it's relatively simple to plot a chart with your trailing stop right on it so you can see when you should exit. An example of this is shown in Figure 5-6.
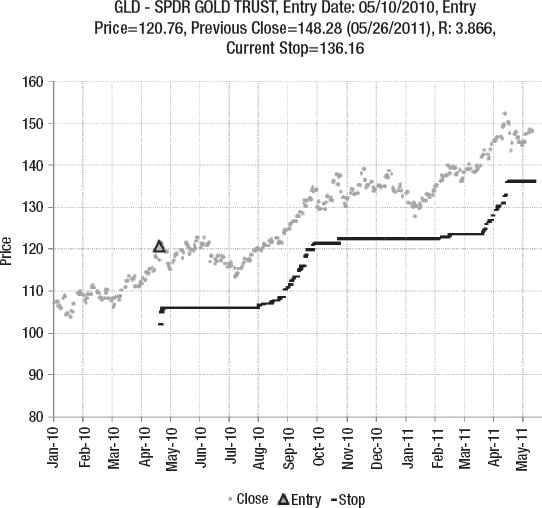
Figure 5-6. Example GLD position with trailing stop
Mr. and Mrs. Fit Become Part-Time Portfolio Managers
Mr. and Mrs. Fit decide to take control of their own investment performance and portfolio management. Mr. Fit now realizes that simply setting an allocation percentage in his retirement account and passively rebalancing each year provides very poor performance and takes large risks with his retirement cash. He also knows that paying a financial company an annual fee for implementing a similar procedure for him makes no sense—he'll still make a poor return but also be out the fee.
Mr. Fit makes a decision to find the time to actively manage his own investment accounts and puts a plan in place to acquire the required skills that he currently lacks in order to do this effectively. Mr. Fit has a personal computer and a spreadsheet program, but he is nowhere near an expert user, so he takes some online courses to significantly improve his spreadsheet formula skills. His aim is to become an “expert” user like Mrs. Fit.
Once he is much more competent at spreadsheet formulas, Mr. Fit downloads the free trial of XLQ so he can easily get historical price data into his spreadsheet. He spends a few weeks learning about all the new formulas he has access to via XLQ and builds some charts and tables that give him lots of information about various financial instruments.
Next, Mr. Fit uses a financial web site that has ETF information to construct his initial portfolio of tradable ETFs. He plugs each one into his spreadsheet and writes formulas that calculate the capital efficiency, the ten-day price move, and the ten-day ATR. He can use this information to signal when he should consider entering a new position. He looks at the list each evening to see how often he gets a new entry signal.
While he is waiting for his first entry signal, Mr. Fit programs the position-sizing calculation into his sheet. He inputs his account value and his risk per trade, and the spreadsheet formulas he wrote calculates how many shares he would buy and sell. He ranks the ETFs in the sheet in descending order by capital efficiency using the spreadsheet sort function so that he can take signals in ETFs that use up the least amount of capital first.
When Mr. Fit gets a signal to enter a position, the sheet tells him exactly how many shares to buy. He enters the order into his brokerage account and then puts the fill price into his sheet so he can calculate profit and loss for this position and track where his stop should be. He has already programmed a chart on his sheet that tracks the trailing stop, so he knows exactly where he will exit the trade before he even puts the position on. Since he is unable to monitor his account on a daily basis, Mr. Fit enters a GTC sell market order into his brokerage account so the position will be exited if it drops to his initial stop price (as calculated by the sheet).
Each weekend Mr. Fit updates his spreadsheet, checks for new entry signals, and recalculates his stops. If the stop price has changed for any of his existing positions, he amends the price on his GTC order. If any of his positions have been stopped out, he records that on his sheet so that he knows he can take another entry signal in that particular ETF now that he no longer has a position in it. Mr. Fit typically changes the color of the sheet tab to indicate whether he has a position in each of the ETFs in his portfolio. Mr. Fit has shown everything he has done to Mrs. Fit so she could manage their account properly if he was unable to do it for a period of time. Mrs. Fit also has the broker account password and understands how to manage stops and put on positions in the online access to the brokerage account.
As Mr. Fit gets more competent at writing spreadsheet formulas, he enhances his sheet to include lots of useful statistics about his account performance. He calculates the CAGR, the maximum drawdown, and exactly how much profit or loss each position is making right now. He has also designed a sheet that shows similar statistics for his “old” method of periodic rebalancing so he can compare how his account is performing, on a risk-adjusted basis of course, with the “old” way of doing things. None of this information is included on the standard account statement he receives, or in his online access to the account, so if he did not know how to do the calculations himself, he would have no real idea how well his account was performing on a risk-adjusted basis.
Mr. Fit is interested in finance now anyway, and he finds that he enjoys looking at his spreadsheet almost daily even though it only really requires 30 minutes of his time every weekend to manage his accounts. He decides that in the future he will implement a version of this method in a regular brokerage account where he has access to many more financial instruments and order types. Mr. Fit starts to learn about different instrument types like equities, bonds, and options.
Although in the short-term his investment results can be volatile, Mr. Fit sees that, over a reasonable period of time—say, five years—the MAR ratio of his active management trend-capturing method is significantly better than the FARCE method he was doing before. Mr. and Mrs. Fit laugh to themselves and can't believe that they had used such an inferior method for so long, and wonder why it took them so long to switch to something that actually had a good chance of success. The Fits know that success is not guaranteed with the method they use now, but they are confident that their chances of success are significantly improved as long as they accurately and consistently implement the method.
In Summary
In this chapter I've warned you that managing your own investment accounts is probably not a good idea for most people, but if you're going to do it anyway, then use the simplified trend-capturing approach I outline to maximize the chances of a reasonable risk-adjusted return compared to FARCE.
If you don't have the time or inclination to do this yourself consistently, then contact me for a referral to someone who can and will manage your money for a reasonable fee using similar (but more sophisticated) methods to those outlined here.
As mentioned, a complete trading approach has all six of the following components defined in detail:
- Market selection
- Instrument filter
- Setup conditions
- Entry signal
- Position sizing
- Exit strategy
If your approach does not include specific rules for all six components, then your results will be random (at best) and have a significantly negative expectation (at worst). Don't be one of the 95% of the poker players sending all their chips across the table to the professionals while the casino is taking their cut on every hand.
The bottom line is that it's well worth a 2% annual fee to put your money with a competent financial advisor as long as they are not using a traditional rebalancing approach. Unfortunately I only know of one financial advisor in the United States who is actually offering this kind of managed account solution for an annual asset management fee.