
We make a moving band of images like a slideshow. This differs from the typical slideshow by showing the images as a continuously moving strip with the images placed end to end.
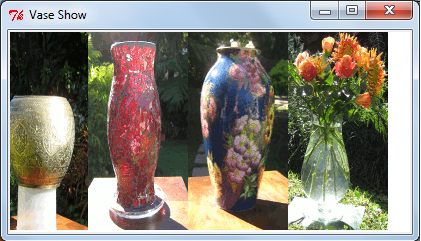
We need a set of four images, all of the same size. If they were not the same size, the program would still work but would not look well designed. The images provided for this code are: brass_vase.gif, red_vase.gif, blue_vase.gif, and glass_vase.gif and are 200 pixels high and 100 wide.
Execute the program shown as before.
# passing_show_1.py
# >>>>>>>>>>>>>>>>>>>>>>
from Tkinter import *
import math
import time
root = Tk()
root.title("Vase Show")
cw = 400 # canvas width
ch = 200 # canvas height
chart_1 = Canvas(root, width=cw, height=ch, background="white")
chart_1.grid(row=0, column=0)
cycle_period = 100 # time between new positions of the ball (milliseconds).
#=======================================================================
posn_x1 = 0
posn_x2 = 100
posn_x3 = 200
posn_x4 = 300
posn_y = 00
im_brass = PhotoImage(file = "/constr/pics1/brass_vase.gif")
im_red = PhotoImage(file = "/constr/pics1/red_vase.gif")
im_blue = PhotoImage(file = "/constr/pics1/blue_vase.gif")
im_glass = PhotoImage(file = "/constr/pics1/glass_vase.gif")
#=======================================================================
def animdelay():
chart_1.update() # This refreshes the drawing on the canvas.
chart_1.after(cycle_period) # This makes execution pause for 100 milliseconds.
chart_1.delete(ALL) # This erases *almost* everything on the canvas.
for j in range(0,400): # Number of steps to be taken - arbitrary.
posn_x1 -= 1
posn_x2 -= 1
posn_x3 -= 1
posn_x4 -= 1
chart_1.create_image(posn_x1,posn_y,anchor=NW, image=im_brass)
chart_1.create_image(posn_x2,posn_y,anchor=NW, image=im_red)
chart_1.create_image(posn_x3,posn_y,anchor=NW, image=im_blue)
chart_1.create_image(posn_x4,posn_y,anchor=NW, image=im_glass)
animdelay()
root.mainloop()
# >>>>>>>>>>>>>>>>>>>>>>>>>>>>>>>>>>>>>>>>>>>>>>>>>>>>>>>
..................Content has been hidden....................
You can't read the all page of ebook, please click here login for view all page.