We shall examine how Inkscape encodes drawings so that we may interpret them for use in Python. What we will do is:
- Draw some simple objects in Inkscape and save them somewhere as "Plain SVG" format files.
- Then we open the files in a text editor and inspect the contents so that we can recognize the lines we are interested in.
- Finally we write code that will convert the SVG lines of interest into Tkinter lists which we can use directly in our Python programs.
The first thing we need to do now is acquire and install a copy of Inkscape onto our computer. We will find this at www.inkscape.org/download/ where there are versions for Linux and Microsoft Windows.
The on-line documentation and tutorials for Inkscape are excellent. However, we want to use the minimum amount of Inkscape so this recipe is just that a few pointers to get the minimum task done.
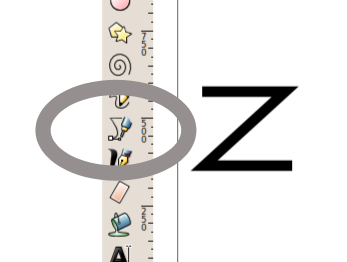
The only tool we need to use in Inkscape is the line-drawing pen as shown in the following screenshot. We drew a "Z" shape with this tool and saved the file as z_inkscape.svg.
The code produced, displayed in a text editor is shown after the screenshot:

<?xml version="1.0" encoding="UTF-8" standalone="no"?>
<!-- Created with Inkscape (http://www.inkscape.org/) -->
<svg
xmlns:svg="http://www.w3.org/2000/svg"
xmlns="http://www.w3.org/2000/svg"
version="1.1"
width="744.09448"
height="1052.3622"
id="svg3741">
<defs
id="defs3743" />
<g
id="layer1">
<path
d="m 122.85714,89.50504 280,0 -280,45.71429 271.42857,0 "
id="path3751"
style="fill:none;stroke:#000000;stroke-width:1px;stroke-linecap:butt;stroke-linejoin:miter;stroke-opacity:1" />
</g>
</svg>
Most of the preceding code is of no interest to us. It is the XML code that a web browser interprets in order to display a web page. Embedded within it, however, are SVG paths which we somehow want to transfer to Python so Tkinter can display it as a drawn shape.
The portion we are interested in is the paragraph starting with<path as this is the SVG format description of the "Z" shape that was drawn with the pen tool. This is the section of code:
<path
d="m 122.85714,89.50504 280,0 -280,45.71429 271.42857,0 " id="path3751"
style="fill:none;stroke:#000000;stroke-width:1px;stroke- linecap:butt;stroke-linejoin:miter;stroke-opacity:1" />
This is the whole SVG description of the 'Zorro' sign and the following line, has been slightly simplified, by removing the decimal fractions, to improve readability:
d="m 122, 89 280,0 -280,45 271,0"
This line is the equivalent of a group of Tkinter instructions that could be written:
x0 = 122
y0 = 89
canvas.create_line(x0,y0, x0+280,y0+0, x0-280,y0+45, x0+271,y0,+0 )
The 'm' symbol is the SVG instruction "move-to" where the number of pixels moved are increments added to the coordinates of the previous point in the line except for the first point 122,89 which tells the pen where to begin.
We do not want to become SVG experts. We only want to know enough to be able to recognize graphic data which we can use in Python. In this spirit, a summary of a few of the most common SVG directives is given here.
m x,yis the "move-to" instruction which moves the pen to the pointx,ywithout drawing a line.m x0,y0 x1,y1 x2,y2will draw a line fromx0,y0tox1,y1and then another segment fromx1,y1tox2, y2. Note that the SVG interpreter only interprets the first pointx0,y0as a "move-to" but interprets subsequent pairs of points as "line-to". "line-to" is an instruction to put the tip of the pen onto the surface and draw.m x0,y0 x1,y1 x2,y2will draw a line fromx0,y0tox0+x1,y0+y1and then another segment fromx0+x1,y0+y1tox0+x2,y0+y2.The point to note is that the use of lower case is significant and is telling the SVG interpreter to calculate the coordinates as increment values that must be added to the previous location. As with the m directive the pen moves to the first point x0,y0 without drawing anything, but all subsequent points are drawn as segments joining adjacent points.
l x,ycommands the pen to draw a line from wherever the pen happens to be now to the pointx,y.l x,ycommands the pen to draw a line from the current pen position (x0,y0 for instance) to the pointx0 + x, y0 + y.zat the end of a list of path coordinates will close the path by drawing a line from the current point back to the start point.
Separate paths each get their own<path innards-of the path /> code.
Thus the SVG code for three separate paths could be as follows:
<path
d="M 125,100 340,149 340,100"
id="path3000"
style="style-descriptors" />
<path
d="m 128,258 0,137 148,0 0,-145 -148,8 z"
id="path3001"
style="style-descriptors" />
<path
d="m 114,629 0,-134 0,122 102,0 0,-134 105,0 0,120 82,0 0,-114"
id="path3002"
style="style-descriptors " />
Our interest is in the three lines starting from d= because these give the strings of x,y pairs that give the location of points on a drawn shape. The high degree of arithmetic precision is redundant because Tkinter will only use the integer part. However, if we needed to scale the picture up by multiplying each number by an amplification factor then the high arithmetic precision would avoid a small amount of distortion of the shape.
