How precise are our estimates? Confidence intervals
Abstract
To assess the precision of an estimate, compute its confidence interval. Use confidence intervals around all point estimates to understand the plausible range of the unknown population mean or proportion. Computing a confidence interval requires four things: an estimate of the mean, an estimate of the variability (derived from the sample standard deviation), the desired confidence level (typically 95%), and the sample size. Use the adjusted-Wald binomial confidence interval for binomial metrics such as completion rates. For satisfaction data using rating scales use the confidence intervals based on the t-distribution (which takes the sample size into account). The geometric mean is the best estimate of the middle task time from small sample sizes (<25). Because task-time data is positively skewed, use a log transformation before computing confidence intervals based on the t-distribution. For larger samples of task-time data (≥25), the median is the best point estimate of the middle task time, so compute the confidence interval around the median using the binomial distribution method.
Keywords
confidence interval
precision
sampling error
adjusted-Wald binomial confidence interval
geometric mean
log-transform
Introduction
In usability testing, like most applied research settings, we almost never have access to the entire user population. Instead we have to rely on taking samples to estimate the unknown population values. If we want to know how long it will take users to complete a task or what percent will complete a task on the first attempt, we need to estimate from a sample. The sample means and sample proportions (called statistics) are estimates of the values we really want—called the population parameters.
When we don’t have access to the entire population, even our best estimate from a sample will be close but not exactly right, and the smaller the sample size, the less accurate it will be. We need a way to know how good (precise) our estimates are.
To do so, we construct a range of values that we think will have a specified chance of containing the unknown population parameter. These ranges are called confidence intervals. For example, what is the average time it takes you to commute to work? Assuming you don’t telecommute, even your best guess (say 25 min) will be wrong by a few minutes or seconds. It would be more correct to provide an interval. For example, you might say on most days it takes between 20 and 30 min.
Confidence interval = twice the margin of error
If you’ve seen the results of a poll reported on TV along with a margin of error, then you are already familiar with confidence intervals. Confidence intervals are used just like margins of errors. In fact, a confidence interval is twice the margin of error. If you hear that 57% of likely voters approve of proposed legislation (95% margin of error ±3%) then the confidence interval is six percentage points wide, falling between 54% and 60% (57 − 3% and 57 + 3%).
In the above example, the question was about approval, with voters giving only a binary “approve” or “not-approve” response. It is coded just like a task-completion rate (0’s and 1’s) and we calculate the margins of errors and confidence intervals in the same way.
Confidence intervals provide precision and location
A confidence interval provides both a measure of location and precision. That is, we can see that the average approval rating is around 57%. We can also see that this estimate is reasonably precise. If we want to know whether the majority of voters approve the legislation we can see that it is very unlikely (less than a 2.5% chance) that fewer than half the voters approve. Precision, of course, is relative. If another poll has a margin of error of ±2%, it would be more precise (and have a narrower confidence interval), whereas a poll with a margin of error of 10% would be less precise (and have a wider confidence interval). Few user researchers will find themselves taking surveys about attitudes toward government. The concept and math performed on these surveys, however, is exactly the same as when we construct confidence intervals around completion rates.
Three components of a confidence interval
Three things affect the width of a confidence interval: the confidence level, the variability of the sample, and the sample size.
Confidence level
The confidence level is the “advertised coverage” of a confidence interval—the “95%” in a 95% confidence interval. This part is often left off of margin of error reports in television polls. A confidence level of 95% (the typical value) means that if you were to sample from the same population 100 times, you’d expect the interval to contain the actual mean or proportion 95 times. In reality the actual coverage of a confidence interval dips above and below the nominal confidence level (discussed later). Although a researcher can choose a confidence level of any value between 0% and 100%, it is usually set to 95% or 90%.
Variability
If there is more variation in a population, each sample taken will fluctuate more and therefore create a wider confidence interval. The variability of the population is estimated using the standard deviation from the sample.
Sample size
Without lowering the confidence level, the sample size is the only thing a researcher can control in affecting the width of a confidence interval. The confidence interval width and sample size have an inverse square root relationship. This means if you want to cut your margin of error in half, you need to quadruple your sample size. For example, if your margin of error is ±20% at a sample size of 20 you’d need a sample size of approximately 80 to have a margin of error of ±10%.
Confidence interval for a completion rate
One of the most fundamental of usability metrics is whether a user can complete a task. It is usually coded as a binary response: 1 for a successful attempt and 0 for an unsuccessful attempt. We saw how this has the same form as many surveys and polls that have only yes or no responses. When we watch ten users attempt a task and eight of them are able to successfully complete it, we have a sample completion rate of 0.80 (called a proportion) or, expressed as a percent, 80%.
If we were somehow able to measure all our users, or even just a few thousand of them, it is extremely unlikely that exactly 80% of all users would be able to complete the task. To know the likely range of the actual unknown population completion rate, we need to compute a binomial confidence interval around the sample proportion. There is a strong agreement on the importance of using confidence intervals in research. Until recently, however, there was not a terribly good way of computing binomial confidence intervals for small sample sizes.
Confidence interval history
It isn’t necessary to go through the history of a statistic to use it, but we’ll spend some time on the history of the binomial confidence interval for three reasons:
1. They are used very frequently in applied research.
2. They are covered in every statistics text (and you might even recall one formula).
3. There have been some relatively new developments in the statistics literature.
As we go through some of the different ways to compute binomial confidence intervals, keep in mind that statistical confidence means confidence in the method of constructing the interval—not confidence in a specific interval.
One of the first uses of confidence intervals was to estimate binary success rates (like the one used for completion rates). It was proposed by Simon Laplace 200 years ago (Laplace, 1812) and is still commonly taught in introductory statistics textbooks. It takes the following form:
pˆ±z(1−α2)pˆ(1−pˆ)n−−−−−√
where pˆ is the sample proportion,
n is the sample size, and
z(1−α2) is the critical value from the normal distribution for the level of confidence (1.96 for 95% confidence).
For example, if we observe 7 out of 10 users completing a task, we get the following 95% confidence interval around our sample completion rate of 70% (7/10).
According to this formula, we can be 95% confident that the actual population completion rate is somewhere between 42% and 98%. Despite Laplace’s original use, it has come to be known as the Wald interval, named after the 20th century statistician Abraham Wald.
Wald interval: terribly inaccurate for small samples
The problem with the Wald interval is that it is terribly inaccurate at small sample sizes (less than about 100) or when the proportion is close to 0 or 1—conditions that are very common with small sample usability data and in applied research. Instead of containing the actual proportion 95 times out of 100, it contains it far less, often as low as 50–60% of the time (Agresti and Coull, 1998). In other words, when you think you’re reporting a 95% confidence interval using the Wald method, it is more likely a 70% confidence interval. Because this problem is greatest with small sample sizes and when the proportion is far from 0.50, most introductory texts recommend large sample sizes to compute this confidence interval (usually at least 30). This recommendation also contributes to the widely held but incorrect notion that you need large sample sizes to use inferential statistics. As usability practitioners, we know that we often do not have the luxury of large sample sizes, but we also know that large sample sizes are not always required.
Exact confidence interval
Over the years there have been proposals to make confidence interval formulas more precise for all sample sizes and all ranges of the proportion. A class of confidence intervals known as exact intervals works well for even small sample sizes (Clopper and Pearson, 1934) and have been discussed in the usability literature (Lewis, 1996; Sauro, 2004). Exact intervals have two drawbacks: They tend to be overly conservative and are computationally intense, as shown in the Clopper–Pearson formula:
For the same 7 out of 10 completion rate, an exact 95% confidence interval ranges from 35% to 93%.
As was seen with the Wald interval, a stated confidence level of, say 95%, is no guarantee of an interval actually containing the proportion 95% of the time. Exact intervals are constructed in a way that guarantees that the confidence interval provides AT LEAST 95% coverage. To achieve that goal, however, exact intervals tend to be overly conservative, containing the population proportion closer to 99 times out of 100 (as opposed to the nominal 95 times out of 100). In other words, when you think you’re reporting a 95% confidence interval using an exact method, it is more likely a 99% interval. The result is an unnecessarily wide interval. This is especially the case when sample sizes are small, as they are in most usability tests.
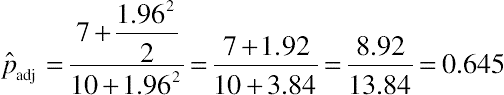
Adjusted-Wald: add two successes and two failures
Another approach to computing confidence intervals, known as the Score or Wilson interval, tends to strike a good balance between the exact and Wald in terms of actual coverage (Wilson, 1927). Its major drawback is it is rather tedious to compute and is not terribly well known, so it is thus often left out of introductory statistics texts. Recently, a simple alternative based on the work originally reported by Wilson, named the adjusted-Wald method by Agresti and Coull (1998), simply requires, for 95% confidence intervals, the addition of two successes and two failures to the observed number of successes and failures, and then uses the well-known Wald formula to compute the 95% binomial confidence interval.
Research (Agresti and Coull, 1998; Sauro and Lewis, 2005) has shown that the adjusted-Wald provides good coverage for most values of the sample completion rate (denoted pˆ), even when the completion rate approaches 0 or 1. The “add two successes and two failures” (or adding 2 to the numerator and 4 to the denominator) is derived from the critical value of the normal distribution for 95% intervals (1.96, which is approximately 2 and, when squared, is about 4).
where x is the number who successfully completed the task, and
n is the number who attempted the task (the sample size).
We find it easier to think of and explain this adjustment by rounding up to the whole numbers (2 successes and 2 failures) but since we almost always use software to compute confidence intervals we use the more precise 1.96 in the subsequent examples. Unless you’re doing the computations on the back of napkin (see Fig. 3.1), we recommend using 1.96—it will also make the transition easier when you need to use a different level of confidence than 95% (e.g., a 90% confidence level uses 1.64 and a 99% confidence level uses 2.57).
Figure 3.1Back of Napkin Adjusted-Wald Binomial Confidence Interval
The standard Wald formula is updated with the new adjusted values of pˆadj and nadj.
pˆadj±z(1−α2)pˆadj(1−pˆadj)nadj−−−−−−−−√
For example, if we compute a 95% adjusted-Wald interval for 7 out of 10 users completing a task, we first compute the adjusted proportion (pˆadj):
If 7 out of 10 users complete a task we can be 95% confident the actual completion rate is between 39% and 90% (pretty close to the back-of-napkin estimate in Fig. 3.1). Table 3.1 shows the intervals for all three methods.
Table 3.1
Comparison of Three Methods for Computing Binomial Confidence Intervals
On the strict interpretation of confidence intervals
What you need to know when discussing confidence intervals with statisticians
We love confidence intervals. You should use them whenever you can. When you do, you should watch out for some conceptual hurdles. In general you should know that a confidence interval will tell you the most likely range of the unknown population mean or proportion. For example, if 7 out of 10 users complete a task, the 95% confidence interval is 39% to 90%. If we were able to measure everyone in the user population, this is our best guess as to the percent of users that can complete the task.
It is incorrect to say “There is a 95% probability the population completion rate is between 39% and 90%.” While we (Jeff and Jim) will understand what you mean, others may be quick to point out the problem with that statement.
We are 95% confident in the method of generating confidence intervals and not in any given interval. The confidence interval we generated from the sample data either does or does not contain the population completion rate. If we ran 100 tests each with 10 users from the same population and computed confidence intervals each time, on average 95 of those 100 confidence intervals will contain the unknown population completion rate. We don’t know if the one sample of 10 we had is one of those 5 that doesn’t contain the completion rate. So it’s best to avoid using “probability” or “chance” when describing a confidence interval and remember that we’re 95% or 99% confident in the process of generating confidence intervals and not any given interval. Another way to interpret a confidence interval is to use Smithson’s (2003, p. 177) plausibility terminology: “Any value inside the interval could be said to be a plausible value; those outside the interval could be called implausible.”
Because it provides the most accurate confidence intervals over time, we recommend the adjusted-Wald interval for binomial confidence intervals for all sample sizes. At small sample sizes the adjustment makes a major improvement in accuracy. For larger sample sizes the effect of the adjustment has little impact but does no harm. For example, at a sample size of 500, adding two successes and two failures has much less of an impact on the calculation than when the sample size is 5.
There is one exception to our recommendation. If you absolutely must guarantee that your interval will contain the population completion rate no less than 95% of the time (or whatever level of confidence you have specified), then use the exact method.
Best point estimates for a completion rate
With small sample sizes in usability testing it is a common occurrence to have either all participants complete a task or all participants fail (100% and 0% completion rates). Although it is always possible that every single user will complete a task or every user will fail it, it is more likely when the estimate comes from a small sample size. In our experience such claims of absolute task success also tend to make stakeholders dubious of the small sample size. While the sample proportion is often the best estimate of the population completion rate, we have found some conditions where other estimates tend to be slightly better (Lewis and Sauro, 2006). Two other noteworthy estimates of the completion rate are:
• Laplace method: Add one success and one failure
• Wilson method: Add two successes and two failures (used as part of the adjusted-Wald interval).
Guidelines on reporting the best completion rate estimate
If you find yourself needing the best possible point estimate of the population completion rate consider the following rules on what to report (in addition to the confidence interval):
If you conduct usability tests in which your task completion rates typically take a wide range of values, uniformly distributed between 0% and 100%, then you should use the Laplace method. The smaller your sample size and the farther your initial estimate of the population completion rate is from 50%, the more you will improve your estimate of the actual completion rate.
If you conduct usability tests in which your task completion rates are roughly restricted to the range of 50–100% (the more common situation in usability testing), then the best estimation method depends on the value of the sample completion rate:
If the sample completion rate is:
1.Less than or equal to 50%: Use the Wilson method (which you get as part of the process of computing an adjusted-Wald binomial confidence interval).
2.Between 50% and 90%: Stick with reporting the sample proportion. Any attempt to improve on it is as likely to decrease as to increase the estimate’s accuracy.
3.Greater than 90% but less than 100%: Apply the Laplace method. DO NOT use Wilson in this range to estimate the population completion rate, even if you have computed a 95% adjusted-Wald confidence interval.
4.Equal to 100%: Use the Laplace method.
Always use an adjustment when sample sizes are small (n < 20). It does no harm to use an adjustment when sample sizes are larger. Keep in mind that even these guidelines will only slightly improve the accuracy of your estimate of the completion rate, so this is no substitution for computing and reporting confidence intervals.
How accurate are point estimates from small samples?
Even the best point estimate from a sample will differ by some amount from the actual population completion rate. To get an idea of the typical amount of error, we created a Monte Carlo simulator. The simulator compared thousands of small sample estimates to an actual population completion rate. At a sample size of five, on average, the completion rate differed by around 11 percentage points from the population completion rate. Seventy-five percent of the time the completion differed by less than 21 percentage points (see www.measuringu.com/blog/memory-math.php).
The results of this simulation tell us that even a very small sample completion rate isn’t useless even though the width of the 95% confidence interval is rather wide (typically 30+ percentage points). But given any single sample you can’t know ahead of time how accurate your estimate is. The confidence interval will provide a definitive range of plausible values. From a practical perspective, keep in mind that the values in the middle of the interval are more likely than those near the edges. If 95% confidence intervals are too wide to support decision making, then it is may be appropriate to lower the confidence level to 90% or 80%. See “What are reasonable criteria” in Chapter 6 for a discussion of appropriate statistical criteria for industrial decision making.
Confidence interval for a problem occurrence
The adjusted-Wald binomial confidence interval is one of the researcher’s most useful tools. Any measure that can be coded as binary can benefit from this confidence interval. In addition to a completion rate, another common measure of usability is the number of users likely to encounter a problem.
Even in primarily qualitative formative usability tests, simple counts of user-interface problems are taken. For example, 3 out of 5 users might experience the same problem with a design. Understanding the actual percent of users affected by the problem can guide the prioritization of problems and reduce some of the skepticism that comes with small sample sizes.
Using the adjusted-Wald formula, if 3 out 5 users experience a problem with a design, we can be 95% confident between 23% and 88% of all users are likely to experience the same problem. Although there is more uncertainty with small samples (the interval in this example is 65 percentage points wide), the confidence interval is still very informative. Specifically, it tells us we can be fairly certain that, if left uncorrected, one-fifth or more of all users would encounter the problem.
Confidence interval for rating scales and other continuous data
The best approach for constructing a confidence interval around numeric rating scales is to compute the mean and standard deviation of the responses then use the t-distribution. If you’re used to treating rating scale responses as discrete frequencies see Chapter 9 (“Is it OK to average data from multipoint scales?”). The t-distribution is like the normal (also called z-distribution) except that it takes the sample size into account. With smaller sample sizes, our estimate of the population variance is rather crude and will fluctuate more from sample to sample. The t-distribution adjusts for how good our estimate is by making the intervals wider as the sample sizes get smaller. As the sample size increases (especially at or above a sample size of 30), the t-confidence interval converges on the normal z-confidence interval. After a sample size exceeds 100 or so, the difference between confidence intervals using the z and t is only a fraction of a point. In other words, the t-distribution will provide the best interval regardless of your sample size, so we recommend using it for all sample sizes.
The t-confidence interval takes the following form:
x¯±t(1−α2)sn√
where x¯ is the sample mean,
n is the sample size,
s is the sample standard deviation, and
t(1−α2) is the critical value from the t-distribution for n−1 degrees of freedom and the specified level of confidence.
The confidence interval formula can appear intimidating. A simplified way of thinking about it is to think of the confidence interval as two margins of error around the mean. The margin of error is approximately two standard errors, and the standard error is how much we expect sample means to fluctuate given the sample size (Fig. 3.2).
Figure 3.2Diagram of Confidence Interval
To construct the interval, we need the mean, standard error, sample size, and critical value from the t-distribution, using the appropriate value of t for our sample size and desired confidence level. We can obtain the mean and standard deviation from our sample data.
Example 1
For example, let’s use the following scores from the System Usability Scale (SUS), collected when users rated the usability of a CRM application.
90,77.5,72.5,95,62.5,57.5,100,95,95,80,82.5,87.5
From this data we can generate the three basic ingredients needed to generate the t-confidence interval.
Mean: 82.9
Standard deviation: 13.5
Sample size: 12
The standard error is our estimate of how much the average sample means will fluctuate around the true population mean. It is the standard deviation divided by the square root of the sample size:
Standarderror=sn√=13.512√=3.9
In a normal distribution, we’d expect 95% of sample means to fall within 1.96 standard errors of the mean (see the Crash Course in the Appendix for a refresher on this relationship). The standard error is the same thing as the standard deviation of the sampling distribution of means. It is called the standard error to differentiate it from the standard deviation of the raw data and remind us that every sample mean has some error in estimating the population mean.
Because our sample size is fairly small, 95% of sample means will actually fluctuate more than two standard errors. The exact number depends on our sample size, found by looking up values from the t-distribution in a statistics text book, the Excel function = TINV(0.05,11) or the online calculator at: www.usablestats.com/calcs/tinv.
To find the t-critical value, we need alpha and the degrees of freedom. Alpha is the Greek symbol for the level of significance used in the study, typically 0.05. It is also one minus the confidence level, which is typically 95% (1−0.95 = 0.05).
The degrees of freedom (df) for this type of confidence interval is the sample size minus 1 (12−1 = 11). Below (Table 3.2) is an abbreviated t-table similar to ones you would find in a textbook. We first find 11 df and move to the right in the table until we reach our desired significance level (0.05).
Table 3.2
Abbreviated t-table
Level of Significance
df
0.2
0.1
0.05
0.01
0.001
1
3.08
6.31
12.71
63.66
636.62
2
1.89
2.92
4.30
9.92
31.60
3
1.64
2.35
3.18
5.84
12.92
4
1.53
2.13
2.78
4.60
8.61
5
1.48
2.02
2.57
4.03
6.87
6
1.44
1.94
2.45
3.71
5.96
7
1.41
1.89
2.36
3.50
5.41
8
1.40
1.86
2.31
3.36
5.04
9
1.38
1.83
2.26
3.25
4.78
10
1.37
1.81
2.23
3.17
4.59
11
1.36
1.80
2.20
3.11
4.44
12
1.36
1.78
2.18
3.05
4.32
13
1.35
1.77
2.16
3.01
4.22
14
1.35
1.76
2.14
2.98
4.14
15
1.34
1.75
2.13
2.95
4.07
We find the critical value of 2.20. Such a result is typically written as (t0.05, 11) = 2.20. It tells us at a sample size of 12 we can expect 95% of sample means to fall within 2.2 standard deviations of the population mean. We then express this as the margin of error:
Marginoferror=2.2sn√=2.2×3.9=8.6
The confidence interval is twice the margin of error, with upper and lower bounds computed by adding it to and subtracting it from our sample mean.
Confidenceinterval=82.9−8.6to82.9+8.6=74.3to91.5
Thus, we can be 95% confident that the true score is between 74.3 and 91.5.
Example 2
Fifteen users were asked to find information about a Mutual Fund on a Financial Services company website. After attempting the task, users answered a single 7-point Likert question about how difficult the task was. A rating of 1 corresponds to the response “Very Difficult” and a 7 “Very Easy”.
The responses were:
3,5,3,7,1,6,2,5,1,1,3,2,6,2,2
From this data, we can generate the three basic ingredients we need to generate the t-confidence interval.
Mean: 3.27
Standard deviation: 2.02
Sample size: 15
The critical value from the t-distribution is (t0.05, 14) = 2.14. Plugging the values in the formula, we get:
x¯±t(1−α2)sn√=3.27±2.142.0215√=3.27±1.1
Thus, we can be 95% confident that the population rating on this question is between 2.2 and 4.4.
Confidence interval for task-time data
Measuring time on task is a good way to assess task performance. Although it is an ideal continuous metric because it can be measured at very small increments, there is a complication with task time. Users cannot take any less than a fraction of a second to complete a typical usability task, but can take many minutes or hours, so task-time data has a tendency to be positively skewed (see Fig. 3.3).
Figure 3.3Positively Skewed Task-Time Data Sample task from an unattended usability test with 192 users who completed the task. The median is 71 and the arithmetic mean is 84.
Confidence intervals, like many statistical procedures, assume the underlying data has at least an approximately symmetrical distribution. Fig. 3.3 shows a nonsymmetrical distribution, so the mean is no longer a good measure of the center of the distribution. A few long task times have a strong pull on the mean, and for positively skewed data, the mean will always be higher than the center. Before we consider computing the best confidence interval around task time averages, we need to discuss the best average time.
Mean or median task time?
Up to this point we’ve been using the arithmetic mean as the measure of central tendency for rating scale data and referring to it as the average. The confidence intervals are providing the most likely boundary of the population mean. For many positively skewed datasets like home-prices or employee salaries, the median is a better measure of the center. By definition, the median provides the center point of the data—the point at which half the values are above the point and half are below. We suspect this is what most practitioners are trying to get at when they report an “average” task time.
For example, the task times of 100, 101, 102, 103, and 104 have a mean and median of 102. Adding an additional task time of 200 skews the distribution, making the mean 118.33 and the median 102.5.
It would seem that using the median would be the obvious choice for reporting the average task time, and this is indeed what many textbooks teach and what many practitioners do. There are, however, two major drawbacks to the median: variability and bias.
Variability
The strength of the median in resisting the influence of extreme values is also its weakness. The median doesn’t use all the information available in a sample. For odd samples, the median is the central value; for even samples, it’s the average of the two central values. Consequently, the medians of samples drawn from a continuous distribution are more variable than their means (Blalock, 1972). The increased variability of the median relative to the mean is amplified when sample sizes are small because with the introduction of each new value, the median can jump around a lot. Even though the underlying distribution is continuous, the sample values are not—they are essentially discrete.
Bias
One of the desirable properties of the sample mean is that it is unbiased. That is, any sample mean is just as likely to overestimate or underestimate the population mean. The median doesn’t share this property. At small samples, the sample median of completion times tends to consistently overestimate the population median—meaning it is a biased statistic (Cordes, 1993).
Although the sample mean generally has better properties than the sample median, we know that due to the skewness of the distributions of usability task times, the population mean will be larger than the center value of the distribution (the population median). The “right” measure of central tendency depends on the research question, but for many usability situations, practitioners want to estimate the center of the distribution.
Geometric mean
To find the best estimate of the middle task time for small sample usability data, we conducted an analysis of several alternatives for average task times (such as the arithmetic mean, median, geometric mean, and trimmed means). We used a large set of usability tasks and found the geometric mean to be a better estimate of the center than any of the other types of averages we assessed, including the sample median (Sauro and Lewis, 2010). For sample sizes less than 25, the geometric mean has less error and bias than the median or mean (see Fig. 3.4). Because this average is not familiar to most usability practitioners, we explain it in more detail below.
Figure 3.4Comparison of Central Tendency of Mean, Median, and Geometric Mean for Task-Time Data as a Function of Sample Size
Computing the geometric mean
To find the geometric mean, first convert raw task times using a log-transformation, find the mean of the transformed values, and then convert back to the original scale by exponentiating. The log-transformation can be done using the Excel function =LN(), using the ln button on most hand calculators, or using the web calculator at: www.measuringu.com/time_intervals.php.
For example, the following ten raw task times: 94, 95, 96, 113, 121, 132, 190, 193, 255, 298 get transformed into the log values: 4.54, 4.55, 4.56, 4.73, 4.80, 4.88, 5.25, 5.26, 5.54, 5.70. The arithmetic mean of these log values is 4.98. We can then exponentiate this value using the Excel function =EXP() or the ex button on a calculator to get the geometric mean of 146 s.
The raw times have an arithmetic mean of 159 s and median of 127 s. Over time the geometric mean will be the better estimate of the center for sample sizes less than around 25. For larger sample sizes, the sample median will be a better estimate of the population median. When possible, we recommend that practitioners use the geometric mean with small samples along with the confidence intervals around this average, computing the upper and lower bounds using the transformed data, then exponentiating those bounds to get back to the original time scale.
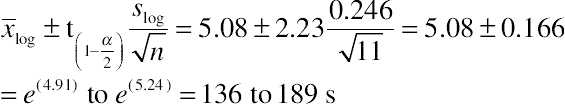
Log transforming confidence intervals for task-time data
We can also generate the confidence intervals for task times using the log-values. Once the data have been converted to their logs, we use the same procedure we did for confidence intervals around rating scale data, and then transform the data back to the original scale.
x¯log±t(1−α2)slogn√
Example 1
Here are raw completion times and the same times expressed as their natural log:
Next we follow the same steps to find the standard error and critical value from the t-distribution to generate the margin of error.
Mean of the logs: 4.98
Standard deviation of logs: 0.426
Sample size: 10
We use the standard deviation and sample size to generate the standard error of the mean (our estimate of how much sample means will vary at this sample size).
Standarderror=sn√=0.42610√=0.135
We look up the critical value from the t-distribution for 9 df (10−1) and get (t0.05, 9) = 2.26. Next we plug in our values to get the margin of error.
Marginoferror=2.26sn√=2.26×0.135=0.305
The confidence interval is twice the margin of error and is expressed by adding and subtracting it from the log-mean.
We can then be 95% confident the population median task time is between 37 and 62 s.
Confidence interval for large sample task times
As the sample size gets larger (especially above 25) the sample median does a better job of estimating the population median and should be used as the best average task time (Fig. 3.4). For large sample task times it also makes sense to compute a confidence interval around the median. The procedure for doing this is explained in the next section.
Confidence interval around a median
Certain types of data such as task times, reaction times or salary data tend to be skewed and the median tends to be a better estimate of the middle value than the mean. For small sample task-time data the geometric mean estimates the population median better than the sample median. As sample sizes get larger (especially above 25) the median tends to be the best estimate of the middle value.
When providing the median as the estimate of the average you should also include confidence intervals. The computations for a confidence interval around the median involve more than just inserting the median in place of the mean.
As with all confidence interval formulas there are a number of ways to compute them. Below is a method that uses the binomial distribution to estimate the intervals and should work well for most large sample situations.
The median is the point where 50% of values are above a value and 50% are below it. We can think of it as being at the 50th percentile. The point where 25% of values fall below a point is called the 25th percentile (also the 1st quartile) and the 75th percentile is higher than 75% of all values (the 3rd quartile).
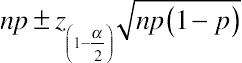
The following formula constructs a confidence interval around any percentile. The median (0.5) would be the most common but it could also be used with any percentile such as 0.05, 0.97, or 0.25.
np±z(1−α2)np(1−p)−−−−−−−−√
where n is the sample size,
p is the percentile expressed as a proportion (0.5 for the median),
z(1−α2) is the critical value from the normal distribution (1.96 for a 95% confidence level), and
np(1−p)−−−−−−−−√ is the standard error.
The results of the equation are rounded up to the next integer and the boundary of the confidence interval is between the two values in the ordered dataset.
Example 1
The following task times come from 30 users who successfully completed a task in a desktop accounting package:
167
158
136
124
77
317
85
65
120
136
80
186
110
95
109
330
96
116
76
100
248
57
122
96
173
115
137
76
152
149
The median task time is 118 s. The 95% confidence interval around the median is
So we need to find the 10th and 21st value (given in bold) in our ordered dataset
57
100
137
65
109
149
76
110
152
76
115
158
77
116
167
80
120
173
85
122
186
95
124
248
96
136
317
96
136
330
The 95% confidence interval around the median of 118 s ranges from 96 to 137 s.
Example 2
The following task times come from 27 users who successfully completed a task in a desktop accounting package. Arranged from the shortest to longest times, they are:
The 95% confidence interval around the median of 133 s ranges from 118 to 141 s.
Key points
• Due to sampling error, even the best point estimate from a sample will usually be wrong.
• You should use confidence intervals around all point estimates to understand the most likely range of the unknown population mean or proportion.
• Computing a confidence interval requires four things: an estimate of the mean, an estimate of the variability (derived from the sample standard deviation), the desired confidence level (typically 95%) and the sample size.
• Use the adjusted-Wald binomial confidence interval for completion rates. For rough estimates of 95% adjusted-Wald binomial confidence intervals, add 2 successes and 2 failures to the observed completion rate.
• For satisfaction data using rating scales use the t-confidence interval (which takes the sample size into account).
• The geometric mean is the best estimate of the middle task time from small sample sizes (less than 25).
• Task-time data is positively skewed and should be log-transformed prior to using the t-confidence interval.
• For large-sample task-time data (≥25) the median is the best point estimate of the middle task time, so you should compute a confidence interval around the median using the method for a confidence interval around a percentile.
•Table 3.3 provides a list of formulas used in this chapter.
Table 3.3
List of Chapter 3 Formulas
Type of Evaluation
Basic Formula
Notes
Wald binomial confidence interval
pˆ±z(1−α2)pˆ(1−pˆ)n−−−−−√
Commonly taught, but not recommended for small sample sizes—use z for desired level of confidence
Adjusted-Wald binomial confidence interval
pˆadj±z(1−α2)pˆadj(1−pˆadj)nadj−−−−−−−−√
Relatively new procedure, recommended for all samples sizes—see below for formulas for padj and nadj
Adjustment of p for adjusted-Wald binomial confidence interval
pˆadj=x+z22n+z2
Need to compute this to use in formula for adjusted-Wald binomial confidence interval
Adjustment of n for adjusted-Wald binomial confidence interval
nadj=n+z2
Need to compute this to use in formula for adjusted-Wald binomial confidence interval
Confidence interval for continuous data
x¯±t(1−α2)sn√
Use t for the appropriate degrees of freedom and confidence level
Confidence interval around a percentile
np±z(1−α2)np(1−p)−−−−−−−−√
For large sample sizes only—to use as confidence interval around the median, set p = 0.5.
Chapter review questions
1. Find the 95% confidence interval around the completion rate from a sample of 12 users where 10 completed the task successfully.
2. What is the 95% confidence interval around the median time for the following 12 task times: 198, 220, 136, 162, 143, 130, 199, 99, 136, 188, 199
3. What is the 90% confidence interval around the median time for the following 32 task times:
251
21
60
108
43
34
27
47
48
18
15
219
195
37
338
82
46
78
222
107
117
38
19
62
81
178
40
181
95
52
140
130
4. Find the 95% confidence interval around the average SUS score for the following fifteen scores from a test of an automotive website: 70, 50, 67.5, 35, 27.5, 50, 30, 37.5, 65, 45, 82.5, 80, 47.5, 32.5, 65
5. With 90% confidence, if 2 out of 8 users experience a problem with a registration element in a web-form, what percent of all users could plausibly encounter the problem should it go uncorrected?
Answers to chapter review questions
1. Use the adjusted-Wald binomial confidence interval. The adjustment is 11.9/15.84 = .752:
2. The log times are: 5.288, 5.394, 4.913, 5.088, 4.963, 4.868, 5.293, 4.595, 4.913, 5.236, 5.293 which makes the geometric mean = e(5.08) = 160.24 s. The 95% CI is:
4. A t-confidence interval should be constructed using a critical value of (t0.05, 14) = 2.14. The mean and standard deviation are 52.3 and 18.2 respectively.
x¯±t(1−α2)sn√=52.3±2.1418.215√=52.3±10.1
The 95% confidence interval for the average SUS score of 52.3 is between 42.2 and 62.4.
5. Compute a 90% adjusted-Wald binomial confidence interval. For 90% confidence, the value of z is 1.64. The adjusted proportion is 3.35/10.71 = 0.313.


 is the critical value from the normal distribution for the level of confidence (1.96 for 95% confidence).


 is the critical value from the t-distribution for n−1 degrees of freedom and the specified level of confidence.