In This Chapter
Working out what sort of shares suit you best
Making the most of the financial pages
Understanding debt
Considering how stocks shape up against cash
You don't need me to tell you that stocks and shares aren't the only way of running your investment portfolio. But they're always a good place to start, because the performance of the stock market pretty well determines what happens in a lot of other parts of the investing universe. And besides, a company's share price is one of the most reliable ways of telling what the business world thinks about that company – or, indeed, about the state of the business economy in general.
I'm going to tell you now that there are quite a lot of things you need to be aware of when you go out looking at stocks. But this chapter sets out some of the basic principles that underlie the stock market, and it shows you how the financial pages cover them. Chapter 6 will give you a bit more chapter-and-verse detail about the mote technical aspects.
First, I just want to say – don't panic! Much of the information in this chapter may sound very strange if you're new to the investing game, and unfortunately an awful lot of terminology's involved. But I explain the process of investing in shares in an easy-to-follow manner and you're going to be fine.
If you find yourself itching to discover more about any of the subjects I covered in this chapter, or indeed in any chapter, you can gain a wealth of detailed information in Investing For Dummies and Investing in Shares For Dummies. My purpose is to run you though some of the fundamental concepts and to show you exactly how you can interpret the information in the financial pages to your best advantage.
You can't find everything you need to know in the statistical pages of the financial press, though. The figures can only give you quite a small (although important) part of the overall picture when you look at a share. What makes the difference is how you use that information as a springboard for further research – on the Internet, in the papers, on discussion forums, and simply by keeping your ears open for the little scraps of news that give you a competitive edge.
Not every share appeals to every kind of investor. What you want out of a share is very likely to be affected by your risk profile – that is, by what sort of person you are and how much risk you can sensibly afford to take, bearing in mind your age and how much you depend on your shares. If investing's just a hobby, and if you can genuinely afford to be relaxed about possible losses, then your attitude to risk will probably be quite different from how it would be if your investments were crucial to your future well-being. And if you're genuinely interested in chasing down bargains and generally keeping on top of the daily hurly-burly, then you're going to take a different approach from someone who would really rather buy solid stocks and keep them for longish periods. If you think the whole subject is just a bore, but you still want to be invested, you'll probably be better off leaving the whole process to a professional agent, or perhaps buying a tracker fund that will automatically shadow the stock market's overall performance, rather than doing all the buying and selling yourself.
But your risk tolerance doesn't really get to the heart of the issue of how to choose shares, because even the most risk-tolerant investors know that sometimes stepping back and thinking about putting their money somewhere a little safer for a while makes sense. That might mean selling a lot of your shares (see 'Selling, and why it's harder than buying', later in this chapter, for more on this) and sitting tight on cash, or perhaps switching into bonds (take a look at Chapter 6) for a while.
Certain circumstances, such as an impending economic downturn, can also mean that you should think about dumping your more racy investments in new technology and the like, and opting for slow-and-steady plodders that won't set the world alight but which ought to keep you protected from the worst of whatever the market's getting ready to throw at you until it's finally finished throwing it. Then again, a family event such as a birth or a death or an illness – or, especially, a looming redundancy! – might mean that it's sensible to step back from the brink of risk until you're back on an even keel. That's what we mean by tailoring your risk to your circumstances.
How do you find out which companies belong in the safer categories and which ones are risky? As you may expect, you're not going to get many direct answers to this question. Nobody wants to say straight out that XYZ Technologies is a high-risk company that's suitable only for the very solvent or the totally scatty, because that sort of finger-pointing may frighten off a lot of potential investors and cause a panic that does XYZ Technologies no good at all.
But several ways do exist of finding out whether or not your company belongs to a very high-risk category or a very low-risk one. You can start by asking what industry sector of the stock market your share belongs in, and then home in on other companies in that sector to see how they're doing.
Note
Figure 5-1 shows a page from the FT Actuaries Share indices, which are produced by the Faculty and Institute of Actuaries in conjunction with the Financial Times and form the basis for pretty well every stock market tracker in the UK. For the time being, I want to look at the price/earnings ratio (covered in detail in Chapter 2), because the p/e can give a rough-and-ready idea of how much confidence the stock market has in a particular company, or a particular sector. The p/e is the risk ratio that divides a company's share price by its last set of pre-tax profits. Or, in other words, it tells you how many years' worth of profits you're paying for your shares if you go out and buy them today.
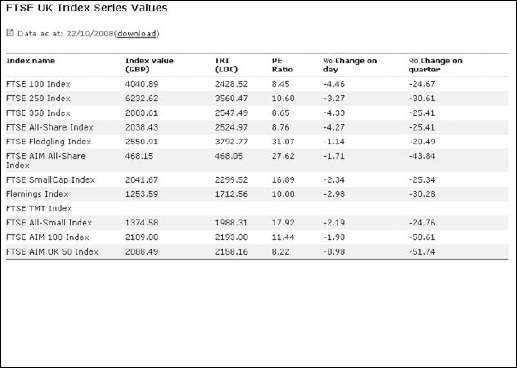
What's the first thing you notice when you look at the fourth column, the one with the p/e ratio? Right, it tells you that the FTSE-100 index, which comprises the 100 largest companies in the UK, carries a very much lower p/e ratio than the FTSE-250 index, which consists of the next 250 largest companies. This means that the FTSE-250 is significantly more expensive than the FTSE-100. And if you buy a typical selection of companies in the FTSE AIM (that's the Alternative Investment Market, which is only lightly regulated) All-Share index, you're paying a sky-high p/e of 76.04!
Tip
That figure represents a lot of risk. You can conclude from this information that, generally speaking, the larger the company, the smaller the risk you take when you buy a share. Of course, exceptions to this occur from time to time. (Northern Rock was a pretty big bank until it went almost bust in the last quarter of 2007.) But as a general rule, the assumption holds up fairly well. The lower the p/e, the lower the risk. In some sectors, such as the FTSE Fledgling company section, the risks and returns from these tiny companies, some of them virtually start-ups, are so high that you're not safe to pin a p/e figure on them at all.
Should that detail worry you? Later in this chapter, I take you through some of the main arguments that make people want to invest in ultra-risky stocks, and I also explain how the market arrives at valuations for these smaller companies that aren't producing any profits at all (take a look at 'Valuing a company that doesn't have any earnings', later in this chapter).
But you can also choose your risk ratios so that they reflect the industries themselves. Table 5-1 shows a sample of the main sectors that make up the FTSE Actuaries in April 2008.
Table 5.1. FTSE Actuary indices, 29 April 2008
Actual yield | Dividend cover | P/e ratio | % Annual | |
|---|---|---|---|---|
FTSE main indices | ||||
FTSE-100 | 3.71 | 2.35 | 11.49 | –5.58 |
FTSE-250 | 3.07 | 2.31 | 14.13 | – 16.11 |
FTSE-350 | 3.63 | 2.34 | 11.77 | – 7.19 |
FTSE SmallCap | 2.74 | 1.77 | 20.57 | – 23.72 |
FTSE Fledgling companies | 3.08 | n.a. | – 20.95 | |
FTSE -Aim | 0.66 | 2.01 | 76.04 | – 17.36 |
FTSE All-Share | 3.60 | 2.33 | 11.91 | – 7.75 |
Oil & Gas | 3.02 | 3.04 | 10.89 | 21.43 |
Basic materials | 1.29 | 6.18 | 12.50 | 49.45 |
Industrials | 2.97 | 2.24 | 15.00 | – 15.52 |
Consumer goods | 3.17 | 2.01 | 15.68 | – 4.89 |
Healthcare | 4.16 | 1.82 | 13.21 | – 22.26 |
Consumer services | 3.43 | 2.46 | 11.87 | – 27.25 |
Telecommunications | 4.67 | 1.69 | 12.64 | – 1.01 |
Utilities | 4.02 | 2.10 | 13.37 | – 5.97 |
Financials | 5.14 | 1.89 | 10.31 | – 23.91 |
Non-financials | 3.08 | 2.58 | 12.57 | – 0.82 |
Technology | 2.12 | 1.97 | 23.94 | – 21.54 |
What do you notice first about the fourth column in Table 5-1, the one that contains the p/e ratios? Certain industrial sectors command higher p/es than others. Technology stocks are running price/earnings ratios of nearly 24, while old staples like oil and gas are almost down into single figures. And if you think banks have a licence to print money, you're probably surprised to see they're the cheapest stocks in the market in terms of their p/e ratios. (Admittedly, this table was compiled in the aftermath of the 2007 credit crisis when several large international banks were looking shaky, but it isn't actually all that untypical of what the market normally gives you.)
Now look at the second column, which tells you what dividend yields you can get from these various sectors. Yields are especially important to some investors, particularly to people who are looking for security for the long term and aren't particularly bothered about making a lot of capital growth from their shares (Chapter 2 covers yields in detail).
Surprise, surprise, the slow and steady sectors turn out to be delivering the biggest dividends. Financial stocks were turning in an enormous 5.14 per cent return on the day this table was compiled – which goes a long way to explain why so many retired people hold bank stocks. And steady, 'mature' sectors like telecommunications and utilities (that is, gas, water, and electricity) are all producing relatively good returns of 4–5 per cent; whereas technology stocks only give 2.12 per cent, maybe less. Indeed, a large proportion of them were paying nothing at all, because they were focusing all their money on developing their businesses, not handing it back to their investors.
But the final column of Table 5-1 probably widens your eyes. In a year when the UK stock market had fallen by an average of 7.75 per cent (that's measuring by the FTSE All-Share index, which contains every share on the market), the basic industries – mining companies, utilities, and consumer goods industries – performed much better than all the industrial and technological shares. And this is entirely typical for a period of downturn. When the going gets tough, so-called mature industries show their worth.
If I showed you the really detailed breakdown, which lists the individual subsectors one by one, you'd see that some big variations existed between them as well. For instance, that steep 22.26 per cent decline in healthcare stocks was almost completely due to a 23.21 per cent collapse of pharmaceutical companies' share prices. The companies that supply actual healthcare services had seen their prices falling by a more modest 8.87 per cent. Mobile telephone companies like Vodafone had seen their share prices actually rising by 10.46 per cent, whereas fixed-line providers like British Telecom had fallen by an appalling 29 per cent. And within the consumer services sector, which fell by 27.25 per cent, the general retailers (department stores, furniture retailers, and so on) took a 43.51 per cent dive, while the food stores and chemists got away with a rather less alarming 12.74 per cent fall during the year.
Tip
You can find this full breakdown in the print edition of the Financial Times every morning. Oddly, it doesn't appear in any other paper, or anywhere online, even though it provides the central benchmarks for the London stock market.
You can control your risks more easily than you probably think. I can't stop you from buying a bad company, or from having a bout of sheer bad luck. And I don't want to stop you from taking a bigger risk on a company that may bring you enormous success if everything goes right.
Tip
Some sectors, however, fit your own risk profile better than others and a good place to start looking is on the FT website (media.ft.com). This site provides a definitive breakdown of which companies belong to which stock market sectors. It contains a pretty exhaustive list, including well over 2,000 different companies, and it ought to give you a decent start.
How often do you look at investment opportunities? Are you the kind of investor who checks up on his investments every day – or even several times a day? Or do you simply look out for a share you like and then stick with it for months, maybe years?
I'm a five-times-a-day man. Although I normally hold a share for an average of 18 months – which makes me quite a lot more faithful than the average UK investor, apparently – I'm possessed with a continuous urge to know the very latest about how my investments are doing. Sometimes I rely on the information I find in my daily newspapers, especially the news and reviews sections, which can encapsulate the spirit of a day's trading more effectively than any amount of detailed stuff on my computer screen. And sometimes I prefer to use the huge resources on the Internet, including intra-day price data, flexible charting, and up-to-the minute news coverage. Both have their strengths.
But in one area the traditional financial press always scores over the Internet. Unlike me, the average financial journalist doesn't spend his whole time watching share price movements. Instead, he's on the phone, talking to fund managers, analysts, bankers, and brokers – not to mention the secretive hedge fund managers who rarely raise their heads above the parapet for long enough to attract attention (see Chapter 15 for more on hedge funds).
In short, a well-informed financial journalist has a better grasp of what's going on, and who's doing what, than almost anybody else you're likely to meet. For instance, currently the leader writers in the papers are talking about how the hedge funds are distorting the patterns of commodity markets – gold, copper, wheat, and so on – by buying and selling commodity futures at short notice. And since hedge fund managers don't ever report publicly on what they're doing, you're never going to find out about these things unless you read them from somebody who's got the inside track.
Of course, you can pick up these same rumours in the Internet chat rooms if you're enthusiastic enough to want to give them a try. But you need to remember that chat rooms, blogs, and discussion forums are all very well, but they're populated by people who have their own agendas and don't always know what they're talking about. In contrast, a newspaper has a subeditor whose job is to look for inconsistencies, and an editor who fires any journalist who isn't careful enough with his fact checking.
That's why the statistics alone are only a small part of what you get when you look stuff up in the papers. You get wisdom as well, and years and years of experience, and a fact-checking regime that's properly worthwhile. In an age when the Internet's laying everything before you in unending detail, I encourage you to take the good old financial press seriously.
They say you can lead a horse to water but you can't make it drink. Certainly you can lead some investors to the facts but you can't make them think. Personally, I don't have any problem with investors who don't think. I wait until they make mistakes, and then I make money out of those mistakes.
Not many absolute truths exist in the financial markets. If you think that big dividends are always a good thing, or that low price/earnings ratios are always a sign of a bargain, you need to remember that one man's meat is another man's poison.
Some investors need to sprint for fast capital growth and aren't interested in getting dividends from their companies. And others don't care about capital growth as long as their dividend income's secure. Some cross the road to avoid anything that appears remotely risky, and others look at a risk and say: 'Bring it on. The bigger the risk, the bigger the payout.'
Tip
Tax considerations have quite a lot to do with people's different approaches to investment decisions. Some investors prefer to take their investment winnings in the form of earnings – perhaps because they've already used up most of their capital gains tax exemptions and they don't want to have to pay a flat-rate CGT on their winnings. Others, however, are set on maximising their capital gains at the expense of income – perhaps because they've got their investments stashed into Individual Savings Accounts (ISAs) or pension plans that roll up their capital gains or even disregard them completely for tax purposes. Either way, ne'er the twain shall meet.
My task in this chapter is to bring all these conflicting needs together in one place, and to talk in quite general terms about how to evaluate the information in the financial pages. What you do with that information once you've got it is coloured very largely by your own investment objectives, and by where you are in life and where you want to be in ten years' time.
I'm going to assume, for the moment, that you've found the information you're looking for in the financial press, and that it's opened your eyes to some big opportunity. So what do you actually do with the info? Do you get straight on to your stockbroker and tell him to buy (or sell) the shares right away? Or do you sit on your hands and wait a while, to be as sure as possible that you're doing the right thing?
Everyone has their own personality and their own ways of doing things, of course, but I've got to admit that I don't like acting quickly, no matter how pressing the need seems to be. If a share starts to look promising to me, that's my signal to go out and do some urgent research. I want to know how well the company's performing in relation to other companies in its sector. I'm looking for clues about how the whole sector's getting on, especially with regard to things like borrowing costs, foreign trade opportunities, and simple economic growth – the macro factors.
I probably take a good look at the company's last set of trading accounts, and I check out its website for news – or, at the very least, write to its registrar for details of its financial statements and any new press releases. I want to know all about its price/earnings ratios, and I'm interested in its dividend payments. When was the last dividend paid and how much was it? Is another dividend due to be paid soon?
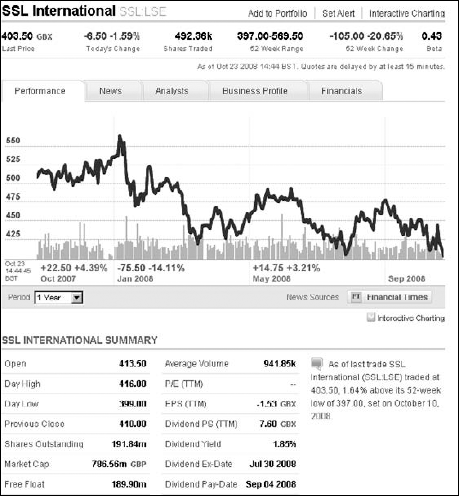
And then, last but by no means least, I look at the company's share price performance chart, just to double-check whether my hunches are correct or if I've made some ghastly mistake. I want to know about every blip and twitch in the share price over the last five years. And I want to see whether there's a seasonal pattern to the share price. One of my favourite power utility companies always rises in the late autumn and falls in the summer. You don't need to be a genius to figure out why, but you don't know for sure until you've seen the trend with your very own peepers. You can find more about the idea of charts (known as 'technical analysis') in Chapter 10.
Tip
One of the very useful things you can do with an Internet connection these days is to set up a dummy portfolio that lets you shadow your potential investments over a period of weeks or months at a time, without ever laying down a penny of your hard cash for the privilege. If you're new to investing, or just unfamiliar with a particular neck of the investment woods, then shadowing a portfolio like this is one of the very best ways of finding out whether or not you've got a feel for what you're doing. You can set up these investments for free through the London Stock Exchange website (www.lse.co.uk), the FT (www.ft.com), or Yahoo! (www.yahoo.co.uk). If you want to get really serious, you can even play an online game called Virtual Trader (www.virtualtrader.co.uk) and pit your wits against all-comers.
But the really great thing about these online portfolios – apart from the fact that you're not making a fool of yourself if you turn out not to have the Buffett genes – is that you can also instruct the websites to send you an email if any of the shares in your portfolio starts moving into your 'target zone'. With an automatic bloodhound like that on the case, you can be sure of never missing an opportunity to buy your shares at a real price that you've pre-selected.
You can also pre-set your buying price by simply giving your stockbroker what's called a limit order, which means that you give him permission to buy the shares for you if they ever fall below a certain price that you've specified in advance. Most stockbrokers can do this for you, and so can a few of the cut-price execution-only online brokers. But you have to have put enough liquid cash into your trading account before you give the instruction in the first place, and that isn't necessarily the way you want to operate. By using an online price-gathering site instead, you can keep your cash in your bank account where it belongs until almost the last moment.
What about selling your shares? Should you hold out until the very last minute, in the hope of squeezing the final drop of profit out of a winning position? Or are you better selling while the going's good, in the hope that you've called the top of the market correctly.
A saying in the investment world strikes a chord with me: 'Always leave something for the next guy.' That doesn't mean holding out till the last minute has no merit. Instead, it means that you have a life to lead, and that spending it hunched over your morning paper is such a shame when all you're trying to do is extract a few last pounds of profit that probably aren't going to change your life anyway.
Besides, if you can keep on telling yourself always to leave a little for the next guy, you have the perfect excuse in the event that your guess goes wrong and the price carries on rising after you've sold.
I'm going to admit something that hardly anybody else knows. I'm reasonably good at picking a winning share, but I'm absolutely terrible at knowing when to sell it. Sometimes I hold on to shares for far too long, in the vain hope of making just a little more profit against a falling market, so that the share price goes down while I'm actually watching my shares. (Drat!)
Or else I simply don't accept that I've bought a bad share in the first place and that I should take my losses and admit my mistake. So I carry on for months on end, holding that dud share and hoping against hope that something good eventually comes along to let me off the hook and keep my self-respect intact.
What a lot of investors do is impose a trailing stop-loss on themselves. Basically, they say:
'I've paid 400p for this share, and I'm not ever going to hold on to it if it falls to 20 per cent below its best price. (You decide the level.) So if the share falls to 320p next week (that is, 80 per cent of 400p), I sell it without a twinge of conscience. But if it rises to 500p, then I increase my stop-loss price to 400p (80 per cent of 500p), so that I sell it as soon as it drops back to 400p. Result: I've got an automatic trading program that continually ratchets up my minimum holding price, while at the same protecting me from excessive downside. How can I lose?'
How indeed? But the real beauty of a stop-loss is psychological. It takes all the responsibility off your shoulders if you ever have to sell because of a falling share price. You can safely tell yourself that the stop-loss has made the painful decision to sell, and not you. So you can safely curse the stop-loss and walk away from your loss with your pride intact.
This is a particular comfort if you have an emotional connection with a company's shares. Maybe they're your employer's shares and you feel a special affinity with them. Maybe you were the person who spotted the company when nobody else thought it was worth looking at, and so maybe you've been rooting for it and cheering it on as it finally broke through and gained recognition from the whole stock market. A fat lot of good that does you if the tide turns and the time's come to sell the shares again. But are you prepared to sever that old emotional link, that sense of being personally vindicated?
Note
Never fall in love with a share; it doesn't love you back.
Many different definitions of a price/earnings ratio exist (Chapter 2 covers p/e ratios in detail). Some analysts think that an investor should be looking forwards, not backwards, whenever he weighs up a share. What use is comparing last year's profits with today's share price, they ask. Doesn't looking at the company's current trading projections and then calculating a p/e ratio based on the way things seem to be going at the moment make more sense? And if the company's growing fast, aren't you even better off taking a stab at next year's profits and working out the maths from there?
For most people the best method is still the historical p/e ratio (often called the trailing p/e), which is what you get if you divide the company's current share price by its last reported set of pre-tax profits, diluted to take account of the number of shares currently in circulation. In other words, you're calculating what's known as the earnings per share figure and using that as the basis of your calculations.
Note
The historical p/e is a useful bedrock for your calculations, because you're using real numbers instead of just something some analyst's dreamed up after a long lunch with a client. If somebody's using a different measure of a company's profitability to calculate a p/e ratio you'd normally expect them to tell you.
Unfortunately, p/e ratios aren't always that simple. You find big discrepancies arising even between the print and online editions of some British newspapers, perhaps because somebody somewhere has read a broker's report that gets his imagination working overtime, and the good news somehow hasn't filtered through to the print room yet.
Warning
The stock market itself sometimes makes mistakes. Wrong prices turn up on the London Stock Exchange's own automated listing screens, usually because somebody's made a keyboard error and a price may be ten times too big or ten times too small. Or maybe it's even a price for the wrong stock altogether. These errors generally get sorted out in a matter of minutes, but goofs can occasionally stay on the record overnight. That does your blood pressure no good at all if you stumble on them inadvertently!
These things shouldn't happen, but unfortunately they often do. If something you see on the screen or in the paper looks startling or unusually attractive, go away and double-check it before you commit your hard-earned cash to a figure that may just be due to a misprint or a keyboard operator with a fat thumb.
Even the good old historical (or trailing) p/e ratio can cause some serious problems if the company happens to be going through a period of rapid change. If it's just bought a massive new division from one of its competitors, or closing down one of its manufacturing plants and taking the costs straight on the chin instead of spreading them out over a number of years, some very strange distortions can happen.
Figure 5-2 presents an example of a distorted p/e ratio. In 2007, the company in the illustration closed down a couple of its European factories and moved some of its operations to China. That was expensive, of course. And during the same year its operating profits rose by about 10 per cent, to £40 million or thereabouts. Things were looking good. But by the time it offset the cost of the move against its annual earnings, it only had about £6 million of pre-tax profits left! So this thriving, fast-expanding business was left carrying what on paper appeared to be a price/earnings ratio of – wait for it – 266.
Why did this company choose to write down all of its relocation costs at once, rather than diluting them by taking on some borrowing and then paying it back over several years? Because it wanted the tax break, presumably.
How can you protect yourself from falling into price/earnings traps? The general rule is: If something seems too good to be true, it probably is. But then again, if something seems too bad to be credible, doing some investigation to find out exactly what's been going on is worthwhile. If you've been fooled into thinking something's worse than it is, you can bet a lot of other people have as well. That's when you can move in quickly and bag a bargain. All you have to do then is wait until the world comes to its senses.
Tip
Do your own research. In the case shown in Figure 5-2, you'd have looked up the company's market capitalisation figure (see 'Understanding market capitalisation', later in this chapter), which is listed on any financial website or in Monday's copy of the FT. In this case it's nearly £900 million.
Then you'd have checked up on the latest trading reports – either on the Internet, or perhaps by writing to the company's head office if you couldn't find them in the newspapers. In this case you'd have discovered that the company had turned over a record £530 million in the previous trading year, and that it was expecting its profits before tax to hit £65 million. And straight away you'd have worked out that its true p/e was really somewhere in the 14–18 range.
But for the moment I'm going to assume that none of these confounded special circumstances is in play, and that what you see's really what you're going to get. Under these circumstances you can say quite clearly that the higher the p/e you're paying for a share, the better the stock market thinks the company's prospects are. And the lower the p/e, the more you should start sniffing round for the reason. It may be something as innocent as the company being in a slow-moving stock market sector, or its products being overtaken in the marketplace by something new.
Or possibly another company in the sector has recently had some bad luck that's dragged down the market's expectations for the whole sector, your company included. Never underestimate the power of 'sectoral drag', which happens when all the tracker funds in a particular sector are driven into forced selling. (Chapter 3 covers this in detail.) Sectoral drag can often create marvellous buying opportunities!
But the real puzzle happens when you find two similar-looking companies in the same stock market sector with widely-varying p/e ratios. If one company's sporting 25 and the other's on 11, you can safely assume that something's up. The market may not be quite as efficient as some people may have you believe, but it isn't that inefficient!
Choosing a company to invest in is a bit more involved than simply looking at the p/e figures and taking things from there. A price/earnings ratio is a very useful piece of shorthand information, and you should never ignore a figure that looks surprisingly high or surprisingly low. But if you think of the ratio as a spur to some deeper research, rather than treating it as if it inevitably represents good news or bad news in its own right, then you can't go far wrong.
What are you supposed to do when a company isn't producing any profits at all? Or not yet, anyway. Maybe it's a technology company that's working hard on something earth-shatteringly important that isn't yet in production. Maybe it's a new Internet service like Skype or Facebook or one of those price-comparison websites that depend on advertising revenues, and looks like it may rule the world in a few years' time if you can only summon up the courage to back it now. Surely these companies are still worth investing in, but how exactly are you supposed to put a value on them if they don't even have a price/earnings ratio? (No profits, no p/e. Simple really, isn't it?)
This is one of the best questions an investor ever has to ask himself. And the answer is that you weigh up the company concerned, and the prospects for its products, and then the general macro-economic environment, and then you take a flying guess, open your wallet, and hope for the best.
If that thought doesn't exactly fill you with pleasurable anticipation, you're not alone. Warren Buffett, the wealthiest man in the world, has repeatedly said that he won't have anything to do with a company that doesn't make money. And that he'll never, ever invest in a company if he can't understand what it does.
Fortunately not everybody's that hidebound, but you can see Buffett's point. History's littered with brilliant technological inventions that got trampled in the dust. The combined weight of competition and regulation has flattened any number of web-based marvels. Guessing which companies may conquer the planet and which may founder quickly really isn't easy.
When you have barely any information on which to base a decision, pretty well the only thing you can do is ignore the p/e ratio question altogether and try to gauge how much other investors want to buy a certain company's stocks. Like you, they're all looking at the size of the potential market. They're all focusing on the value of the company's patents, which might be pretty much all it's got. They've all spent a lot of time analysing the company's debts and assets, and they know who the major shareholders are.
Note
Sometimes the pundits try to extrapolate a p/e ratio out of a loss-making situation by projecting the company's sales forward and talking about a forward p/e ratio (or a prospective p/e ratio). These guesses always incorporate a bit of flannel, but on the whole they mean well. But you can bet that, even if the company makes a profit, the p/e ratio would be into the 50-plus range, which means that the shares are at least four times as expensive as normal shares in real terms. American Internet stocks like Yahoo! have been traded as high as 100 during the peaks of market euphoria.
That brings me to the next stage in my considerations, the question of market capitalisation – see the next section.
Market capitalisation is a fancy term to describe the whole value that the stock market places on your company's shares. And it's the basis on which the p/e ratio and a whole lot of other things are calculated. You can find a quotation for any listed company's market capitalisation in Monday's Financial Times, or on most Internet share price sites, or from the London Stock Exchange's own website (www.londonstockexchange.com).
A hefty market capitalisation is generally considered to be a good thing. Bigger companies are less liable to get thrown about by the slings and arrows of outrageous fortune than their smaller counterparts. They've got more money than their less gigantic rivals, so they can afford to ride out a temporary downturn in the economy. If they need to borrow money, they can get it at better rates than the minnows. And if they decide to issue corporate bonds (see Chapter 6 for more on these), they can get those on better terms as well because their credit ratings are more favourable than those of their competitors.
No wonder the pension funds are so keen on investing in large companies. You get far fewer nasty surprises. And you have the additional benefit of knowing that if a bruising takeover battle ever occurs, nobody's going to be able to bully your champion gladiator.
By comparison, a company with a small market capitalisation is more vulnerable but probably much more flexible. If you want to launch a £10 billion multinational company into a new field of activity, you've got to endure months and maybe years of feasibility studies, focus groups, in-depth audits, competition studies, and unending shareholder battles. Whereas if you're running a £100 million company where the board members already own 25 per cent of the shares, you can call a meeting with your main backers and get started. I'm making a huge generalisation, of course, but small companies are generally sparkier, more fun, and (from an investor's point of view) rather more likely to make you a fortune even if you allow for the large proportion that undoubtedly go bust along the way.
So what does market capitalisation mean? Does it mean that this amount of money is what the entire company's worth? Or just the bit that operates in the UK? Does it include all the company's activities and all its obligations? Or may it not cover things like private debts, assets, and liabilities that aren't obvious to the naked eye? In short, does the market capitalisation give a complete picture of what the company's really worth?
I'm afraid that the answer may disappoint you. Indeed, you may even think that somebody's trying to dodge the awkward questions. Because the plain truth is that that tidy little figure you see listed in the financial pages isn't rooted in reality at all. Instead, the market capitalisation figure tells you what the stock market thinks your company's worth, at this precise moment, and without any detailed knowledge of how much the company owns, or what it owes, or anything else. The market capitalisation's a guess, and a half-informed one at that.
Tip
Market capitalisation is the figure you get if you take today's share price and multiply it by the number of shares currently in issue. So if the share price is 200 pence and you know that 100 million shares have been issued, the market capitalisation is £200 million.
What's wrong with that? Well, you may think I'm nit-picking, but the calculation doesn't reveal anything much about what the company's actually worth on paper – only what the stock market thinks it's worth, as of today. If you're looking for a valuation that correlates with what the company's last balance sheet says, you're out of luck. The balance sheet contains no in-depth consideration of the company's assets, and no analysis of its debts. No examination of how many shares it's giving away to its employees at cut-price rates in form of stock options. No formal attempt to value its brands or its patents, or anything at all of that kind.
Tip
You can, however, get a rough approximation of the company's true valuation by looking out for a price to book value (PTBV), which quite literally compares the market capitalisation with what the company's own figures actually say.
So, having shattered all your illusions about the solidity of the information you read in your morning newspaper, where will you find information about this flawed thing we call the market capitalisation? Well, to tell you the truth it can be tougher than you might think. But the better British newspapers will usually give you a figure at least once a week, and pretty well all the online service providers include this sort of information all the time.
Warning
Make very sure that you're clear about what currency a market capitalisation is quoted in. Even the Financial Times isn't immune from quoting a dollar figure as if it were expressed in sterling from time to time – a failing that can seriously distort your understanding of the situation. And if a company lists various batches of shares on different stock markets around the world, the local stock exchanges may treat those issues as if they give the size of the whole global company instead of just the little bit that happens to be parked on their soil.
Warning
One more cautionary note: being the biggest fish in your particular pool is all very well, but that situation does impose certain constraints on you. If the authorities think a company's dominating things too heavily, you're quite likely to find that it isn't as free as its rivals when it comes to developing its business. Indeed, in an extreme case the authorities can even force a large company to split itself into two or more entities, or to hive off some of its more profitable arms to the competition. That can be bad news if you're an investor! See the nearby sidebar on measures to limit the power of huge companies.
Dividends can give you an income from your investments that may (or may not) prove to be steady and reliable over the years – in addition, of course, to the prospect of making capital gains from your shares (Chapter 2 gives you the complete lowdown on dividends, while Chapters 3 and 4 cover capital gains).
In a very general sense, the best dividends come from companies with low p/e ratios. That's not a cast-iron rule, but it makes more sense if you remember that, in the long run, dividends are ultimately paid for out of profits. And that the bigger the pre-tax profits a company makes in relation to the level of its share price, the lower the p/e ratio. Therefore a company with a sky-high p/e ratio (that is, one that isn't making much profit in relation to its market capitalisation) isn't going to be in a very good position to line your pocket with large dividend payouts.
Not every company issues dividends, however. Some industry sectors are more prone to these outbreaks of generosity than others. Let me try to explain why.
Certain industries are, to be frank, a bit over the hill as far as thrills and surprises are concerned. Not much excitement's to be had from making chemicals, for instance, and the growth potential of running a water company's also rather limited because you can make a pretty fair guess at how much water people are going to need over the next 20 years, and that probably isn't much more than today. So, if these companies want to hold on to their shareholders' loyalty during a period when the prospects of exciting share price growth are (to be gentle) rather limited, then they need to compensate them with big dividend payouts that keep them on side.
This sort of arrangement works out just fine for retired people who don't really care much for the thrill of the chase and prefer a sizeable payment coming into their bank accounts at regular intervals. Tax considerations are also important. People on incomes that aren't large enough to attract higher-rate tax (or indeed, any tax at all) are more likely to want an income from their shares than others who worry about having to pay capital gains tax on the proceeds from their investments.
All clear so far? Good, because I have to tell you the market's been suffering from a bit of an anomaly during the last few years, one that's made rather a mockery of some traditional assumptions about high-dividend stocks.
Until maybe 2005, the highest yielders on the Stock Exchange included two sectors that were so 'mature' as to be virtually comatose. On the one hand were the high-street banks, which had long since ceased to be dynamic and were paying sky-high dividends. Lloyds TSB, the most generous of the bunch, delivered a fantastic yield of around 8 per cent for the best part of two decades, and as you may expect, it gained a loyal following among so-called long-term buy-and-hold investors – the sort who like to buy a share and never sell it at all.
The other high-dividend payers were the mining companies who extract boring stuff like coal and copper ore and uranium, and who hardly saw any growth in their overall businesses for a decade or more. Like the banks, the mining sector had fallen into the habit of paying out big yields because they seemed to have little chance of giving investors very much in the way of capital growth.
By the end of 2007, the fact was already clear that both of these models were under strain, and for two very different reasons. Banks were plunged into a global credit crisis by a series of major scandals involving high-risk housing loans, which effectively left them unable to lend new money while simultaneously holding unknown quantities of bad loans. Lloyds TSB's dividend yield had suddenly become a millstone, because although its profits were down, it didn't dare cut the expensive yield for fear of causing panic among its investors.
As for those mining companies, their historical yields were slashed by a sharp rise in their share prices, caused by the explosion of demand from China. The Australian company BHP Billiton, the world's largest miner, is still dishing out pretty much the same healthy cash sums it used to, but a sevenfold increase in its share price within five years has left its handouts looking pitiful in relation to its market capitalisation. Like most other miners, Billiton's now spending every last Australian cent on new capacity, which leaves very little for handing out to shareholders. Overall, the FTSE Basic Materials index companies dropped to just a 1.29 per cent dividend yield by mid-2008, which made then the stingiest and most ungrateful companies in the UK market.
How can I say that the miners and the other basic materials suppliers are stingy? Just take a look at the right-hand column in Table 5-2, labelled Dividend cover, and notice that figure of 6.18.
What that figure means, in very simple terms, is that companies in this sector are making profits equivalent to more than six times what they're paying out to their investors in the form of dividends. And that's rather a big surprise, considering that traditionally, British-listed companies have tried particularly hard to distribute their earnings to their investors. (The investors do, after all, own the companies, so that doesn't seem an unreasonable expectation.)
But you gain more enlightenment if you compare this situation with what other companies are doing. The average FTSE company currently runs a dividend cover of 2.35; that is, for every £100 it distributes to investors, it makes a pre-tax profit of £235.
Where does the rest of the money go? Partly it goes towards paying interest on any bank loans. A lot of it typically gets ploughed back into the business, perhaps for building up a new division or for making an acquisition. And some of it may end up written off to absorb some unusual cost, such as a plant closure or a big backdated tax bill.
Either way, the dividend cover ratio's a pretty reliable way of figuring out whether a company can really afford the dividends it's paying out to its loyal shareholders.
Table 5.2. FTSE Actuary indices, 29 April 2008
Actual yield | Dividend cover | |
|---|---|---|
FTSE main indices | ||
FTSE-100 | 3.71 | 2.35 |
FTSE-250 | 3.07 | 2.31 |
FTSE-350 | 3.63 | 2.34 |
FTSE SmallCap | 2.74 | 1.77 |
FTSE Fledgling | 3.08 | |
FTSE -Aim | 0.66 | 2.01 |
FTSE -All-Share | 3.60 | 2.33 |
FTSE sector indices | ||
Oil & Gas | 3.02 | 3.04 |
Basic materials | 1.29 | 6.18 |
Industrials | 2.97 | 2.24 |
Consumer goods | 3.17 | 2.01 |
Healthcare | 4.16 | 1.82 |
Consumer services | 3.43 | 2.46 |
Telecommunications | 4.67 | 1.69 |
Utilities | 4.02 | 2.10 |
Financials | 5.14 | 1.89 |
Non-financials | 3.08 | 2.58 |
Technology | 2.12 | 1.97 |
Oil & Gas | 3.02 | 3.04 |
People generally want to know how much debt a company's carrying. And you can't blame them.
Note
If a company goes into insolvency, the cash creditors are the first people who get paid after HM Revenue and Customs and the administrators have both had their share. The shareholders are a long way down the queue!
But the level of debts can tell you many more important things about how a company's doing. For one thing, once you know how much your company owes, you're in a better position to figure out how a big change in lending conditions is likely to affect it. If bank rates go up, can your company honestly say that it won't be affected? Of course it can't.
But don't take too gloomy a view. Practically every company you can name has debts of some sort. Realistically, you can't start a business properly without either borrowing money or getting somebody to invest in you – and you can't expand it later on unless you can persuade the banks or the stock market to give you still more money, all of which you owe until you eventually pay it off. Indeed, a company that doesn't have any debts at all is a company that isn't really trying hard enough.
How does the market measure this situation? Normally it likes to talk about a debt ratio; that is, the entire debt burden the company's carrying, from all sorts of sources, divided by the total asset value. The result is a ratio that probably looks like 1:1, or 1:1.25, or 1:1.5. And generally speaking, the higher the debt ratio, the further out on the plank the company's standing at the moment, and the bigger the risk of failure if everything goes wrong. But conversely, if the company hasn't got a very high debt ratio at all, then that may signify it hasn't got much imagination and really isn't the right place for you to invest your money.
Note
For the moment, I can keep this simple and say they comprise two separate parts, current assets and long-term assets. Current assets include the value of any stock that happens to be in hand, plus the value of any liquid cash the company happens to have in its bank account at the time. And long-term assets include plant, property, equipment, land, manufacturing inputs, and so forth. Everything, in fact, except for so-called intangibles such as the value of any patents the company holds, or the goodwill from its business relationships, or the market value of any brands that it owns.
How does a company fix a value on its tangible assets? That's a good question, because accountants are allowed to play all kinds of games with depreciation, historic cost analyses, and all that sort of jiggery-pokery. What they view as assets can be pretty subjective. I'm not criticising here, merely trying to make sense of the situation. Not for the first time, you have little option but to trust accountants to know what they're talking about when they list a company's assets. And they do.
A debt ratio of some sort is clearly a necessary and desirable thing. You probably have a debt ratio of your own, which sets things like your mortgage, credit card debts, and overdraft against your assets, which include your home, car, savings, and the money in your bank account. But the difference in your case is that, unlike a company, you're not trying to conquer the world, and therefore you have nothing much to gain from leveraging yourself up to the hilt with more debt than you really need in order to attain a comfortable standard of living.
Investors often talk about an overall debt ratio, which provides the big-picture view of how exposed a company is to the debt markets. This figure's usually expressed as a percentage. Thus, a company that has a 111 per cent debt ratio is borrowing slightly more than the sum total of its assets, which is getting moderately risky. But for a listed company in the UK, a more commonly used definition is the debt/equity ratio, also known as the gearing ratio. Essentially, that's the figure you get when you divide the company's total debt, from all sources, by its shareholders' equity (broadly speaking, its market capitalisation – see the section of that name earlier in this chapter).
Occasionally, a debt/equity ratio can be in minus numbers if the company's holding more assets than debts. But that's a pretty rare eventuality. For a company, debt is good!
Note
Does that statement surprise you? Remember that your shares are also a kind of debt. After all, the company floated them on the stock market, probably by issuing new shares in a so-called initial public offering (IPO), in which it sold them to you (or, more likely, to your predecessors) for a flat, once-only sum of money. And after that first influx of cash it had nothing further to gain financially from having sold the shares in the first place – unless you count the various peripheral blessings that come from having a thriving share price and a big stock market capitalisation.
That was when the company's growth pains really started to bite. I mean, what's a company to do once it's sold its shares to the market and spent all the proceeds on developing the business? If it now gets the chance to buy up a competitor or build a new factory, or maybe even develop an entirely new line of products, the easiest place to go for the cash it needs is to the money markets. It starts by weighing up the pros and cons of a good old-fashioned bank loan of some sort. And then it asks its advisers to look into issuing a corporate bond (Chapter 6 covers these). Only if neither of those things looks workable does it decide on the third course of action, to undertake a rights issue.
A rights issue is when a company opts to twist its investors' arms so violently that they agree (usually reluctantly) to buy a whole new set of shares in the company. And this action usually signifies that the company's in some sort of trouble. Investors really hate being ordered to shell out more cash for a company that probably isn't performing well anyway, because it upsets their asset allocations and makes their portfolios look top heavy – by which I mean that the extra shares that they're being 'forced' to buy leaves an excessive proportion of their overall shareholdings in vested in just the one company.
Okay, the company generally makes sure that the rights issue shares are attractively priced in relation to the current share price, so that investors are effectively getting the shares on the cheap. And it doesn't usually dilute their shareholdings in any particularly damaging way, because even if they exercise their perfect right not to buy the rights issue shares, that merely leaves them owning a smaller piece of what is now a larger company, so they come out roughly quits.
Note
The company's market capitalisation goes up once the rights issue shares are floated and sold because the market capitalisation is the figure you get when you multiply the share price by the number of shares in issue. So when you increase the pool of shares, by any means at all, you inevitably increase the market capitalisation – unless, of course, the share price has fallen for some other reason.
Chapter 17 looks at a company's accounts and you can see there that a rights issue goes on the balance sheet alongside all the other debts and liabilities the company acquires along the way.
A company can draw a discreet veil over its borrowings in lots of ways, and not all of these debt types show up in the debt ratios unless you actively go looking for them (Chapter 6 has more on this).
A company may, for instance, choose to issue preference shares – a kind of private loan arrangement whereby 'preferred' people receive a cast-iron guarantee of getting a certain rate of interest in perpetuity in return for lending their money at a critical time in the company's history. It may dish out massive quantities of options or warrants or other less obvious devices, all of which are really just more or less invisible ways of giving selected people the opportunity to buy the shares at a heavily discounted price in the future.
The nearby sidebar, 'How options and similar devices short-change investors', describes an extreme example of how options, warrants, and so on can bring the good name of equity investing into disrepute.
In the great heyday of technology stocks during the late 1990s, up-and-coming young hopefuls often paid not just their staff but their directors, advisers, and financial backers in the form of options. All these options eventually returned to torment the shareholders, assuming of course that they hadn't already been wiped out by a complete share price collapse during the dot-com crash of spring 2000. Chapter 6 tells you more about options.
For the time being, the markets are taking a saner view of options releases, and fewer of the ultra-generous types are generally being issued.
At least eight different definitions of debt exist, and precise definitions tend to vary from country to country. Accountants also have an awful lot of leeway when deciding what to categorise as debt, and in what form. Defining debt's a minefield.
Does debt actually matter, though? Well, a surprising number of people reckon that the whole subject doesn't add up to a hill of beans. Value investors (those are people who like to buy up cheap stocks and watch them run) often like to say that they're not really interested in a company's debts, only in its profit potential. They're not really concerned with what a company does, only with how it performs. The stock market itself automatically 'prices in' a factor for the perceived levels of debt, they say, and that's all that you need to make money out of your stocks.
I'd say that's a little like crossing your fingers and hoping that number 13 doesn't come up twice in a row. Being at least vaguely aware of the debt issues, and keeping a sharp eye on the news columns for anything suggesting a company's debt levels may be rising or falling sharply, makes sense for most people. Any company's half-yearly or year-end financial statements can keep you informed of the current debt situation.
Tip
You need to read the accounts of a company you've invested in – and, more specifically, its balance sheet statement, which ought to tell you everything you need to know.
Where can you find out more about your company's debt ratio? Not in the newspapers, that's for sure. Not one of the main UK dailies tells you about a company's debts in any regular format. For that, you need to go online.
ADVFN (www.advfn.com) provides as many debt breakdowns as you may ever find a use for. The funeral director Dignity, for example, gets 11 different leverage measures, and it isn't even in a growth industry. Reuters (www.reuters.com/business/quotes), however, settles for just two.
Looking at the benefits of stocks and cash offers a fascinating comparison about the long-term benefits of stock market investing.
If you want to persuade your friends that shares really do outpoint cash investments in the long term, you really can't do better than to take the annual edition of the good old Barclays Capital Equity Gilt Study down the pub. It compares the UK stock market against the cash and government bond market all the way back to 1899 – or to 1925 if you want information for the US markets too.
Broadly speaking, the Barclays survey shows that equities have returned an average of around 7.2 per cent a year during the last half-century or so, after allowing for inflation. (That's using data for the period from 1957 to 2007.) But if you'd put your money into UK government bonds (gilts, about which more in Chapter 6), you'd have been crying into your beer – if indeed you'd been able to afford your pint at all. Your bonds would have made you just 2.4 per cent a year over the same period! (Again, in inflation-adjusted terms.)
But only if you reinvested your dividends. If you'd bought £100 worth of shares in 1945 and had simply taken the dividends as income, you'd be sitting on an investment of only £296 by the end of 2007. But reinvesting the dividends would have given you an extraordinary £4,577 – almost a 46-fold increase.
There's no denying, though, that times aren't quite as easy for shares these days. During the ten years to 2007 the average real return on equities was down to barely 3.1 per cent, which means they were only a whisker ahead of gilts, which would have given you 3% per cent. Even cash in the building society would have got fairly close to that if you'd been clever enough with your investments.
You won't be able to get your hands on a full copy of the Barclays Capital annual report unless you're a customer of the investment bank, or unless you're prepared to pay for the privilege. But do look out for press reviews and summaries of the report, which is usually released some time around mid-February.