Chapter 12: Rematch Performance Improvements and Best Practices
In this chapter, we'll learn about how to apply performance improvements to our React and Rematch applications, and how these performance optimizations are commonly solved using memoization and common sense. We'll also learn what it means to virtualize and normalize data, and how we can measure our applications to see where our bottlenecks are located.
We'll learn about all these concepts through real examples, including the Amazhop website that we've built throughout the book. We'll also investigate which optimizations are appropriate for adding to our website and how we can track any performance issue on any website that we make with React.
In this chapter, we'll cover the following topics:
- Before optimizing, measure
- Debouncing and throttling
- Virtualizing large lists
- React optimizations
- Redux selectors with deep comparison
- Redux batching
- Data normalization
By the end of the chapter, you will be able to profile any website and discover what issues are causing bad performance. You will also be able to introduce performance improvements to any Rematch and React code base.
Technical requirements
To follow along with this chapter, you will need the following:
- Basic knowledge of vanilla JavaScript and the features of ES6
- Basic knowledge of TypeScript
- Node.js >= 12
- Basic knowledge of React
- A browser (Chrome, for instance)
- A code editor (Visual Studio Code, for instance)
You can find the code for this chapter in the book's GitHub repository at https://github.com/PacktPublishing/Redux-Made-Easy-with-Rematch/tree/main/packages/chapter-12.
Before optimizing, measure
Before jumping into this chapter, there's an idea that I would like to introduce: If you can't measure it, you can't optimize it. This seems straightforward enough, but sometimes we just forget this and focus on adding supposed performance optimizations where we probably don't need them, basically introducing technical debt where we shouldn't. Sometimes this technical debt becomes larger and larger and we lose control of our project as it becomes hard to maintain or, even worse, impossible to debug.
This might seem obvious, but sometimes it's not, and here we're going to learn how to measure – or at least learn about the main programs that we can use to benchmark – our application and see where it can be optimized.
Let's enumerate the three most important tools to track React performance issues and analyze how to fix them at runtime.
Google Chrome DevTools
Google Chrome DevTools is the window that every frontend programmer knows well because it's used for practically everything: examining the console, debugging our CSS, and even tracking which requests our website is dealing with and how. But these tools are more powerful than we could have ever imagined.
We can open the Chrome DevTools panel as usual, by right-clicking on our browser page and clicking Inspect. Then after accessing the Performance tab, we can use the record button, that is, the black solid circle at the top left of Figure 12.1.
This will capture web indicators such as First Contentful Paint (FCP) and the usage of our Central Processing Unit (CPU), and even take screenshots along a timeline, helping us to debug our website performance accordingly.
When we run this performance tool on the Amazhop website, we can see that almost all the indicators are green, meaning that we built a website that meets the best standards:

Figure 12.1 – Chrome DevTools Performance tab with Amazhop in development mode
There is tons of official documentation from Google on how to analyze the runtime performance of our websites using their tools, and so that's why I'm going to introduce one of the most important metrics that we should pay attention to when building a new website or improving an older one.
The first one is Frames per Second (FPS). Users are happiest when the animations on our website run at 60 FPS, and when this value drops lower than 24 FPS, the user experience will probably be negatively affected:
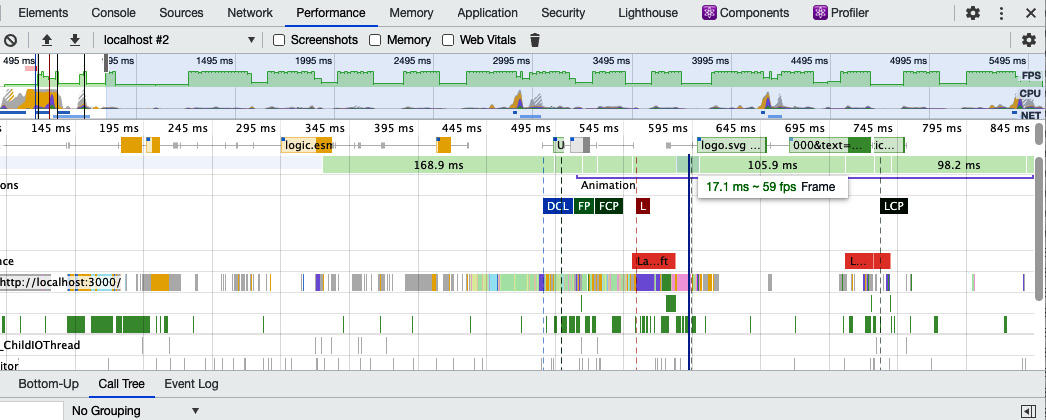
Figure 12.2 – The FPS indicator on the DevTools Performance tab
In our case, we can see that the Frames bar is green, meaning that our FPS value when scrolling and interacting with our website is between 50 and 60 FPS. Sometimes this value drops enough to harm the user experience due to the CPU or GPU trying to perform some complex tasks that should be rewritten with a simpler alternative.
Google Chrome DevTools offers a good solution to find out where and why our code is creating a bottleneck in our CPU/GPU and will help us to fix these issues.
The next tool we're going to analyze is the React DevTools extension. This is a browser extension that contains some useful profiling and debugging tools for our React applications.
The React DevTools extension
The React DevTools extension is an open source and official React extension for debugging our React applications that allows us to inspect the hierarchy of our React applications and profile where our components are re-rendered and why.
React DevTools works in a similar way to the Google Chrome DevTools Performance tab and contains a recording button where we can decide which interactions should be analyzed.
In this case, we're going to analyze the first render of our website. We can see that our Flamegraph is not bad at all. Since this is the first render, everything is slower than usual:

Figure 12.3 – React DevTools extension on the first load of Amazhop
Thanks to this extension and the profiling section, we discovered that when we reach the bottom and the List component requests more products, the whole list is re-rendered when it shouldn't be:

Figure 12.4 – Amazhop performance issue when fetching more data
This performance issue probably isn't noticeable on the first request, but what happens when it tries to re-paint 500 products in our infinite scroll? On modern devices, likely nothing happens, because they're powerful and React is fast, but imagine an Internet Explorer browser running on a machine with an old CPU – this behavior will make the FPS drop heavily and the page probably won't be usable.
We'll discover throughout this chapter how we can fix this situation with different alternatives.
Google Chrome Lighthouse
Google Chrome Lighthouse is also included under Google Chrome DevTools. It's an automated tool for improving the performance, quality, and correctness of our websites. Basically, under the hood, Lighthouse runs a battery of tests against the website and then generates a report on how well the website performed:

Figure 12.5 – Google Chrome Lighthouse score on Amazhop
In our case, our website performs extremely well when running the Lighthouse profiler, which suggests some options, including removing unused JavaScript files. Thanks to the Vite bundler and its tree-shaking technology, once this application is deployed to a production environment, the unused JavaScript files will automatically be removed.
In the next section, we'll discover some performance optimizations we can apply to our Amazhop website to improve the performance and FPS of our List component.
Debouncing and throttling
Debouncing and throttling techniques are used to limit the number of times a function can be executed.
For instance, with functions attached to events such as clicking on buttons, it is technically the user who decides when the function attached to the button executes and how many times. Sometimes this isn't good for the performance of our website, especially when our application is built with React and the performance is really tied to how many times the website re-renders.
With the debounce technique, it doesn't matter how many times the event is fired; it will be executed again only after the specified amount of time has passed after the user stops firing the event.
The most common usage for debouncing functions is adding an expensive callback when the user writes in the <input /> element:
import debounce from "lodash.debounce";
export const InputElement = () => {
const dispatch = useDispatch<Dispatch>();
const [value, setValue] = useState("");
useEffect(() => {
dispatch.shop.SET_QUERY(value !== "" && value);
}, [value]);
return (
<input
onChange={(e) => setValue(e.target.value)}
value={value}
type="text"
className="p-2 rounded-md w-full"
placeholder="Search products..."
/>
);
}
In this custom React component, we're basically using the onChange event to emit the setValue function, which is replacing the value state reference.
When the value state references change, it executes the useEffect life cycle, which is responsible for executing the dispatch.shop.SET_QUERY function with the new value state reference as a parameter.
It looks fine, but there is a problem: when the user writes one word, it works well, but what about when the user writes a long sentence? It will execute the function the same amount of times as the user's sentence length, because it is executed on every keypress, when it should just execute the function (for example, when the user stops writing after 300ms). This way, it will execute the SET_QUERY method just one time.
To introduce this, we just need to replace the dispatch.shop.SET_QUERY method with a debounced function of this method. We could create a native debounce function with setTimeout or use the lodash one instead:
import debounce from "lodash.debounce";
export const Header = () => {
const dispatch = useDispatch<Dispatch>();
const [value, setValue] = useState("");
const debouncedDispatch = debounce(dispatch.shop.SET_QUERY, 300);
useEffect(() => {
debouncedDispatch(value !== "" && value);
}, [value]);
Instead of dispatching N times, the debouncedDispatch function will automatically execute only after the user stops writing and 300ms has passed. Debouncing usually solves a lot of performance issues in our web applications.
And what is throttling? What's the difference compared to debouncing? Basically, throttling executes the function at a regular interval, while debouncing will execute the function after some amount of time has passed since the last execution.
In the next section, we'll see some libraries that solve a pain point in the performance of our websites: rendering large lists, basically adding too many Document Object Model (DOM) nodes to our website.
Virtualizing large lists
List virtualization consists of just rendering items visible to the user. Essentially, when the user scrolls, we programmatically show the relevant items that should appear in the DOM and hide those that shouldn't.
Looking at our Amazhop website, you have probably noticed that we're rendering the whole products array even if a given product is not visible in the viewport. This is not an issue if we're rendering the first 10 products, but what about rendering 5,000 products, creating 5,000 nodes with 5,000 images when probably only 5 can be displayed? This makes no sense.
That's why some React folks created some libraries such as react-window and react-virtual, which reduce the amount of work and time required to render the initial page and, of course, for the process of updating this data.
In the next section, we'll see some React optimizations that we can include in our Amazhop application to avoid unnecessary re-renders and will also see how to discover these optimizations through browser tools such as Google Chrome DevTools and the React DevTools extension.
React optimizations
React, as you likely know, offers some functions for helping us in situations where our application is rendered more than desired. This feature is called reconciliation. When some component's props or state change, React re-renders and creates a thing called a virtual DOM, which is basically an object representation of our components that is used later to be compared against the actual DOM objects. If they're not equal, React will update the DOM.
The virtual DOM resides in React memory and performs all its operations on this rather than the actual browser DOM. This is because browser repaints are expensive tasks; React is smart enough to efficiently compare these object representations of our elements and decide when it should repaint our screen.
This is automatically done under the hood, but sometimes we have situations where we know that our components don't need to update. That's why React offers some life cycle events for classes, such as the following:
shouldComponentUpdate(nextProps, nextState) {
return true;
}
shouldComponentUpdate is a life cycle event for React classes where we can decide when our component should reconcile. We can also use the React.PureComponent class, which is equivalent to implementing shouldComponentUpdate(), with a shallow comparison of the current and previous props and state.
Since we're not using classes on Amazhop, there's something similar for React functional components.
React.memo() is a Higher-Order Component (HOC) that basically checks for prop changes. This means that if our component is executed with the same props as the previous render, it will use the memoized one instead of re-rendering the component again.
Using the React DevTools extension, we can check that every time we reach the bottom, our previously rendered Product components are re-rendered because the parent component is rendered, but why should they re-render if their props are the same?

Figure 12.6 – React DevTools performance issue with product re-rendering
In this scenario Product components is re-rendered because the parent component is re-rendered, even when the Product props are the same, this is the perfect scenario for using React.memo() to fix this performance issue.
We just need to wrap our Product component with a memo HOC:
export const Product = React.memo(({ product }: ProductProps) => {
With just this change, our React application now automatically re-renders only the Product components that are new, or when the product prop changes.
React also offers two hooks for optimizing our React functional components, useMemo and useCallback.
useMemo
useMemo will only recompute the memoized value when one of the values inside the array, also called deps, has changed.
For example, taking the debounced function we introduced previously, we know that we can get a performance boost by memoizing the debounced function:
const debouncedDispatch = React.useMemo(
() => debounce(dispatch.shop.SET_QUERY, 300),
[dispatch]
);
Instead of recreating the debounced function every time the component re-renders, it is memoized and will only recompute when dispatch changes.
useCallback
Internally, both useCallback and useMemo use memoization. Basically, they remember something that happened in the past and they decide, given deps, whether they should forget the previous value and use the newest one, or return the older one like a cache.
The main difference of useCallback is that it remembers a function reference, while useMemo remembers the returned value of our function.
The following code snippet is essentially equivalent to the previous one implemented with useMemo:
const debouncedDispatch = React.useCallback(
debounce(dispatch.shop.SET_QUERY, 300),
[dispatch]
);
While useCallback memoizes functions, useMemo memoizes any computed value.
In the next section, we'll discover how Redux and Rematch can improve the performance of our application by avoiding unnecessary re-renders using shallow comparison.
Redux selectors with shallow comparison
You'll remember that the useSelector hook exported by the React Redux package introduces internal logic that only forces a re-render if the selector result appears to be different than the last result.
In version 7 of React Redux, a different result is determined by a strict reference comparison, using === under the hood to compare the new and previous values. If they're different, it will force a re-render.
That means if we return the same values in a different object reference, it will always re-render even if they're the same. Let's see this situation with a real example:

Figure 12.7 – Google Chrome console showing a strict reference comparison
Internally, what really matters to the useSelector hook to decide whether to re-render or not is the reference returned by the selector. It doesn't matter if other sections of the root state were updated; what matters is if the exact value returned by this selector changes, because the reference is the same.
This can be fixed in multiple ways, and you should choose the one you're most comfortable with.
Using the @rematch/select package
Basically, the @rematch/select package uses Reselect under the hood, which creates a memoized selector that returns multiple values in one object but only returns a new object when one of the values has changed.
The shallowEqual function
React Redux exports a function called shallowEqual, which performs a shallow equality comparison between the previous and new values to determine whether they are equivalent, as displayed in Figure 12.7. Using the shallowEqual function correctly determines whether the or and ar constants contain the same data even when their references aren't the same.
In the next section, we'll see how we can wrap multiple dispatch functions inside a unique re-render.
Redux batching
React Redux exports a function called batch(), which ensures that multiple actions dispatched outside of React only result in a single render update.
This works out of the box for Rematch and it's recommended in scenarios where our effects contain multiple dispatch executions to other models and we just need a single re-render update.
For example, imagine a Rematch effect that sets products to our state and then executes another effect that pushes some analytics to another model of our store:
dispatch.shop.SET_PRODUCTS({ products: data, totalCount });
dispatch.analytics.OTHER();
Since this logic is inside a Rematch effect, it doesn't run inside a React life cycle and will create two re-renders if we don't wrap this logic inside the batch() method:
import { batch } from "react-redux";
...
batch(() => {
dispatch.shop.SET_PRODUCTS({ products: data, totalCount });
dispatch.analytics.OTHER();
});
Just doing this will correctly render one single time instead of two.
As you will have noticed, most of the performance issues we encounter with React and Redux or Rematch are related to how many times our application re-renders and why. But sometimes there are some performance issues concerning the strategy we adopt when storing data inside Rematch/Redux stores. We usually end up storing too much data inside our stores, and even worse, we don't normalize this data, ending up with far too many duplications.
Data normalization
Some discussions appeared in the Rematch GitHub repository where some folks asked when and how they should save their data inside the store. We suggested the same thing as always: keep it simple.
If you need some local state that is not going to be used anywhere, use React's useState. If you need some local state that has side effects, you can use libraries that solve this, such as react-query, or even useEffect and useState together. And when you need to fetch some data or store some data that will be used in multiple screens, or you just want to fetch it once and use it anywhere, you can use Rematch with Redux, but always with data normalization.
Going back to the Amazhop application, as you'll remember, our cart state was something like this:
type CartState = {
addedIds: Array<string>;
quantityById: Record<string, number>;
};
const INITIAL_STATE: CartState = {
addedIds: [],
quantityById: {},
};
We created an addedIds array with the IDs stored as plain strings. quantityById is an object with IDs used as keys, and the values are the number of products added to the cart.
Technically, it would have been simpler to just create an array of products and store the whole product information inside the cart state, but we'll have that information duplicated because that product will be also stored inside the shop state – this is what we call data normalization.
We just need a copy of each piece of data in our state. Since it's a global state, we can access these values from anywhere, and we must, as much as we can, use arrays of IDs to store the keys and dictionaries to store the values. This leads to incredible performance when accessing these values and is highly maintainable.
After introducing all these performance improvements to any of our websites, we should probably notice nothing if we're using a modern browser and a modern computer, but we would probably notice a lot if we're using an older or lower-spec machine. These performance optimizations should only be introduced if we're sure that they're safe to add, as sometimes adding performance optimizations where we shouldn't causes errors that are hard to debug and track. That's why memoizing isn't the default behavior for components, stores, or selectors.
Summary
In this chapter, we have learned how to easily profile any React application and have seen how Google Chrome DevTools can help us to debug and track performance issues with our websites. We also learned some best practices, including virtualizing large lists and normalizing data, to improve the performance of our websites, and we have seen some React optimizations that we can start using in our projects.
The next chapter is the last one, and we'll finish with some personal conclusions about how Rematch will iterate over the future with other state management solutions that have appeared lately, along with how Rematch and Redux will co-exist with these new state management tools.