Cineplex Odeon's founder was famous for many things: inventing the multitheater concept, creating the paper popcorn container, and using a holiday weekend to barbwire the entrances of his competitor's headquarters building. He also legitimately used a change in accounting assumptions to turn an operating loss of $45 million into a reported $40 million in profit, even though the company was bleeding cash.
You may have heard catchphrases like "cash is king" and nodded intuitively while wondering exactly what that means. In a turnaround situation, it means that cash flow is the only measure of financial performance that matters. It seems simple, but to the average chief financial officer, who has spent his life training to master the intricacies of generally accepted accounting principles (GAAP) as determined in the United States by the Financial Accounting Standards Board (FASB), it seems like a confusingly rudimentary tool that ignores all of the complicated accrual methods that previously seemed critical to representing a company's financial performance accurately. In this chapter, we examine why the 13-Week Cash Flow Model [70] differs from GAAP analysis, and how it should be used as a diagnostic and performance measurement tool in a turnaround.
Fair warning: Although the concept is easier to master than the over 10,000 pages of GAAP rules and guidelines, this subject is more technical in nature than our other chapters. Consultants who specialize in turnarounds can almost do these in their sleep. The first time is the toughest.
An example given earlier was how the truck stop company, Flying J, was shocked when they ran out of cash for payroll even though they appeared profitable under GAAP. By contrast, Lehman Brothers intentionally took advantage of how GAAP accounting rules worked when they used repurchase agreements or "repos."[71] Repos are a way for companies such as investment banks to get additional financing. Assets are transferred on the books to another party, who gets cash in exchange by agreeing to transfer back the assets in the future and repay the money. Lehman then got creative and booked the incoming cash as sales, which made them look more profitable. The cash went out to pay huge salaries, bonuses, and other liabilities. This was allowed under GAAP rules, even though Lehman remained obliged to repay cash to repurchase the assets at some later date. At present, no one knows how many other firms use this technique, but it helped push Lehman toward its eventual liquidation. Cash flow forecasting would mean that the repayment, which includes interest, would show as an outflow in the model, treated as a debt payment.
GAAP arose out of an understandable desire to look at the bigger picture of a company's financial performance by separating the recognition of revenue from the actual collection of cash, and to come up with a common numerical language to review financial performance. In most normal circumstances, this makes a great deal of sense; for example, if a company bills its clients for $100 million of goods that cost it $80 million to produce, but as of December 31 (or any other date representing the company's accounting year end) has only actually collected $50 million from its customers, it would be unreasonable to deduce that the company had a terrible year because it "lost" $30 million. If the same company collected the outstanding balance of $50 million during the first quarter of the following year while only billing $10 million, it would be silly to determine that the company had earned $50 million of profit on just $10 million of sales in the quarter. To address these questions regarding the timing of revenues and expenses, GAAP uses the "accrual method," which essentially produces a "smoothing" effect wherein revenue is recognized not when it actually arrives in the company's bank accounts but rather when a credit sale is made, or a contract is completed, or some milestone (often a percentage of a long project being completed) is achieved.
Though sometimes useful in looking at a stable company's overall financial health (although even then, it permits such flexibility in terms of the assumptions used that "creative" managers can still distort a company's true health even while complying with GAAP's rules), GAAP becomes completely and totally irrelevant in a turnaround situation. First, GAAP is designed as a numerical language to keep score, an entirely backward-looking measure of a company's performance. Using it to make decisions about a company going forward is like driving a car relying only on the rearview mirror. Second, more important, the only thing that matters is the actual cash flows coming in and out of a company. Following GAAP principles, one might look at the next financial quarter (roughly 13 weeks), see that the company expected to make a profit overall, and assume that all is well. However, if one conducts a rigorous analysis plotting out exactly when cash will arrive in the bank account from customers and leave to pay suppliers, the very same company could be projected to run a negative cash balance for much of the quarter, potentially triggering a shutdown and liquidation. GAAP uses so many smoothing techniques, it's like saying you can't drown in a lake that averages four feet deep.
As turnaround consultant Alan Handley summarizes the problem succinctly,
I'm a CPA by background, and it's like a scarlet letter I have to wear; I have to say I'm a CPA. I hate it because CPAs tend to focus on these conventions that were set up for one purpose, but they get away from the truth of the real business. People focus on net income; I could care less about net income. You tell me what net income number you want and I can get it by manipulating the assumptions like depreciation, or when we recognize revenue, and so on. Construction is the worst, too, because construction accounting is basically cost plus margin, so the more I spend in a quarter, the more "net income" I generate even though I won't get paid until the project reaches completion points. It's kind of a game, so I can generate whatever net income I want. If you actually rely on GAAP, it just destroys the underlying rationale of the 13-week cash flow, just by definition.
In reality, managing to true cash is alien to most managers because
Almost all companies manage using some form of GAAP or IAS (International Accounting Standards)
Wall Street measures companies' performance on so-called "earnings," not cash, all measured by GAAP/IAS
Incentive programs focus on GAAP earnings, not cash
Managers use profit and loss statement (P&L) items to prepare budgets according to GAAP and are measured against same
GAAP accounting allows ways to, for example,
Book sales well before (or whether) cash is received
Capitalize and thus spread out P&L effect of capital expenditures, maintenance items, R&D, acquisition costs, and so forth
Not show effect of payment of debt
Companies use a shortcut to calculate/forecast cash flow by
Calculating P&L
Adding back depreciation
Subtracting capital expenditures
Perhaps adjusting for changes in working capital
And then completely missing the timing of cash flows
Note: GAAP should not be confused with Gaap, the character in demonology study who is a prince in hell and can make men insensible and invisible. According to some authors, Gaap can make men ignorant.[72]
To address GAAP's shortcomings, turnaround practitioners use the 13-Week Cash Flow Model, which comprehensively maps out the company's cash inflows and outflows on a week-by-week basis. The model rolls forward every week to maintain a consistent 13 weeks' (one financial quarter) worth of liquidity forecasting, which allows for ongoing measurement of the model's accuracy, critical given the "garbage in, garbage out" tendencies of all financial models, whose conclusions rely so heavily on their assumptions. The 13-Week Cash Flow Model (hereafter, 13WCFM, or simply "the model") ignores GAAP, EBITDA, or any other conventional accrual and smoothing methods of financial reporting, and instead focuses only on actual cash receipts and disbursements.
The model generally includes three distinct sections, each with its own spreadsheet: a page for anticipated cash receipts, a page for anticipated disbursements, and a page that aggregates the two to determine the company's debt capacity and availability going forward. After each week of the turnaround process, managers should reconcile the model against the company's actual bank receipts to measure its accuracy. This reconciliation (and any discrepancies it reveals) is one of the few metrics available for lenders and other external constituents to measure the ability of management to forecast near-term financial performance accurately. As such, the model has several applications in addition to its use as an internal forecasting mechanism. 13-Week Cash Flow Models are normally included as part of a debtor-in-possession (DIP) financing agreement, which provides companies with the capital necessary to fund a turnaround plan while operating in Chapter 11. (See Chapter Six for additional details on DIP financing.) Lenders will not even consider offering bankruptcy financing to a company whose management team has not produced a credible 13WCFM, and they will typically construct negative covenants into the financing agreement that require compliance with the agreed upon model's forecasts. Lenders will often require a 13WCFM for a company in the crisis phase to force them to be sure they don't run out of cash.
In constructing each section of the model, a manager must disregard all accrual and matching conventions, which can flummox classically trained CPAs. For example, if the company makes a normal sale on credit in week 2 of the model, it is not recorded directly on the 13WCFM in week 2 as GAAP accounting would dictate. Instead, we should look at the buying customer's historical tendencies (do they pay within the first ten days in order to take a 2 percent discount, or do they stretch their payables out past 30 days?) and make a reasonable assumption that the trend will continue, and plug the anticipated date of the cash's arrival into the model accordingly. Similarly, if a company records the transfer of finished goods inventory into its COGS because a sale was made, this would not appear anywhere on the 13WCFM, for it is simply an accounting convention to determine how profitable that sale was under GAAP. The only transactions we would enter on the model would entail an actual cash receipt or disbursement, such as the purchase of inventory, which we would record as of the transaction's date. One common mistake is overlooking the capitalized accounts on the balance sheet that results from the principle of matching that is prevalent in accrual accounting. For example, repairs to property, plants, and equipment are often capitalized as assets on the balance sheet, which distorts their true effect on the company's cash flow; rather than recording such transactions as increases in asset balances, companies in a turnaround must recognize them on the 13WCFM as the outflows of cash that they are, when they are paid for. Similarly, customer deposits on yet-to-be-delivered orders are frequently recorded as liabilities, when in fact these are cash-positive transactions for which the fulfillment of the liability requires no or little (in the case of shipping expenses) cash outflow.
All of the balance sheet items developed on an accrual basis—such as accrued expenses, deferred expenses, and prepaid assets—must therefore be ignored, except to the extent that they involve a change in the company's cash balance. For example, the individual components of accrued payroll taxes or interest expense that one knows with certainty will involve an outflow during the next 13 weeks will be recorded, but one should never add expenditures related to booking the future obligation of the company to pay an amount that does not occur in the 13-week period.
Remember that the 13WCFM also disregards anything—assets or liabilities—that will not convert to a cash event as part of the company's operations over the relevant time period. Leasehold assets and intangibles, for example, have no place in the model, and so one should never worry about conducting impairment analyses or verifying the appropriate time period over which to depreciate or amortize assets. However, additions to PP&E that will require cash expenditures, or sale of existing PP&E that will result in cash inflows, are obviously entered into the model.
Relying on GAAP has brought down many companies, even when they weren't trying to hide something. For example, Itel Corporation was created to buy and lease expensive IBM mainframe computers. Itel paid large bonuses to salesmen, so when leases were signed they rang a large ship's bell hanging from the high ceiling of their lavish offices. The loud multiple rings made everyone in the office smile. They set records at the time by how short a time it took a startup to reach $1 billion in booked sales in 1980.[73] They used the model to acquire and lease other products such as railcars and intermodel containers. By measuring revenues and profits according to GAAP, they had a great lifestyle: sporty company cars, drinking fountains with Perrier water, annual week-long company cruises, flying 1,200 employees to Acapulco for a week, and other heavy spending.[74] Meanwhile, everyone ignored the easy "outs" in the leases, particularly for the high-priced mainframes; if a new model of mainframe was introduced, customers could walk away from the lease of the old model and purchase or lease the newer model from another provider. The development of new, faster computers was predictable, and sure enough, customers were returning equipment Itel had financed heavily with debt. In addition, Itel had booked as current income their predicted residual or future resale value of the equipment as it would come off lease. Because of the new models of machines, the actual resale value of the old ones plummeted. Itel received as cash substantially less than it had booked as revenue under GAAP. By 1987, Itel's revenues shrunk to $210 million and its debt had swelled to $1.3 billion. It declared bankruptcy.
For the purposes of illustrating the 13WCFM, I have included screenshots of various tabs in a version of the model built for one of Handley's clients, a manufacturer we have disguised as "Wolverine Tooling." As the model available on this book's Web site displays, Wolverine got into trouble when its gross margins and sales both fell so precipitously that they could no longer cover for the company's lax A/R collection policies. Table 4.1 shows the P&L statement for Wolverine, as well as its balance sheet. The rest of this chapter highlights ways to use those data to help construct the 13WCFM shown at the end of the chapter.
Table 4.1. Wolverine Tooling Company Balance Sheet
Fiscal Year End December 31 | ||||
|---|---|---|---|---|
$000s | ||||
2007 | 2008 | 2009 | 2010 | |
Assets | ||||
Cash | 1,000 | 1,000 | 1,000 | 1,000 |
Accounts receivable, net | 15,000 | 17,500 | 20,000 | 26,000 |
Inventory, net | 39,000 | 42,500 | 45,000 | 30,850 |
Prepaid expenses | 5,000 | 5,000 | 5,000 | 5,000 |
Total current assets | 60,000 | 66,000 | 71,000 | 62,850 |
PPE | 172,500 | 175,000 | 177,500 | 180,000 |
Accumulated depreciation | (7,000) | (14,000) | (21,000) | (28,000) |
PPE, net | 165,500 | 161,000 | 156,500 | 152,000 |
Total assets | 225,500 | 227,000 | 227,500 | 214,850 |
Liabilities and shareholders' equity | ||||
Accounts payable | 4,000 | 5,000 | 5,000 | 8,575 |
Accrued expenses | 2,000 | 3,000 | 4,000 | 2,000 |
Current portion of LT debt | 1,000 | 1,000 | 1,000 | 1,000 |
Line of credit | 12,225 | 11,980 | 13,020 | 15,795 |
Total current liabilities | 19,225 | 20,980 | 23,020 | 27,370 |
LT debt | 30,000 | 29,000 | 28,000 | 27,000 |
Paid in capital | 175,000 | 175,000 | 175,000 | 175,000 |
Retained earnings | 1,275 | 2,020 | 1,480 | (14,520) |
Total equity | 176,275 | 177,020 | 176,480 | 160,480 |
Total liabilities and shareholders' equity | 225,500 | 227,000 | 227,500 | 214,850 |
Check | — | — | — | |
DPO = (Avg. AP / COGS) * 365 | 18.22 | 17.34 | 19.16 | 28.07 |
DSO = (Avg. AR / sales) * 365 | 54.41 | 49.23 | 63.36 | 82.52 |
Inventory turns = COGS / avg. inventory | 2.58 | 3.05 | 2.56 | 3.73 |
Fixed charge ratio | 1.44 | 1.26 | 0.89 | (2.30) |
Interest coverage ratio | 2.70 | 1.99 | 0.57 | (11.80) |
Debt / EBITDA | 2.89 | 3.06 | 3.63 | (3.48) |
Wolverine Tooling Company Income Statement | Fiscal Year End December 31 | |||||||||
|---|---|---|---|---|---|---|---|---|---|---|
$000s | ||||||||||
Actual 2007 | Actual 2008 | Actual 2009 | Actual 2010 | Projected | ||||||
1/31/11 | 2/28/11 | 3/31/11 | 4/30/11 | 5/31/11 | 6/30/11 | |||||
Sales | $100,625 | $129,750 | $115,210 | $115,000 | $10,063 | $10,063 | $10,063 | $10,063 | $10,063 | $10,063 |
COGS | 80,125 | 105,258 | 95,250 | 111,500 | 8,553 | 8,553 | 8,553 | 8,553 | 8,553 | 8,553 |
79.6% | 81.1% | 82.7% | 97.0% | 85.0% | 85.0% | 85.0% | 85.0% | 85.0% | 85.0% | |
Gross margin | 20,500 | 24,492 | 19,960 | 3,500 | 1,509 | 1,509 | 1,509 | 1,509 | 1,509 | 1,509 |
Percentage | 20.37% | 18.88% | 17.32% | 3.04% | 15.00% | 15.00% | 15.00% | 15.00% | 15.00% | 15.00% |
SG&A | 10,125 | 15,000 | 12,250 | 11,250 | $805 | $805 | $805 | $805 | $805 | $805 |
10.06% | 11.56% | 10.63% | 9.78% | 8.00% | 8.00% | 8.00% | 8.00% | 8.00% | 8.00% | |
EBITDA | 10,375 | 9,492 | 7,710 | (7,750) | 704 | 704 | 704 | 704 | 704 | 704 |
Percentage | 10.3% | 7.3% | 6.7% | −6.7% | 7.0% | 7.0% | 7.0% | 7.0% | 7.0% | 7.0% |
Depreciation | 7,000 | 7,000 | 7,000 | 7,000 | 583 | 583 | 583 | 583 | 583 | 583 |
EBIT | 3,375 | 2,492 | 710 | (14,750) | 121 | 121 | 121 | 121 | 121 | 121 |
Other income (expense) | (1,250) | (1,250) | (1,250) | (1,250) | (5,104) | (104) | (104) | (104) | (104) | (104) |
Net income before taxes | 2,125 | 1,242 | (540) | (16,000) | (4,983) | 17 | 17 | 17 | 17 | 17 |
Provision for income taxes | (850) | (497) | — | — | — | (7) | (7) | (7) | (7) | (7) |
$1,275 | $745 | $(540) | $(16,000) | $(4,983) | $10 | $10 | $10 | $10 | $10 | |
Net income | 1.27% | 0.57% | −0.47% | −13.91% | −49.52% | 0.10% | 0.10% | 0.10% | 0.10% | 0.10% |
The construction of a solid 13-Week Cash Flow Model begins with the systematic deconstruction of the balance sheet, specifically through the analysis of working capital accounts to determine when they will convert to cash events. Naturally, the sooner one can convert inventory and accounts receivable into cash inflows, the better, while the opposite is true for the conversion of accounts payable and accrued expenses into cash outflows.
In analyzing accounts receivable, managers should review the aging of various accounts, which will often require an examination of the invoices sent on each account to "unwind" those book-entry receivables. It is important to pay attention to the terms of each agreement; many large retailers are notorious for agreeing to 2–10 net 30 terms (a 2 percent discount if paid in the first 10 days, otherwise due within 30 days of receipt) and then paying sometime between 45 and 60 days and still taking the 2 percent discount. If one is willing to confront a good customer, it may refund the ill-gotten 2 percent, but until then, they will be happy to take a discount while stretching the supplier's cash to the breaking point.
Managers should exclude receivables amounts whose collection seems unlikely, such as those that have aged beyond 90 days, are subject to customer disputes regarding quality or warranty policies, or have been billed to customers who appear to be troubled themselves or who have filed bankruptcy. After disregarding these customer balances, managers should determine receivables dilution, or the extent to which customers take discounts on their bills because of damaged crates, mismarked goods, or other claims.
Throughout the receivables analysis process, mangers should remain conservative with regard to expected collection dates. Common errors include ignoring dilution and relying on aged accounts, whose collection probability is highly unpredictable. Meanwhile, managers should evaluate the company's in-house receivables function to determine whether it needs improvement in order to increase the velocity of the cash conversion cycle. When he lectures in my class, Handley often tells the tale of an unnamed A/R team with which he worked as a bank-inserted CRO:
You sometimes work with these small company A/R teams, or maybe a company so small that it's just a comptroller, and they're not making a big salary but they're actually the most important persons at the company, because they're the ones who get the cash flow. You would be amazed at the change in behavior you can produce when you offer people a $25 Starbucks card for whoever collects the most in a given week or month. Give them a $50 Starbucks card? Let me tell you, they'll be calling accounts they didn't even remember they had, just to win that coffee.[75]
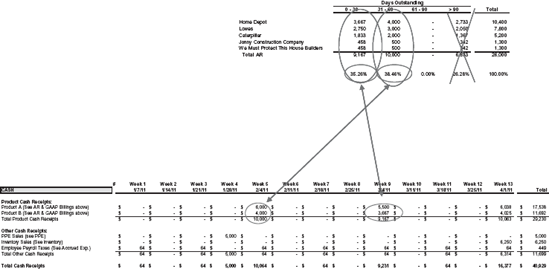
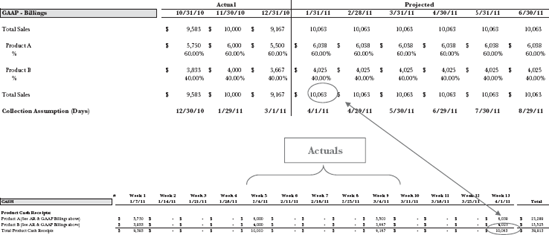
In Table 4.2, you will find an example of how one would convert a company's accounts receivable into a 13WCFM.
Here, we see that the company has $6.833 million in receivables that are older than 90 days. We should not expect to receive any of these, so in the income statement we would be likely to book an uncollectible A/R reserve in that amount, but this figure should appear nowhere on the 13WCFM. Instead, we are focused entirely on the receivables we still expect to collect, and we must make a reasonable assumption about how many days it will take us to collect them. In this case, if we assume that we can collect receivables within 60 days, and that for the sake of conservatism, all of the receivables between 31 and 60 days old are as "fresh" as possible (that is, they are only 31 days old), that means it will take 29 days to collect the $10,000 in receivables in the second column above. Again, for the sake of conservatism, we will round that 29 days (4.14 weeks) up to five weeks, suggesting that the $10,000 in cash will arrive during week 6. Some readers might wonder why we would be so conservative in rolling that entire sum—some portion of which in all likelihood is already older than 31 days—into week 6 instead of distributing it evenly across several weeks. It should be noted that we have simplified the model here, showing the receivables collected at monthly intervals. In reality, they would be put into the actual week each receivable is expected to arrive as cash. The concepts, however, are the same. It still pays to assume cash will arrive later than hoped. According to Handley, "It goes to credibility—if you have a lot of errors in your 13-Week Cash Flow Model, it turns into a feeding frenzy. If the team can't put together a good model, people ask, well, what else can't they do? Maybe they're just not the team to get this company back on track, so it's scrutinized pretty heavily."
Table 4.2. Wolverine Tool Company A/R Aging as of December 31, 2010 (in thousands of dollars)
Days Outstanding | |||||
|---|---|---|---|---|---|
0–30 | 31–60 | 61–90 | >90 | Total | |
Home Depot | 3,667 | 4,000 | — | 2,733 | 10,400 |
Lowes | 2,750 | 3,000 | — | 2,050 | 7,800 |
Caterpillar | 1,833 | 2,000 | — | 1,367 | 5,200 |
Jonny Construction Company | 458 | 500 | — | 342 | 1,300 |
We Must Protect This House Builders | 458 | 500 | — | 342 | 1,300 |
Total AR | 9,167 | 10,000 | — | 6,833 | 26,000 |
35.26% | 38.46% | 0.00% | 26.28% | 100.00% | |
These entries into the 13WCFM's receipts tab translate as demonstrated in Figure 4.1; note how receivables older than 90 days are disregarded entirely.
In summary, one should deconstruct the existing balance sheet for accounts receivable by
Reviewing agings (and more likely invoices) to "unwind" receivables
Paying very careful attention to terms
Excluding amounts that are not probable of collection (those older than 90 days, those with customer disputes, credit memos, or from apparently troubled customers, etc.)
Determining dilution (when a customer refuses to pay the full invoiced amount)
During this exercise, one must evaluate exactly how well the A/R function is operating and whether additional attention in this area could increase the velocity of the cash conversion cycle. It is important to be conservative, as it helps no one to be overly aggressive with the assumed timing of cash receipts. Common errors include relying on aged accounts receivable, which are never collected, and failing to consider dilution.
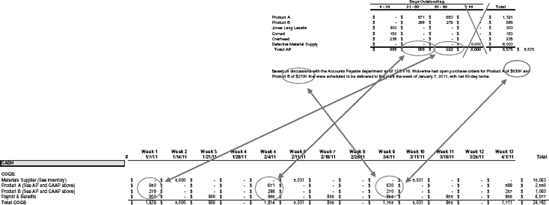
Having entered the appropriate amounts from the accounts receivable ledgers, managers should proceed to the accounts payable balances. As with A/R, managers should review the current agings and expected invoices to unwind the A/P, and review the terms of each agreement to see how best to slow down A/P payments. A common oversight stems from off-balance sheet liabilities, such as when a company issues a purchase order for goods, but (in accordance with GAAP) does not book a liability on its balance sheet. Goods can then show up suddenly, requiring payment within a specified projection period. Many turnaround managers have been taken by surprise when they think they have a handle on the company's payables, then goods arrive unexpectedly with payment due shortly thereafter, requiring a recalculation of the 13WCFM. As a result, one must carefully review open purchase orders with the A/P department, particularly for companies with significant construction in progress or R&D activity to mitigate this off-balance sheet risk.
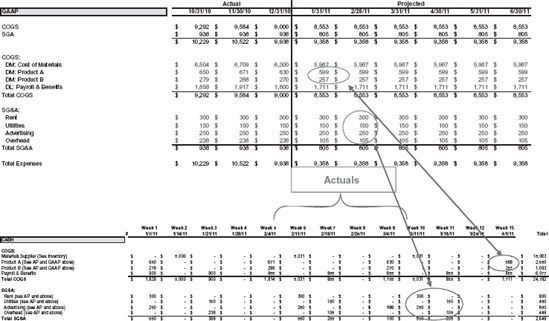
In the example shown in Figure 4.2, Wolverine Tooling pays for inventory on products A and B on 60-day terms, rent and advertising on five-day terms, and utilities and administrative overhead on 15-day terms. Given those terms, payables flow into the model's disbursements as demonstrated in Figure 4.2. Once again we are using monthly entries for simplicity's sake, but the expected payments entered into the actual week payments would have to be made.
In summary, deconstruct the existing balance sheet for accounts payable by
Reviewing current agings (and likely invoices) to "unwind" A/P
Reviewing terms and slowing down payment of A/P as much as possible
As with A/R, it may not be possible to analyze the entire A/P population thoroughly, but depending on the system, it is possible to obtain a good idea of what must be paid in each week during the next 30 days, 60 days, and so on. Again, be conservative; if you think you are going to have to pay it, then include it. Common errors stem from off-balance sheet liabilities, such as goods for which the company has issued a purchase order, which do not require the company to book a liability under GAAP. The goods then show up at the company's front door, making payment due within the 13WCFM's projection period or even arriving with terms set at cash on delivery (COD). It is therefore critical to review open purchase orders with the A/P department when constructing a 13WCFM to ensure that management is aware of these looming cash disbursements. Companies that have significant construction-in-progress or research and development activity merit especially close review of off-balance sheet risks.
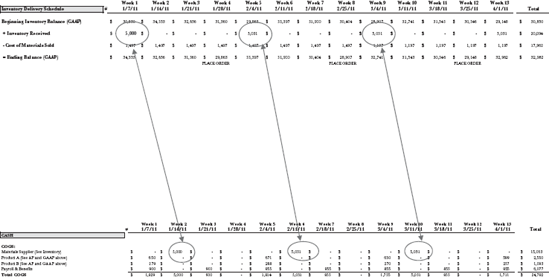
Inventory represents the third major component of working capital, and as such it must be integrated into the 13WCFM by reviewing the company's production schedule to determine how much inventory is scheduled to be consumed during the 13-week projection period and cash needed to buy new raw materials. It is important to scrutinize the company's claimed inventory balances; companies in a turnaround have likely responded to their distress by liquidating inventory as much as possible to free up cash. As a result, whatever inventory is still left over is often obsolete or otherwise unsalable, significantly reducing its potential to drive cash receipts. Companies often don't like to sell inventory below book value, as GAAP requires them to show a write-off and a loss, even though it is really a positive cash flow; in a turnaround, they must be disabused of this notion. In addition, special attention should be paid to work-in-progress, or WIP; as traditional borrowing agreements ascribe no value to WIP (that is, WIP does not increase the borrowing base), a more rapid conversion of WIP to finished inventory should become a priority. This will ease liquidity both by increasing any borrowing cushion with its lenders (by increasing finished inventory) and through the short-term restriction of raw good purchases to those critically needed to finish WIP.
Once an accurate inventory balance has been determined, managers should analyze the company's historical seasonal inventory buildup patterns to identify the appropriate maximum and minimum levels for inventory. Proper analysis of the timing of expected orders and their payment terms can then lead to significant improvements in the company's cash position, as many companies fail to manage inventory aggressively enough. In addition to relying on obsolete or slow-moving inventory to determine the timing of purchases, errors in this stage of the analysis include the failure to consider inventory that is in transit, having been shipped Freight on Board as of arrival at the company's property (FOB); in such a situation, the title to those inventory assets has not yet transferred to the company, thus preventing it from becoming visible in GAAP financials, but it will soon show up on the door and require cash outlays during the projection period.
Assuming Wolverine Tooling plans to maintain approximately four months of inventory, make new purchases when ending inventory balance drops below $30 million, and set inventory terms of FOB destination at seven days, and goods are usually delivered within seven days of the order, the company's cash disbursements for inventory purchases are as summarized in Figure 4.3.
In summary, to deconstruct the existing balance sheet for inventory,
Review production schedule to determine how much inventory is scheduled to be consumed during the projection period
Determine minimum/maximum levels for inventory
Establish timing of orders, terms of order (COD, CIA, Net 30, etc.) for new inventory purchases
Review obsolete and slow-moving inventory reserve
This analysis can often lead to significant improvements in cash position if company is not managing inventory aggressively if inventory is sold. Common errors are
Failure to consider inventory in transit shipped FOB destination (not visible in financials as title hasn't transferred but is going to show up on your doorstep during projection period)
Reliance upon obsolete or slow-moving inventory in determining inventory purchases
Another example: Once upon a time there was a publisher of children's books. Its list included the popular Ask Isaac series, written by scientist Isaac Asimov. Books were sold by commission-based employees who would call school librarians and public libraries to sell boxes of an assortment of books. They were sold on the basis that the customers had 60 days to review the books and return any they didn't want. Under GAAP, the sale was shown the day they shipped. Meanwhile, customers would return boxes of books, not pay, and leave the publisher's warehouse employees busy sorting the books, checking for damage, and putting each in its proper place back in the inventory. The publisher also paid for the freight to send the books as well as return them. Cash was going out to print and manufacture the books, pay for shipping, warehousing, SG&A (selling, general, and administrative expenses), and so forth. For the books that were kept, many libraries traditionally paid very late. Thus, the company bled cash but showed a profit almost up until the time it declared bankruptcy.
With the major working capital items out of the way, managers can then focus on smaller but still important accounts such as accrued expenses and liabilities, payroll and related taxes, property and sales taxes, professional fees (including, occasionally, an outside turnaround consultant's retainer), rent expenses, and interest expenses. Commonly overlooked items include other assets such as prepaid insurance expenses and additions to PP&E, which require cash payments that are amortized under GAAP.
Upon reconciling all relevant balance sheet accounts to the 13WCFM, managers should then review the income statement activity for cash disbursements that were not recorded through accounts payable, such as payroll expense, sales commissions, and contractually obligated bonuses. This should complete the simple unwinding of existing accounts that fills out the first month or two of the 13-Week Cash Flow Model, bringing the manager to the most challenging part of the model-building process: the subjective forecasting of future receipts based on historical A/R terms and dilution. This is as much art as science, for these forecasts must take into account historical trends, seasonality, potentially aggressive price negotiation from customers who feel they can exploit the company's weakness, and even details as granular as scheduled holidays that will cut a week's comparable sales by some 20 percent because purchasers won't be in the office. Because of the uncertain accuracy of these forecasts, managers should continually review and revise the model as they enter the second and third months of the projection period to ensure that they are not making faulty assumptions.
In the example of Figure 4.4, the 13WCFM makes the conservative assumption that the projected sales of $10.063 million in the month of January are all collected on the company's standard 60-day schedule, indicating that cash should become available in the week of April 1. Again, these would normally be spread into each actual week expected.
Managers will also have to make assumptions regarding disbursements to fill out the latter half of the initial 13WCFM. Managers should use some conservative take on historical performance for inventory turns to determine how long inventory will sit before being converted to a sale, while taking care to account for seasonality and production breaks, such as an extended plant closure for maintenance or during the December holiday period. For A/P expenses, managers can typically model assumptions based on the prior month-activity for routine, fixed expenditures such as utilities or rent payments, while more variable components must be linked to the factors that drive them. For example, SG&A expenses such as sales commissions are tied to sales, so the same assumptions regarding top line sales should drive the forecasts of those disbursements. In this step, common errors include overlooking nonrecurring expenses stemming from the company's financial distress, such as cure payments to lenders, retainers for attorneys, consultants, appraisers, and other professionals, and even bankruptcy filing fees. Most other expenditures should be relatively routine and predictable timing, such as payroll, taxes, debt service, and so on.
In the disbursements example in Figure 4.5, the expenses of $599,000 and $257,000 related to Products A and B are assumed to have been paid exactly 60 days after ordering; rent and advertising are paid five days later, and utilities and overhead are paid 15 days later.
The manager should now have completed the cash and debt roll-forward analysis, which draws information from the receipts and disbursement tabs to determine when the company will need cash. In Wolverine's case, the quarter will be a profitable one, but a properly completed 13-Week Cash Flow Model (shown in Table 4.3) would reveal that without significant cutbacks in expenses, the company would hit a negative cash balance in week 3, which would potentially force the company to shut down. Focusing entirely on EBITDA would have proven disastrous, as the forecast would fail to recognize the impending liquidity crisis. EBITDA analysis of these same numbers shows that a quarterly profit of over $2 million would be received. Even if broken down by month, serious losses don't show up under GAAP until late in the period, after the company would run out of cash earlier.
Once completed, the 13WCFM does not exist in a vacuum but instead should be subject to constant review and revision as new transactions take place and new information comes to light. Managers should also refuse to take the assumptions as givens; while Wolverine might be able to remain solvent with 60-day A/R collection periods, it obviously would be in far better shape with 50-day or even 40-day periods. As mentioned in the Introduction, managers should benchmark against competitors in the industry and against their own historical trends to determine what a "best-practices" collection policy might look like, and see how that would impact the conclusions of the 13WCFM.
The 13-Week Cash Flow Model is the most widely recognized tool of an experienced turnaround practitioner, and it can provide a much-needed dose of reality to incumbent management teams in denial or accustomed to masking the company's struggles with accrual accounting chicanery. In implementing a turnaround plan, just as much credibility is lost from producing an inaccurate 13WCFM as is gained from producing an effective one. In a period of constrained liquidity, managers must stay on top of the 13WCFM every day, ensuring that its projections contain a sufficient buffer to account for inevitable errors in forecasting. The discovery of any inaccuracy requires immediate recalculation, and if it is sufficiently severe, early disclosure to stakeholders who depend on it, such as lenders, a bankruptcy judge, a trustee, or a receiver. Just one week into the projection period, managers should begin constructing projections for week 14, so that the company retains a full fiscal quarter of visibility into its liquidity situation.
Table 4.3. Wolverine Tooling 13-Week Cash Flow Model Detail
Week 1 1/7/11 | Week 2 1/14/11 | Week 3 1/21/11 | Week 4 1/28/11 | Week 5 2/4/11 | Week 6 2/11/11 | Week 7 2/18/11 | Week 8 2/25/11 | Week 9 3/4/11 | Week 10 3/11/11 | Week 11 3/18/11 | Week 12 3/25/11 | Week 13 4/1/11 | Total | |
|---|---|---|---|---|---|---|---|---|---|---|---|---|---|---|
Opening Cash Balance | 1,000 | 1,000 | 1,000 | 1,000 | 1,000 | 1,000 | 1,000 | 1,000 | 1,000 | 1,000 | 1,000 | 1,000 | 1,000 | 1,000 |
Cash Inflows: | ||||||||||||||
Product A | 5,750 | — | — | — | 6,000 | — | — | — | 5,500 | — | — | — | 6,038 | 23,288 |
Product B | 3,833 | — | — | — | 4,000 | — | — | — | 3,667 | — | — | — | 4,025 | 15,525 |
Other Cash | 64 | — | 64 | 5,000 | 64 | — | 64 | — | 64 | — | 64 | — | 6,314 | 11,699 |
Reciepts | ||||||||||||||
Total Cash Inflows (A) | 9,647 | — | 64 | 5,000 | 10,064 | — | 64 | — | 9,231 | — | 64 | — | 16,377 | 50,512 |
Cash Outflows: | ||||||||||||||
Inventory Purchases | — | 5,000 | — | — | — | 5,031 | — | — | — | 5,031 | — | — | — | 15,063 |
AP: Product A | 650 | — | — | — | 671 | — | — | — | 630 | — | — | — | 599 | 2,550 |
AP: Product B | 279 | — | — | — | 288 | — | — | — | 270 | — | — | — | 257 | 1,093 |
Payroll & Benefits | 900 | — | 900 | — | 855 | — | 855 | — | 855 | — | 855 | — | 855 | 6,077 |
Rent | 300 | — | — | — | — | 300 | — | — | — | 300 | — | — | — | 900 |
Utilities | 150 | — | 150 | — | — | — | 150 | — | — | — | 150 | — | — | 600 |
Advertising | 250 | — | — | — | — | 250 | — | — | 100 | 250 | — | — | — | 850 |
Administrative Overhead | 238 | — | 238 | — | — | — | 105 | — | — | — | 105 | — | — | 685 |
Payroll Taxes | — | — | — | — | — | — | — | — | — | — | — | — | 834 | 834 |
Insurance/Workers Compensation | 500 | — | — | — | — | — | — | — | — | — | — | — | 500 | 1,000 |
Total Direct & Indirect Job Outflows | 3,267 | 5,000 | 1,288 | — | 1,814 | 5,581 | 1,110 | — | 1,855 | 5,581 | 1,110 | — | 3,045 | 29,651 |
Capital Expenditures | 1,000 | — | — | — | — | — | — | — | 1,000 | — | — | — | — | 2,000 |
Total Cash Outflows (B) | 4,267 | 5,000 | 1,288 | — | 1,814 | 5,581 | 1,110 | — | 2,855 | 5,581 | 1,110 | — | 3,045 | 31,651 |
Cash Surplus/(Deficit) (A-B) | 5,381 | (5,000) | (1,223) | 5,000 | 8,250 | (5,581) | (1,046) | — | 6,376 | (5,581) | (1,046) | — | 13,332 | 18,861 |
Financing: | ||||||||||||||
Beginning Revolver | 15,795 | 10,414 | 15,414 | 16,637 | 11,637 | 3,387 | 8,968 | 10,014 | 10,014 | 3,638 | 9,220 | 10,266 | 10,266 | 15,795 |
Cash Need | — | 5,000 | 1,223 | — | — | 5,581 | 1,046 | — | — | 5,581 | 1,046 | — | — | 19,478 |
Paydown | 5,381 | — | — | 5,000 | 8,250 | — | — | — | 6,376 | — | — | — | 13,332 | 38,339 |
Ending Revolver | 10,414 | 15,414 | 16,637 | 11,637 | 3,387 | 8,968 | 10,014 | 10,014 | 3,638 | 9,220 | 10,266 | 10,266 | (3,066) | (3,066) |
Total Commitment | $25,000 | $25,000 | $25,000 | $25,000 | $25,000 | $25,000 | $25,000 | $25,000 | $25,000 | $25,000 | $25,000 | $25,000 | $25,000 | $25,000 |
Cushion | $14,586 | $9,586 | $8,363 | $13,363 | $21,613 | $16,032 | $14,986 | $14,986 | $21,362 | $15,780 | $14,734 | $14,734 | $28,066 | $28,066 |
Low Cushion | ||||||||||||||
Ending Cash Balance | 1,000 | 1,000 | 1,000 | 1,000 | 1,000 | 1,000 | 1,000 | 1,000 | 1,000 | 1,000 | 1,000 | 1,000 | 1,000 | 1,000 |
It should be noted that this technique is sometimes used as a daily cash flow model, or even extended to cover a full year of forecasting. Thirteen weeks (or a quarter of a year) is simply the time horizon used most frequently.
Finally, how does an executive solve the dilemma of properly managing his company focusing on cash flow, but have investors and government agencies talking in GAAP? The answer:
Manage to cash, but...
Report in GAAP/IAS