
9.1 Introduction
This section provides the basic instructions for performing a failure mode and effects analysis (FMEA) and a failure mode, effects, and criticality analysis (FMECA) for the purpose of analyzing procedures for risk. Also provided are examples of commonly used symbols and tables used in the analysis process. An example of how these techniques are used for analyzing procedures is also provided.
9.1.1 Description
An FMEA is a detailed document that identifies ways in which a process or product can fail to meet critical requirements. It is a living document that lists all the possible causes of failure from which a list of items can be generated to determine types of controls or where changes in the procedures should be made to reduce or mitigate risk. The FMEA also allows procedure developers to prioritize and track procedure changes (2).
9.1.2 Why is a Failure Mode and Effects Analysis Effective?
The process is effective because it provides a very systematic approach for evaluating a system or a procedure. It provides a means for identifying and documenting the following:
9.1.3 Types of Failure Mode and Effects Analyses
9.1.4 Failure Mode and Effects Analysis Process
An FMEA is somewhat more detailed than a PHA and is conducted more on a step-by-step basis. Table 9.1 shows an example of an FMEA table. Note that a great deal of what is contained in a PHA is also contained in an FMEA. Therefore, this section focuses on the process of performing an FMEA.
Table 9.1 FMEA
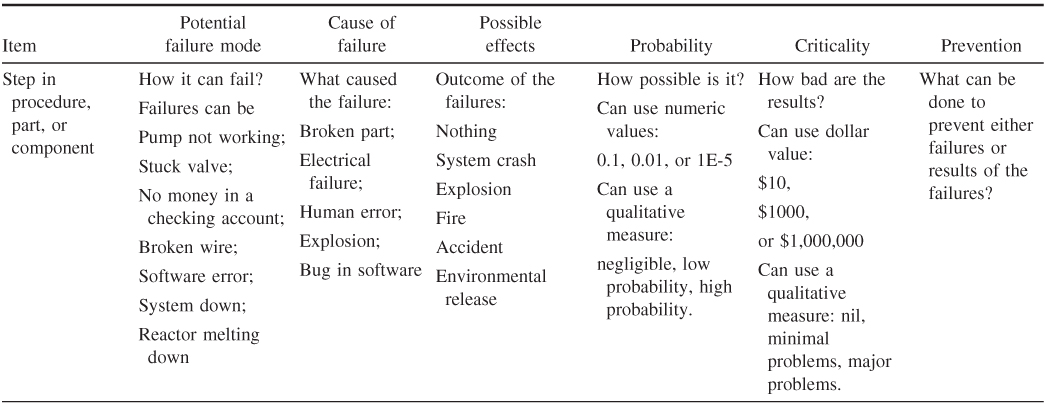
The following constitutes the steps of an FMEA. These steps will be illustrated by use of an example.
The first step is to create a flow diagram of the procedure. This is a relatively simple process in which a table or block diagram is constructed that shows the steps in the procedure. Table 9.2 shows the simple steps of starting a manual lawn mower. Note that this is a reasonable analysis and not an exhaustive analysis.
Table 9.2 Process Steps
| FMEA, starting a lawn mower |
| Process steps |
| Check gas and oil |
| Fill as necessary |
| Set controls |
| Initiate starter |
Table 9.3 shows the failure modes associated with process steps.
Table 9.3 Failure Modes
| FMEA, starting a lawn mower | |
| Process steps | Potential failure modes |
| Check gas and oil | Unable to remove gas cap Unable to remove oil plug Unable to determine depth of oil Oil or gas spill |
| Fill as necessary | No oil available Gas station closed No gas container Overfill gas Overfill oil Water in gas or oil |
| Set controls | Controls broken No instruction available Controls out of adjustment |
| Initiate starter | Starter malfunction Cord broken Engine flooded Ignition system malfunction |
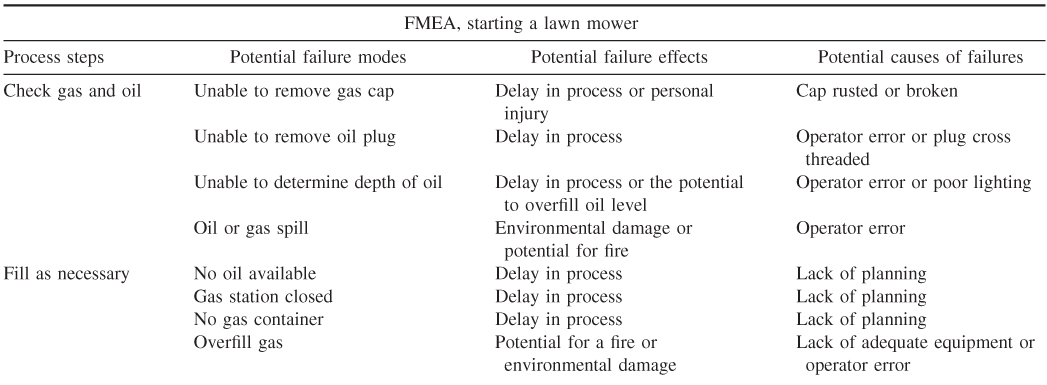
Table 9.4 shows the effect of the potential failures.
Table 9.4 Effect of Potential Failures
| FMEA, starting a lawn mower | ||
| Process steps | Potential failure modes | Potential failure effects |
| Check gas and oil | Unable to remove gas cap | Delay in process or personal injury |
| Unable to remove oil plug | Delay in process | |
| Unable to determine depth of oil | Delay in process or the potential to overfill oil level | |
| Oil or gas spill | Environmental damage or potential for fire | |
| Fill as necessary | No oil available | Delay in process |
| Gas station closed | Delay in process | |
| No gas container | Delay in process | |
| Overfill gas | Potential for a fire or environmental damage | |
| Overfill oil | Environmental damage | |
| Water in gas or oil | Delay in process or engine damage | |
| Set controls | Controls broken | Delay in process |
| No instruction available | Delay in process | |
| Controls out of adjustment | Delay in process or engine damage | |
| Initiate starter | Starter malfunction | Delay in process and/or repairs necessary |
| Cord broken | Delay in process and/or repairs necessary | |
| Engine flooded | Delay in process | |
| Ignition system malfunction | Delay in process and/or repairs necessary | |
Table 9.5 lists the potential causes of the failures.
Table 9.5 Potential Causes of the Failures
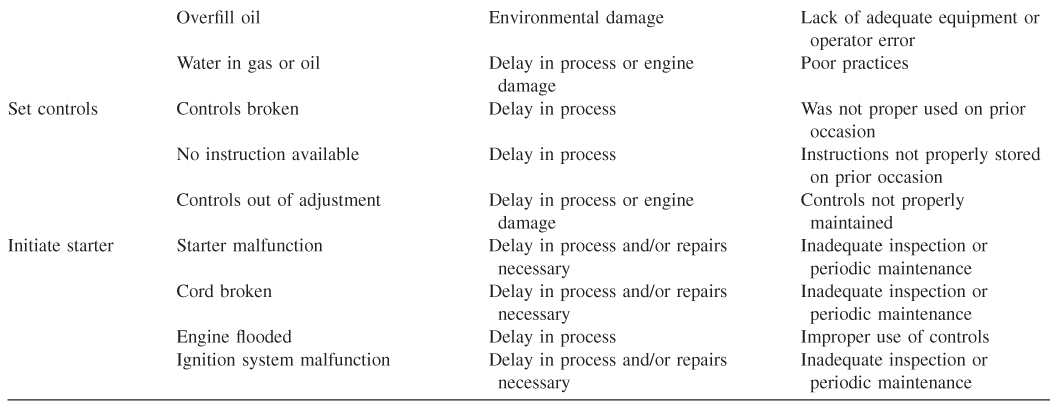
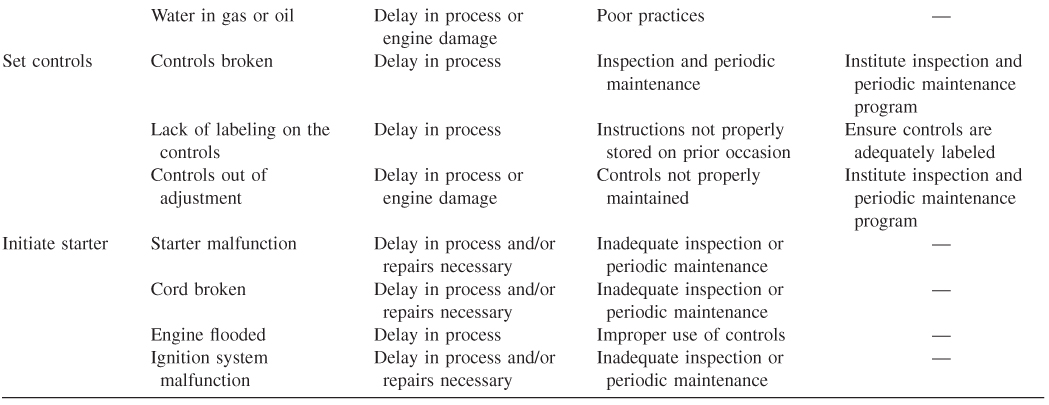
The basic process is complete once these four steps are completed. However, the next step in the FMEA process is very important for the procedure development process, that is, providing a column listing the control measures for each of the potential failure causes. This step ensures that control measures are present and/or are adequate for each cause. It is very important to ensure that causes are not dismissed until
there is an adequate control measure in place. Table 9.6 shows a list of the control measures for each cause.
Table 9.6 Control Measures
An additional technique used in FMEAs is to add the dimension of probability and criticality. This is known as a failure mode, effects, and criticality analysis (FMECA). An FMECA is an especially important technique for the assessment of risks in procedures because it can aid in
The criticality is mainly a qualitative measure of how critical the failure to the process really is. It is usually based on subject matter experts' opinion but can also be based on probability of occurrence and/or on the consequence or effect.
For the purposes of an FMECA, rough calculations can be developed using
- historical data;
- a Delphi-like technique (3);
- accident data;
- subject matter expert(s);
- best estimate.
Table 9.7 presents a way to calculate criticality based on probability.
Table 9.7 Criticality
| FMECA criticality | ||
| Criticality | Relative probability rates | Probability rates |
| Very high: failure is almost inevitable | 1 in 3 to 1 in 2 | 0.33 to >0.50 |
| High: generally associated with processes similar to previous processes that have failed | 1 in 20 to 1 in 8 | 0.05–0.125 |
| Moderate: generally associated with processes that have experienced occasional failures | 1 in 2000 to 1 in 80 | 0.005–0.0125 |
| Low: isolated failures associated with similar processes | 1 in 15,000 | 0.000067 |
| Very low: only isolated failures associated with almost identical processes | 1 in 150,000 | 0.0000067 |
| Remote: failure unlikely. No failure ever associated with an almost identical processes | 1 in 1,500,000 | 0.00000067 |
Note that the probability numbers in Table 9.7 provide an indication of the level of criticality and not an absolute failure probability.
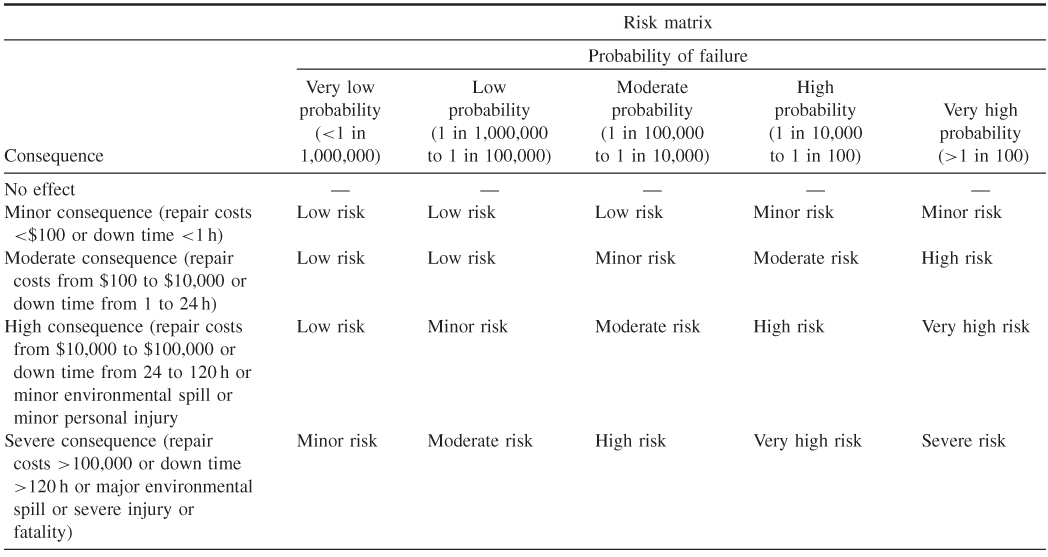
Organizations have also developed risk matrices that can also be used to indicate criticality. Table 9.8 shows such a matrix. Note that these matrices provide a way to combine the probability of occurrence with severity of consequence. Also note that these matrices are subjective in nature but do provide a way to systematically assess risk.
Table 9.8 Example of a Risk Matrix
The following example (Table 9.9) shows all the elements of an FMECA developed for assessing the steps in the lawn-mower-starting example. Note that probability can also be included. The first step in this process is to determine what “criticality” means in this context. Is it how bad the consequences might be? Or how critical the step is in the operation of the system? For this process, we will make the assumption that criticality means how bad the consequences might be if we do not perform the step correctly.
Table 9.9 Criticality Analysis
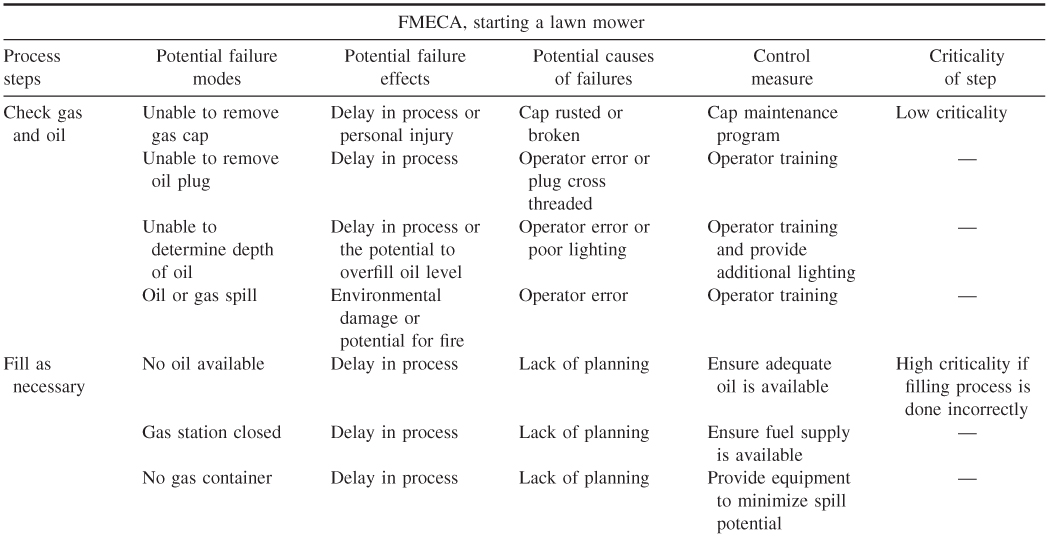
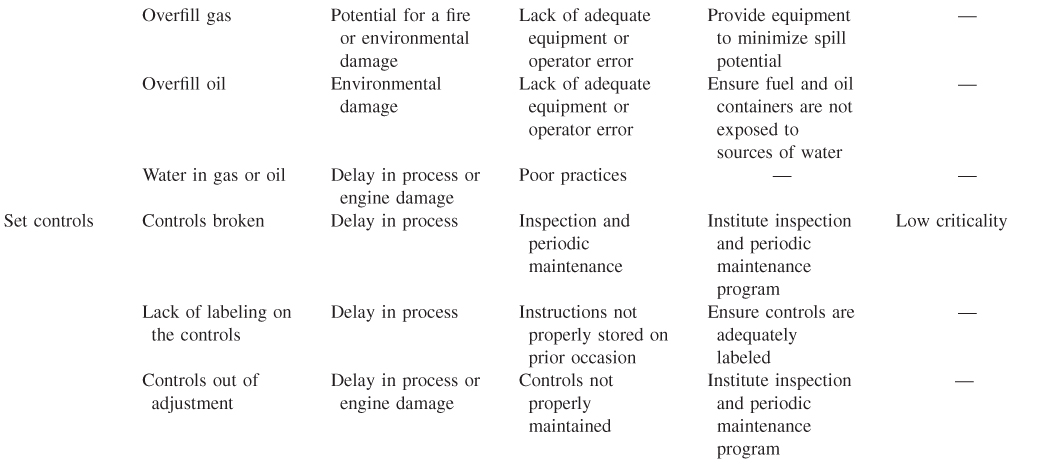
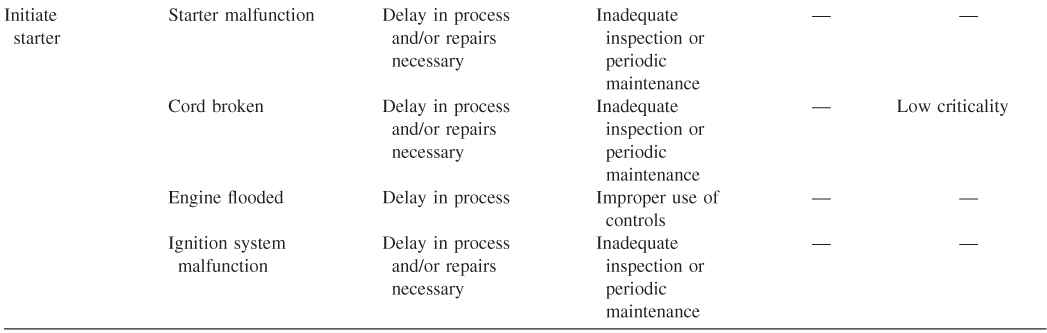
The high criticality step in this process concerns adding oil or fuel. In these cases, warnings/cautions should be included in the procedure or the system should be modified to include controls to prevent adding fuel to a hot engine.