18.3 Event Tree and Fault Tree Analysis
As discussed in Chapters 12 and 14, an event tree is a graphical representation of a series of possible events in an accident sequence (2). Using this approach assumes that as each event occurs there are only two outcomes, failure or success. A success ends the accident sequence and the postulated outcome is that the accident sequence was either terminated successfully or mitigated successfully. For instance, a fire starts in an engine. This is the initiating event. Then the automated system closes fuel feed. If the lack of fuel does not extinguish the fire, the next step is that the fire suppression system is challenged. If the system actuates the fire suppression system, the fire is suppressed and the event sequence ends. If the fire suppression system fails, the fire is not suppressed and the accident sequence progresses. Table 18.6 shows this postulated accident sequence. Figure 18.1 shows this accident sequence in an event tree.
Figure 18.1 Event tree.
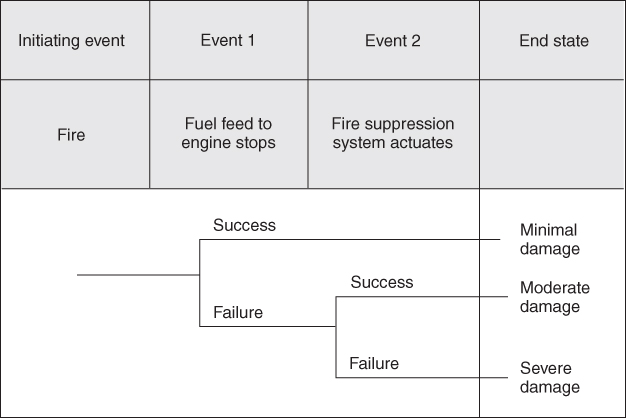
Table 18.6 Accident Sequence
| Event | Description | Possible outcomes |
| Fire | This is the initiating event | — |
| Fuel feed is stopped | The lack of fuel causes the fire to stop | Success: the fire stops |
| Failure: the fire continues | ||
| Fire suppression system actuates | The fire suppression system detects the fire and it actuates | Success: system actuates and controls the fire |
| Failure: fire destroys the engine |
As in most of the risk assessment techniques, probabilities can be assigned to the events and combined using the appropriate Boolean logic to develop an overall probability for the various paths in the event (Table 18.7). Using our example from above, we will now add
Table 18.7 Event Sequence with Probabilities
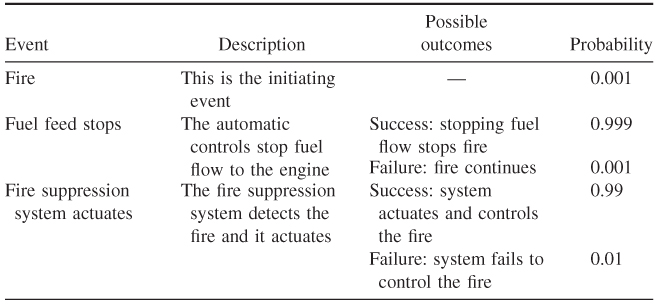
probabilities to the events and show how the probabilities combine for each path. Figure 18.2 shows the addition of path probability to the event tree.
Figure 18.2 Event tree with path probabilities.
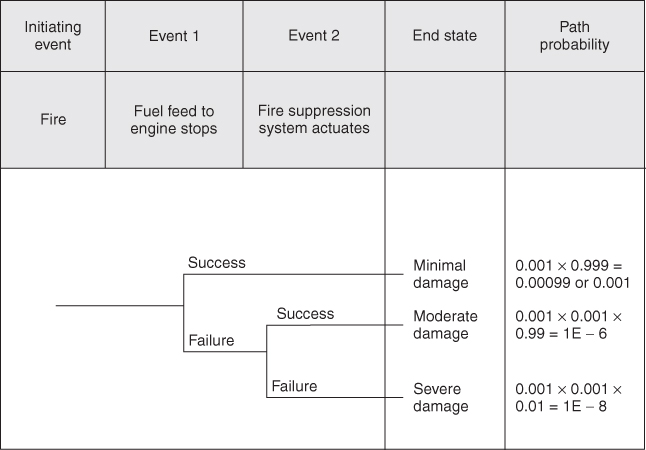
The result of this analysis tells us that the probability derived for a fire in which the fuel feed system stops fuel supply to engine actuates and the consequence in minimal damage is approximately 1/1000 or 1 × 10⁻³. The probability derived for a fire in which the fuel feed system fails to actuate, but the fire suppression system successfully extinguishes the fire and there is only moderate damage is 1E–6 or 1 × 10⁻⁶. Finally, the probability that a fire occurs and both the fuel feed system fails and fire suppression system fails and severe damage occurs is 1E - 8 or 5 × 10⁻⁸.
This approach is considered inductive in nature, meaning the system uses forward logic. A fault tree, discussed in Chapter 14, is considered deductive because usually the analyst starts at the top event and works down to the initiating event. In complex risk analyses, event trees are used to describe the major events in the accident sequence and each event can then be further analyzed using a technique most likely being a fault tree (3).
As indicated, the fault tree begins at the end, so to speak. This top-down approach starts by supposing that an accident takes place (2). It then considers the possible direct causes that could lead to this accident. Next, it looks for the origins of these causes. Finally, it looks for ways to avoid these origins and causes. The resulting diagram resembles a tree, thus the name.
Fault trees can also be used to model success paths as well. In this regard, they are modeled with the success at the top and the basic events are the entry level success that put the system on the path to success.
The goal of fault tree construction is to model the system conditions that can result in the undesired event. Before construction of a fault tree, the analyst must acquire a thorough understanding of the system. A system description should be part of the analysis. The analysis must be bounded, both spatially and temporally, in order to define a beginning and end point for the analysis. The fault tree is a model that graphically and logically represents the various combinations of possible events, both fault and normal, occurring in a system leading to the top event. The term event denotes a dynamic change of state that occurs to a system element. System elements include factors related to hardware, software, human, and environmental (2).
Events representing failures of equipment or humans (components) can be divided into failures and faults. A component failure is a malfunction that requires the component to be repaired before it can successfully function again. For example, when a turbine blade in an engine breaks, it is classified as a component failure. A component fault is a malfunction that will “heal” itself once the condition causing the malfunction is corrected. An example of a component fault is a switch whose contacts fail to operate because they are wet. Once they are dried, they will operate properly.
Output events include the top event, or ultimate outcome, and intermediate events, usually groupings of events. Basic events are used at the ends of branches since they are events that cannot be further analyzed. A basic event cannot be broken down without losing its identity. The undeveloped event is also used only at the ends of event branches. The undeveloped event represents an event that is not further analyzed either because there is insufficient data to analyze or because it has no importance to the analysis.
A top event and boundary conditions must be determined when defining the problem. Boundary conditions include:
- system physical boundaries;
- level of resolution;
- initial conditions;
- not allowed events;
- existing conditions;
- other assumptions.
Top events should be precisely defined for the system being evaluated. A poorly defined top event can lead to an inefficient analysis.
Construction begins at the top event and continues, level by level, until all fault events have been broken into their basic events. Several basic rules have been developed to promote consistency and completeness in the fault tree construction process. Refer to Chapter 14 for a discussion concerning the rules of constructing a fault tree.
Many times it is difficult to identify all of the possible combinations of failures that may lead to an accident by directly looking at the fault tree. One method for determining these failure paths is the development of “minimal cut sets.” Minimal cut sets are all of the combinations of failures that can result in the top event. The cut sets are useful for ranking the ways the accident may occur and are useful for quantifying the events, if the data is available. Large fault trees require computer analysis to derive the minimal cut sets, but some basic steps can be applied for simpler fault trees.
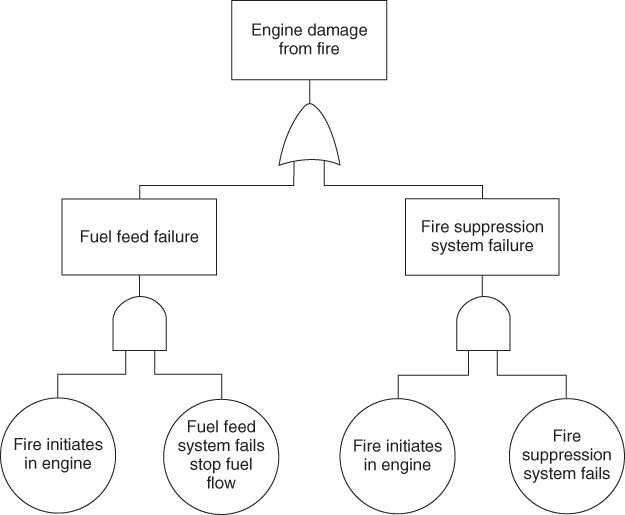
By evaluating the minimal cut sets, an analyst may efficiently evaluate areas for improved system safety. The analyst should provide a description of the system analyzed, as well as a discussion of the problem definition, a list of the assumptions, the fault tree model(s), lists of minimal cut sets, and an evaluation of the significance of the minimal cut sets. Any recommendations should also be presented. An example of fault tree for the engine fire is shown in Figure 18.3.
Figure 18.3 Example fault tree.