
7.6 Using Probability
The following examples will explore more applications of probability. Let us start by looking at flipping a coin, which is a single event. The total number of possible outcomes when flipping a coin is 2, either heads or tails. The two would be placed in the denominator. If we wanted to know the probability that the outcome would be heads then the expression would look like ![]() or a 0.5% chance it would be heads.
or a 0.5% chance it would be heads.
Frequently, we want to know the probability of two things happening; in other words, one thing happens AND then another thing happens (AND means multiply). You multiply the probability of one thing happening by the probability of the other thing happening. What is the probability of the following:
Now, look at one that is a little more complicated, such as rolling two dice. There are 36 possible outcomes when rolling two dice. Using Table 7.4, the probability that a three would be rolled could be determined.
Table 7.4 Dice Matrix
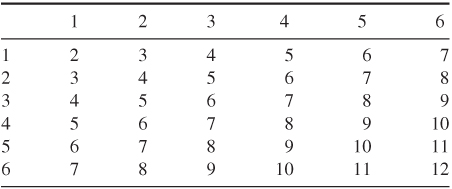
There are two possible ways of rolling the two dice so that they add up to three; therefore, the probability of rolling two dice so that they add up to three is 2/36 or 1/18 chances.
Using the matrix above, one could determine the possibility of rolling two dice and rolling a 3 thrice in a row. The probability of rolling a three was 1/9 as determined above. To find the probability of rolling a 3 thrice in a row, multiply 1/9 by itself thrice or 1/9 × 1/9 × 1/9 = 1/729.
Suppose you have a bag containing 14 red marbles, 12 blue marbles, and 18 green marbles.
Suppose you roll two dice, a red one and a green one.
When a polling agency says its confidence level is 95%, it is saying that the probability of its numbers being correct is 0.95. What is the probability their numbers are wrong? (100% − 95%) or (1 − 0.95) = 5% or 0.05.
An art class has 13 right-handers and 7 left-handers.
Tree diagrams can help you to visualize a probability problem such as flipping a coin or rolling dice. The diagram helps you to visualize a probability problem. Suppose you are going to flip a coin three times. You could see a tree diagram to visualize all of the possibilities. An example of this is in Figure 7.2.
Figure 7.2 Tree diagrams of coin flip.
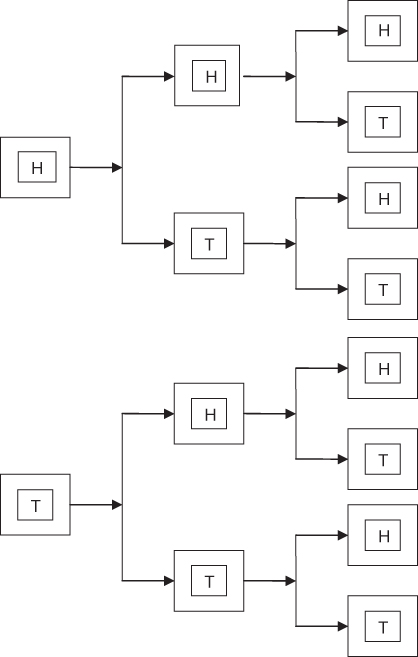
So, one of the possibilities would be T, H, H. There are eight possible combinations when flipping a coin three times in a row.
What is the probability of being dealt two hearts? Solve this problem by using Figure 7.3, a tree diagram.
Figure 7.3 Tree diagram of being dealt two hearts.
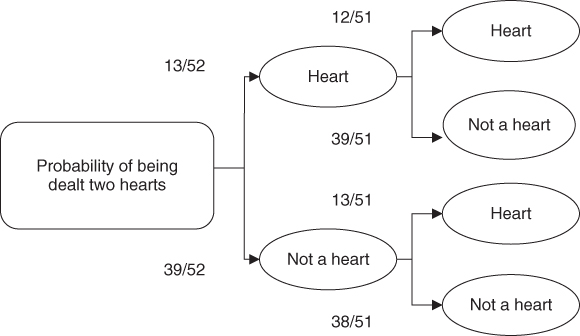
To solve, multiply the probabilities along one whole “limb.” So multiplying along the top limb, we have 13/52 × 12/51 = 0.06 or 6%. With a tree diagram we can see other possible outcomes. For example, looking along the very bottom “limb” the probability of not getting a heart at all is 39/52 × 38/51 = 0.56 or 56%.
To summarize tree diagrams for probability