
10.3 HRA Modeling
The purpose of the HRA model is to give a visual representation of the sequence of steps that:
- shows the potential human errors and their mechanisms;
- shows recovery paths;
- enables error quantification.
There are numerous methods for modeling the HRA. Examples are HRA event trees, fault trees, generic error modeling (GEM) causation diagrams, human error modeling/investigation tool (HERMIT), and the human error rate assessment and optimizing system (HEROS) (3).
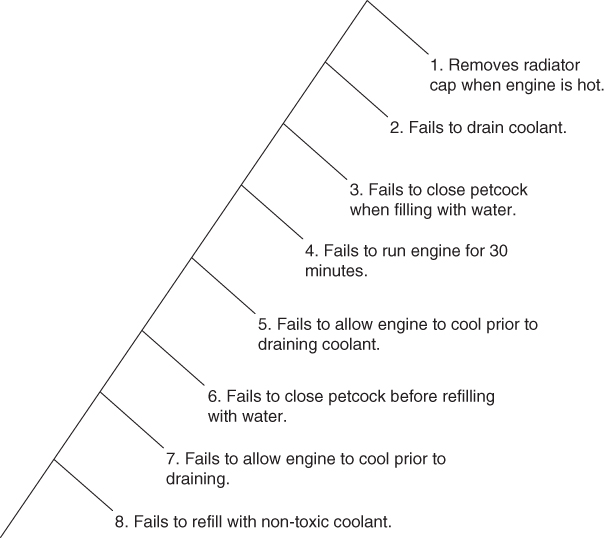
Regardless of the methods used, the end result needs to be each step from the task analysis visually depicted as a failure with the applicable recovery actions. For example, we will use the HRA event tree method to model the task analysis done above on step 3, Verify Rods Inserted. The first step is to identify and number the actions in the task analysis that involves a potential for human error as shown in Figure 10.2.
Figure 10.2 HRA event tree method.
Note that the step involving pushing the All Rods button is not numbered. This is because the button only has two positions pushed or not pushed. The Rod Deselect button is included because it must be pushed until it locks in position.
In an HRA event tree, the steps are worded as negatives (i.e., a failure to perform the action). The recovery actions are worded as positives (i.e., successfully performing the recovery action). Written as text, the example steps would look like Table 10.1.
Table 10.1 Recovery Action
| Step | Failure action | Recovery action |
| 1 | Operator fails to find Rod Deselect button | Operator finds Rod Deselect button |
| 2 | Operator fails to lock Rod Deselect push button in Deselect position | Operator locks Rod Deselect push button in Deselect position |
| 3 | Operator fails to find All Rods button | Operator finds All Rods button |
| 4 | Operator fails to verify all 164 rods indicate:—(double dash) | Operator verifies all 164 rods indicate:—(double dash) |
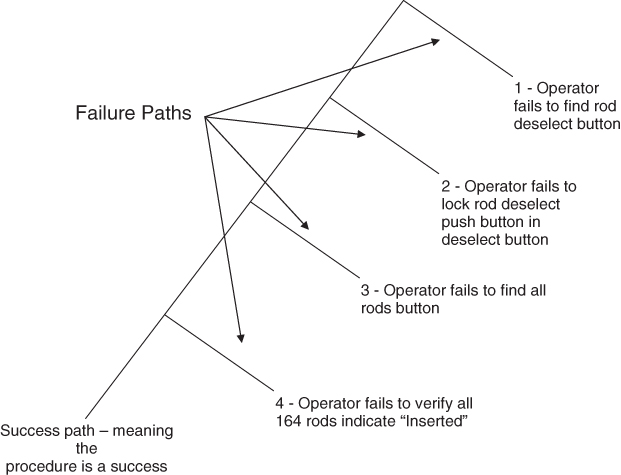
The HRA event tree for step 3, Verify Rods Inserted, is depicted in Figure 10.3 with the failures on the right side of the tree and successes on the left side. Figure 10.4 shows another depiction of the same task.
Figure 10.3 Verify Rods Inserted.
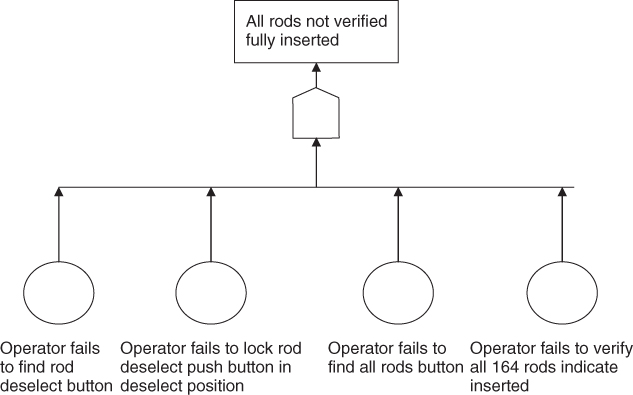
Figure 10.4 Another View of Verified Rods.
If the sequence were laid out in a logic tree, it would look like Figure 10.4.
10.3.1 Summary Points
- The purpose of the HRA model is to give a visual representation of the sequence of steps.
- Regardless of the methods used, the end result needs to be each step from the task analysis visually depicted as a failure with the applicable recovery actions.
- The steps are worded as negatives. The recovery actions are worded as positives.